http://www.sciencepublishinggroup.com/j/ijem doi: 10.11648/j.ijem.20170102.12
Review Article
Business Analytics: Concept to Store, Explore & Retrieve
Data Marts, Data Warehouses and Bigdata for Digital Edge
Business
Md. Sadique Shaikh
Institute of Management & Science (IMS), Sakegaon-Bhusawal, Maharastra State, India
Email address:
sids_nsk@rediffmail.com
To cite this article:
Md. Sadique Shaikh. Business Analytics: Concept to Store, Explore & Retrieve Data Marts, Data Warehouses and Bigdata for Digital Edge Business. International Journal of Engineering Management. Vol. 1, No. 2, 2017, pp. 48-53. doi: 10.11648/j.ijem.20170102.12
Received: March 23, 2017; Accepted: April 14, 2017; Published: June 13, 2017
Abstract:
The development of business analysis as a professional discipline has extended the role and responsibilities of the business analyst (BA). Increasingly, BAs are engaged at an early point. They investigate ideas and problems, formulate options for a way forward and produce business cases setting out their conclusions and recommendations. As a result, the responsibility for advising organisations on effective courses of action lies with BAs, and their work precedes that of the project manager. The early engagement of BAs also places a critical responsibility upon them – the need to ensure that all business changes are in line with the mission, objectives and strategy of the organisation. This business context is the key foundation for understanding and evaluating all ideas, proposals, issues and problems put forward by managers. While few BAs are involved in analyzing and developing strategy, it is vital that they know about the strategy of their organisation so that they can conduct their work with a view to supporting the implementation of the strategy and the achievement of the business objectives. This research paper gives fundamental modeling of Business Analytics with its scope in management science and organization.Keywords:
Business Analytics, Data Mart, Data Warehouse, Business Intelligence, Bigdata, Bigdata Management, Digital Strategy1. Introduction
Business analytics begins with a data set (a simple collection of data or a data file)or commonly with a database (a collection of data files that contain information on people, locations, and so on). As databases grow, they need to be stored somewhere. Technologies such as computer clouds (hardware and software used for data remote storage, retrieval, and computational functions) and data warehousing (a collection of databases used for reporting and data analysis) store data. Database storage areas have become so large that a new term was devised to describe them. Big data describes the collection of data sets that are so large and complex that software systems are hardly able to process them (Isson and Harriott, 2013, pp. 57–61). Isson and Harriott (2013, p. 61) define little data as anything that is not big data. Little data describes the smaller data segments or files that help individual businesses keep track of customers. As a means of
sorting through data to find useful information, the application of analytics has found new purpose. Three terms in business literature are often related to one another: analytics, business analytics, and business intelligence. Analytics can be defined as a process that involves the use of statistical techniques (measures of central tendency, graphs, and so on), information system software (data mining, sorting routines), and operations research methodologies (linear programming) to explore, visualize, discover and communicate patterns or trends in data. Simply, analytics convert data into useful information. Analytics is an older term commonly applied to all disciplines, not just business. A typical example of the use of analytics is the weather measurements collected and converted into statistics, which in turn predict weather patterns.
Sciences (INFORMS) organization (www.informs.org) suggests for grouping the types of analytics. These types of analytics can be viewed independently. For example, some firms may only use descriptive analytics to provide information on decisions they face. Others may use a combination of analytic types to glean insightful information needed to plan and make decisions.
2. Related Terminology
It is useful to be familiar with a few special terms when studying the literature on multidimensional databases.
2.1. OLAP
OLAP abbreviates On-Line Analytical Processing. As opposed to the well-known OLTP(On-Line Transaction Processing), focus is on data analyses rather than transactions. Furthermore, the analyses occur “On-Line,” i.e., fast, “interactive” query response is implied. OLAP systems always employ a multidimensional view of data.OLAP systems come in three broad categories: systems based on relational database management technology, called ROLAP systems, systems utilizing non-relational, multidimensional array type technologies, called MOLAP systems, and hybrid systems that combine these technologies, called HOLAP systems.
2.2. Data Warehouse
A data warehouse is a repository of integrated enterprise data. A data warehouses used specifically for decision support, i.e., there is (typically or ideally) only one data warehouse in an enterprise. A data warehouse typically contains data collected from a large number of sources within, and sometimes also outside, the enterprise.
2.3. Data Mart
A data mart is a subset of a data warehouse.
2.4. ETL
ETL (Extract-Transform-Load) is the three-step process that feeds a data warehouse. First, an extraction process is applied to data from operational source systems, e.g., ERP systems. Second, a transformation process is applied in order to change the data format from the source system formats into the data warehouse format. This includes combining data from several different sources and performing cleansing to correct errors such as missing or wrong data. Third, a loading process is applied to import the data into the data warehouse. ETL is at times also referred to as ETT (Extract-Transform-Transport).
2.5. Business Intelligence
Business Intelligence (BI) is the process of making “intelligent” business decisions based on the analysis of available data. From a technology point of view, BI covers the combined areas of data warehousing, reporting, OLAP, data
mining, some data visualization, what-if analysis, and special-purpose analytical applications.
3. Bigdata
Big Data is a term often applied by people to describe data sets whose size is beyond the capability of commonly used software tools to capture, manage, and process. The sheer size of the data, combined with complexity of analysis and commercial imperative to create value from it, has led to a new class of technologies and tools to tackle it. The term Big Data tends to be used in multiple ways, often referring to both the type of data being managed as well as the technology used to store and process it. In the most part these technologies originated from companies such as Google, Amazon, Facebook and Linked-In, where they were developed for each company’s own use in order to analyze the massive amounts of social media data they were dealing with. Due to the nature of these companies, the emphasis was on low cost scale-out commodity hardware and open source software.
The world of Big Data is increasingly being defined by the 4 Vs. i.e. these ‘Vs’ become a reasonable test as to whether a Big Data approach is the right one to adopt for a new area of analysis. The Vs are:
3.1. Volume
The size of the data. With technology it’s often very limiting to talk about data volume in any absolute sense. As technology marches forward, numbers get quickly outdated so it’s better to think about volume in a relative sense instead. If the volume of data you’re looking at is an order of magnitude or larger than anything previously encountered in your industry, then you’re probably dealing with Big Data. For some companies this might be 10’s of terabytes, for others it may be 100’s of petabytes.
3.2. Velocity
The rate at which data is being received and has to be acted upon is becoming much more real-time.While it is unlikely that any real analysis will need to be completed in the same time period, delays in execution will inevitably limit the effectiveness of campaigns, limit interventions or lead to sub-optimal processes. For example, some kind of discount offer to a customer based on their location is less likely to be successful if they have already walked some distance past the store.
3.3. Variety
narrow range of data. Deferring the point at which this kind of rich data, which isoften not fully understood by the business, also has significant appeal and avoids costly and frustrating modeling mistakes. It follows then that by being more inclusive and allowing greater model flexibility additional value maybe created - this is perhaps one of the major appeals of the Big Data approach
3.4. Value
The commercial value of any new data sources must also be considered. Or, perhaps more appropriately, we must consider the extent to which the commercial value of the data can be predicted ahead of time so that ROI can be calculated and
project budget acquired. ‘Value’ offers a particular challenge to IT in the current harsh economic climate. It is difficult to attract funds without certainty of the ROI and payback period. The tractability of the problem is closely related to this issue as problems that are inherently more difficult to solve will carry greater risk, making project funding more uncertain. Big Data technologies can have a significant impact on the overall picture of “information ROI” as well as more specific project viability by minimizing up-front investment prior to developing a more complete understanding of value through the discovery process. See Extending the Boundaries of Information Management for more details of this discovery process
4. BA-Modeling
4.1. Business Analytics Process Model (BAPM)
Figure 1. BAMP.
Thomas Devonport in his book titled, “Competing on analytics: The new science of winning”, claims that a significant proportion of high-performance companies have high analytical skills among their personnel.On the other hand, a recent study has also revealed that more than 59% of the organizations do not have information required for decision-making. In a recent article1 based on a survey of nearly 3000 executives, MIT Sloan Management Review reported that there is striking correlation between an organization’s analytics sophistication and its competitive performance. The biggest obstacle to adopting analytics is the
lack of knowhow about using it to improve business performance. I shown in my first model Business Analytics use statistical, operations research and management tools to drive business performance. Many companies offer similar kind of products and services to customers based on similar design and technology and find it difficult to differentiate their product/service from their competitors. Business Analytics helps companies to find the most profitable customer and allows them to justify their marketing effort, especially when the competition is very high.
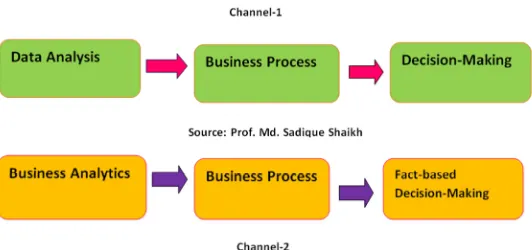
4.2. Business Analytics Channel Model (BAC-M)
Business Analytics is a set of techniques and processes that can be used to analyze data to improve business performance through fact-based decision-making as I exhibit in my second model with selecting channel-2 instead of channel one.i.e. only decision making usingdata analysis. Business Analytics is the subset of Business Intelligence, which creates capabilities for companies to compete in the market effectively. Business Analytics is likely to become one of the main functional areas in most companies. Analytics\ companies develop the ability to support their decisions through analytic reasoning.
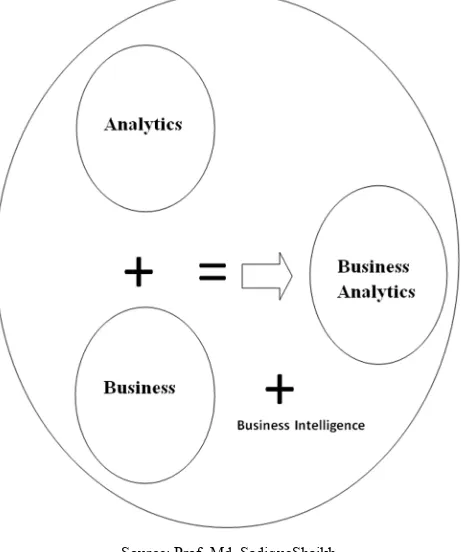
4.3. BA-BI Integration Model
Three terms in business literature are often related to one another: analytics,business analytics, and business intelligence. Analytics can be defined as a processthat involves the use of statistical techniques (measures of central tendency, graphs,and so on), information system software (data mining, sorting routines), and operations research methodologies (linear programming) to explore, visualize, discover and communicate patterns or trends in data. Simply, analytics convert data into useful information. Analytics is an older term commonly applied to all disciplines, not just business. A typical example of the use of analytics is the weather measurements collected and converted into statistics, which in turn predict weather patterns. Hence business analytics cascade analytics and business to formulate term Business Analytics where further integration tends to Business intelligence as shown in my third model.
Source: Prof. Md. SadiqueShaikh
Figure 3. BA-BI Integration Model.
4.4. BA Variation Model
Source: Prof. Md. SadiqueShaikh
Figure 4. BA Variation Model.
This is my last model to discuss, there are many types of analytics, and there is a need to organize these types to understand their uses. We will adopt the three categories (descriptive, predictive, and prescriptive) that the Institute of Operations Research and Management Sciences (INFORMS) organization (www.informs.org) suggests for grouping the types of analytics. These types of analytics can be viewed independently. For example, some firms may only use descriptive analytics to provide information on decisions they face. Others may use a combination of analytic types to glean insightful information needed to plan and make decisions.
5. Types of Analytics
5.1. Descriptive
The application of simple statistical techniques that describes what is contained in a data set or database. Example: An age bar chart is used to depict retail shoppers for a department store that wants to target advertising to customers by age.
5.2. Predictive
5.3. Prescriptive
An application of decision science, management science, and operations research methodologies (applied mathematical techniques) to make best use of allocable resources. Example: A department store has a limited advertising budget to target customers. Linear programming models can be used to optimally allocate the budget to various advertising media.The purposes and methodologies used for each of the three types of analytics differ, as can be seen above. It is these differences that distinguish analytics from business analytics. Whereas analytics is focused on generating insightful information from data sources, business analytics goes the extra step to leverage analytics to create an improvement in measurable business performance. Whereas the process of analytics can involve any one of the three
types of analytics, the major components of business analytics include all three used in combination to generate new, unique, and valuable information that can aid business organization decision-making. In addition, the three types of analytics are applied sequentially (descriptive, then predictive, then prescriptive). Therefore, business analytics (BA) can be defined as a process beginning with business-related data collection and consisting of sequential application of descriptive, predictive, and prescriptive major analytic components, the outcome of which supports and demonstrates business decision-making and organizational performance. Stubbs (2011, p. 11) believes that BA goes beyond plain analytics, requiring a clear relevancy to business, a resulting insight that will be implementable, and performance and value measurement to ensure a successful business result.
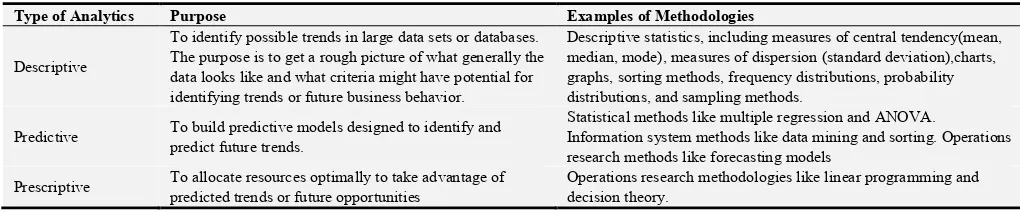
Table 1. Analytics summary table.
Type of Analytics Purpose Examples of Methodologies
Descriptive
To identify possible trends in large data sets or databases. The purpose is to get a rough picture of what generally the data looks like and what criteria might have potential for identifying trends or future business behavior.
Descriptive statistics, including measures of central tendency(mean, median, mode), measures of dispersion (standard deviation),charts, graphs, sorting methods, frequency distributions, probability distributions, and sampling methods.
Predictive To build predictive models designed to identify and predict future trends.
Statistical methods like multiple regression and ANOVA.
Information system methods like data mining and sorting. Operations research methods like forecasting models
Prescriptive To allocate resources optimally to take advantage of predicted trends or future opportunities
Operations research methodologies like linear programming and decision theory.
6. Conclusion
I have discussed several facts about business analytics through the models. The majority of respondents referred to BI when thinking about business analytics, with PM also in the back of their minds. Business analytics may be the next logical step in the evolution of BI, with business analytics being more comprehensive, providing a software taxonomy that incorporates other disciplines such as PM and predictive analytics. However, the true indication of evolution may be that business analytics requires us to think beyond the confines of technology. Successful organizations that invest in business analytics software will also take into account the culture, processes and performance strategies. Business analytics is broad enough to include capabilities and solutions that benefit a variety of disciplines. Interestingly, most respondents feel that business analytics is not just primarily an IT or business function, but is a function of both IT and business. With this approach, there is an increased need for collaboration across organizations on issues relating to business analytics, as well as the need for cross departmental management teams for oversight. The top software tools that respondents consider part of business analytics span across various areas, including analytics, data integration, query/reporting and PM. Given that business analytics is designed to enable fact-based decision-making by all decision-makers, it is not surprising that nearly three-quarters of respondents viewed business analytics as a function of both IT and business. Respondents said the key benefits currently
derived or expect to be derived from using business analytics software encompass various areas of business analytics, with the top two benefits related to improving and speeding up the decision-making process. Other key benefits included:
a) aligning resources with strategies b) realizing cost efficiencies
c) responding to user needs for availability of data on a timely basis
d) improving the organization’s competitiveness
e) producing a single, unified view of enterprise wide information
f) synchronizing financial and operational strategies g) increasing revenues
References
[1] Bartlett, R. (2013) A Practitioner’s Guide to Business Analytics.McGraw-Hill,New York, NY.
[2] Elbing, A. O. (1970) Behavioral Decisions in Organizations. Scott Foresmanand Company, Glenview, IL.
[3] Isson, J. P., Harriott, J. S. (2013) Win with Advanced Business Analytics. John Wiley & Sons, Hoboken, NJ.
[4] Negash, S. (2004) “Business Intelligence.” Communications of the Association ofInformationSystems. Vol. 13, pp. 177– 195.
[6] Stubbs, E. (2011) The Value of Business Analytics. John Wiley & Sons, Hoboken, NJ.
[7] The Digital Finance Imperative: Measure and manage what matters next, CGMA / Oracle, 2015
[8] Global Management Accounting Principles©, CGMA, 2014
[9] From insight to impact: Unlocking opportunities in big data, CGMA, 2013
[10] Joining the dots: Decision making for a new era, CGMA, 2016
[11] Gorry and M. S. Scott-Morton, A Framework for Information Systems, Sloan Management Review, Vol. 13, No. 1, 1971, pp. 56-79; and P. G. W. Keen, Decision Support Systems: An Organizational Perspective, Reading, Mass., Addison-Wesley, 1978
[12] D. Ariely, Predictably Irrational: The Hidden Forces that Shape our Decisions, Harper Collins, 2008
[13] H. A. Simon, Theories of decision-making in economics and behavioral science, American Economic Review, 49, 1959, pp. 253-283; and R. Axelrod, Structure of Decision: The Cognitive Map of Political Elites, Princeton University Press, 1976
[14] P. Todd and I. Benbasat, The use of information in decision making: An experimental investigation of the impact of computer based decision aids, MIS Quarterly, Vol. 16, No. 3, 1992, pp. 373-393
[15] Vandenbosch and S. L. Huff, Searching and scanning: how executives obtain information from executive information systems, MIS Quarterly, Vol. 21, No. 1, 1997, pp. 81-107
[16] See D. Kahneman, Thinking, Fast and Slow, Farrar, Strauss and Giroux, New York, 2011