http://www.sciencepublishinggroup.com/j/ajaf doi: 10.11648/j.ajaf.20170504.15
ISSN: 2330-8583 (Print); ISSN: 2330-8591 (Online)
Technical Efficiency of Diversification Versus
Specialization of Vegetable-Based Farms in the West
Region of Cameroon
Teh Nguh Julie
1, Fon Dorothy Engwali
1, *, Bidogeza Jean-Claude
21
Department of Agricultural Economics, Faculty of Agronomy and Agricultural Sciences, University of Dschang, Dschang, Cameroon 2World Vegetable Centre, World Bank Group, Centre Region, Yaoundé, Cameroon
Email address:
[email protected] (T. N. Julie), [email protected] (F. D. Engwali) *Corresponding author
To cite this article:
Teh Nguh Julie, Fon Dorothy Engwali, Bidogeza Jean-Claude. Technical Efficiency of Diversification Versus Specialization of Vegetable-Based Farms in the West Region of Cameroon. American Journal of Agriculture and Forestry. Vol. 5, No. 4, 2017, pp. 112-120. doi: 10.11648/j.ajaf.20170504.15
Received: May 11, 2017; Accepted: May 22, 2017; Published: July 10, 2017
Abstract:
This study evaluated the efficiency of diversification versus specialization of vegetable-based farms in the West region of Cameroon. The study employed the use of a questionnaire to obtain information from 70 specialized and 54 diversified farmers randomly selected from three purposively selected localities in the West region. The one-step stochastic frontier approach with a Cobb-Douglas model specification was used in analysis. Data was analyzed using the computer program, STATA version 12.0. Findings revealed that majority (71.8%) of vegetable farmers are males, with an average age of 30 years and 73.4% had attained at least a primary education. Results of the stochastic frontier analysis revealed the mean technical efficiency of vegetable farmers to be 0.863. Mean technical efficiency scores for specialized and diversified farmers were found to be 0.867 and 0.858 respectively. However, the results of a standard t-test concluded that technical efficiency is invariant of cropping system. The main sources of inefficiency were identified to be farm size, education, credit and membership to a mutual aid group, while age, sex and access to extension information and services were found to enhance technical efficiency. The study therefore recommends extension services to be reinforced on farmers who receive loan and on those who belong to mutual aid groups, in a bid to increase technical efficiency.Keywords: Technical Efficiency, Diversification, Specialization, Vegetable Farms, West Region, Cameroon
1. Introduction
In agriculture, horticultural crops principally vegetables hold a significant position. These crops not only contribute to the share of agriculture in the national economy but possess a great potential and comparative advantage to compete in liberalized economy [1]. According to FAO [2], as of 2007, a total volume of over 880 million tons of vegetables were being produced globally. Cameroon’s exact contribution to this global quantity cannot be indicated with certainty since information on the production of vegetables in the country is mostly based on anecdotal evidence [3]. However, country statistics suggest that Cameroon’s exotic vegetable production increased from 873892 tons in 2009 to 1,267,017 tons in 2013 [4]. This significant increase in vegetable
production not only goes to satisfy demand/consumption, but also to solve the problem of unemployment and underemployment [5]. However, [5] report that although there seems to be an increase in vegetable production over the years, the demand for vegetable is high and is causing scarcity in the market. [6] attribute this scarcity to post harvest losses due to the perishable nature of vegetables, while [7] blame it on poor access to improved seeds which has compromised productivity [8]. on their part, attribute the non-availability of vegetables all year-round to inefficient management of resources/inputs available to the farmers. This is supported by [9] who opine that the key reason for the scarcity is the fact that local farmers are not technically efficient enough to meet the demand of the market.
the use of inputs as efficiently as possible to optimize production [10]. With the speedy globalization of major
seeds, agrochemicals industries and multinational
commodities companies in the country, the increase of urban population versus decrease of rural population, weather and climate variability patterns, changing trends of diets, in addition to a variety of risks that include price, yields and productivity risks, coupled with poor access to seeds, the short cycle nature of many vegetable crops, high perishable nature of the product, and the requirement of a ready-to-go market [7], it is becoming increasingly important for farmers to become more efficient in their ability to access and use available inputs.
Faced with the aforementioned challenges, as well as, increased competition and emerging new markets, many vegetable farmers tend to undertake significant strategic production decisions. While some vegetable farmers decide to develop their farms through specialization, others develop their farms by diversification. Several reasons have been advanced as driving forces behind the choice of one strategy over the other with increased efficiency being the focus. Unfortunately, little conclusion can be drawn concerning the efficiency of one strategy compared to the other as related to vegetable production.
Empirical studies [11-15] have shown that both specialization and diversification can be suitable strategies for strengthening a farm’s competitiveness and sustainability, yet also recognize that neither offers guaranteed success nor eminent failure, for even when farmers use the same inputs their outputs differ widely [16]. This notwithstanding, and faced with the challenge of achieving greater performance in vegetable production, farmers, as well as, policy makers must be aware of the fact that the reduction of inefficiency is completely within the control of the farmer, and farmers need to choose a strategy that can eliminate technical inefficiency [17].
In this light, quite a few studies have been conducted on the global scale in the domain of efficiency and its determinants in agriculture [11, 12, 18- 22], and vegetable production in general [1, 8-9, 16, 23, 24] and a few have been conducted on the effects on technical efficiency of diversification and specialization in particular [11, 12, 14, 15, 18]. However, to the best of the researchers’ knowledge, this is the first study that seeks to compare the efficiency of one strategy over the other.
The main question to this research therefore is how efficiently are vegetable farmers in the West region of Cameroon using or combining the available scarce resources at their disposal to produce the maximum desired output under the different strategies? In addition, knowledge of the factors that influence productivity differentials among farmers is very important. This requires identifying, factors that lead some farmers to produce more than others given the same inputs and challenges. Answers to these questions makes research of this nature worthwhile, as the results shed light on whether crop specialization, or alternatively diversification, is a desired strategy for combating scarcity in
vegetable all year round. On this basis, the study will be useful to smallholder farmers in effective resource utilization. This paper is divided into four parts, section 1 is introductory section, section 2 describes the materials and methods employed in the research. This is followed by section 3 in which the results obtained are presented and discussed based on the objectives and hypotheses of the
study. Section 4 concludes and gives relevant
recommendations.
2. Materials and Methods
2.1. The Study Area
This study was conducted in the West region of Cameroon. The region is among if not, the major vegetable supplier to other parts of the country and the Central African sub region [25]. The West region is located in the central-western portion of the Republic of Cameroon and lies between
Latitudes 5o30’N and Longitudes 10o30E [26]. High
elevations, and moderate to high humidity give the region one of Cameroon's most pleasant climates. The region is probably the leading region in small-scale commercial vegetable cultivation in Cameroon partly because of this favorable climate that allows the cultivation of most market gardening crops all year round. The temperature oscillates between 15°C minimum and 30°C maximum, with strong daily variations, with a mean temperature of 25°C and moderate rainfall. The climate is equatorial of the Cameroonian type in the northwestern portion and equatorial of the Guinea type in the southeastern part. Rainfall moderated by the mountains, averages 1000-2000 mm per annum. Elevations reach as high as 2000m and as low as 500m [26]. Agriculture is the mainstay of a considerable number of people in the West region of Cameroon. During the 60s, the people of the region practiced principally, the cultivation of Arabica coffee. But during the 80s, due to economic crisis, a lot of people were forced to diverge into the production of food and market gardening crops, alongside livestock farming. Various types of vegetables are cultivated, mostly in small back/front yard gardens but also increasing in medium to large-scale commercial enterprises. Vegetables produced in the region include cabbage, tomato, green bean, carrot, leek, green pepper, onion, lettuce, Irish potato, beetroot, African eggplant, nightshade, amaranth, celery and a variety of green spices, etc. The production system in the region is both rain-fed and irrigated systems, the rain-fed production system being most dominant. Sole cropping of vegetables (specialization) is the dominant cropping system although quite a few farmers grow vegetables alongside other food crops (diversification). Unreliable rainfall and deterioration of soil fertility are the major problems.
2.2. Stochastic Frontier Production Model
on production is usually inaccurate since smallholder farmers do not have updated data records on their farm operations [20], the present study employed the stochastic frontier model (SFM) which has been widely applied on similar studies in both developed and developing countries [8, 9, 12, 16, 18, 20, 23, 24, 27 28].
The strength of the SFM is that it considers statistical noise in data and also allows for the statistical testing of hypotheses concerning production structure and degree of inefficiency.
The main weaknesses are that, there is no a priori
justification for the selection of any particular parametric functional form representing the underlying technology as well as the distributional form for the inefficiency term, also the stochastic frontier approach is only well-developed for single output technology [29]. However, [30] argue that as long as interest rests on efficiency measurement and not on the analysis of the general structure of the production technology; the Cobb-Douglas production function provides an adequate representation of the production technology. [31, 32] report that the functional form has a discernible but rather small impact on estimated efficiency. Moreover, in cases of multiple outputs technologies, [29] suggests that the outputs be aggregated into a single output index. The general version of the stochastic production function is written as follows:
= ; (1)
where is the quantity of output of the ith farm, is a
vector of quantities of inputs employed by the ith farm to
produce , is a vector of unknown parameters to be
estimated, is an error term composed of two components,
= − (2)
Where, is the stochastic term and is the inefficiency
term. is assumed to be a two-sided (-∞<0>∞) independent and identically distributed (iid) random error having a normal
distribution with zero mean and variance , i.e. 0, .
Thus, accounts for measurement errors, stochastic effects
that are beyond the farmers’ control (such as climate change, weather, pest, luck, etc.), and other statistical noise and is
symmetrical. is assumed to be independent of , which is a
non-negative random error ≥ 0, ф , assumed to account
for technical inefficiency. Following [33], the farm specific technical efficiency which is a ratio of the observed output to the maximum possible output can therefore be specified as
= exp − (3)
= ! = 1,2, … , (4)
Such that, 0 ≤ ≤ 1
With following Battese and Coelli (1995) given as
= &'+ & ) + * (5)
Where &'is the intercept, &is a vector of parameters to be
estimated, ) is a vector of explanatory variables that may
influence the technical (in)efficiency of farm !, * are
unobservable random variables assumed to be iid with zero
mean and unknown variance, such that is non-negative
(i.e. * ≥ & )). Conventionally, can take the form of a
truncated normal, exponential, half-normal distribution, or a gamma distribution. This study utilized the truncated normal distribution which has a mode greater than zero, for with such a distribution, the proportion of farms operating at full efficiency in the sample can vary, and which has been employed in studies on efficiency in both the developed and the developing world [12, 16, 23, 34].
2.3. Data Collection
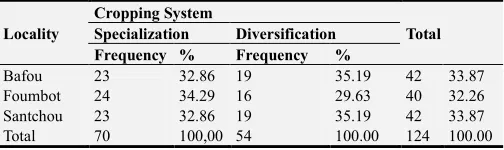
Purposive and random sampling techniques were employed using a multi-stage sampling procedure. The West region was purposively selected based on the agro-ecological and vegetable farming features. Next, the Menoua and Noun divisions were purposively selected on the basis of high concentration of market gardening production zones. Three localities: Bafou and Santcho in the Menoua division, and Foumbot in the Noun division were then purposively selected. The fourth stage involved the purposive selection of tomato, irish potato, watermelon, cabbage, carrot, pepper and leeks based on high production. Lastly, on the basis of willingness to participate in the study and the type of cropping system carried out, 124 farmers were randomly selected from the more than 1000 vegetable farmers found in the three localities. The distribution of the farmers interviewed according to locality and cropping system practiced is presented in Table 1.
Table 1. Distribution of respondents according to locality and cropping system.
Locality
Cropping System
Total Specialization Diversification
Frequency % Frequency %
Bafou 23 32.86 19 35.19 42 33.87 Foumbot 24 34.29 16 29.63 40 32.26 Santchou 23 32.86 19 35.19 42 33.87 Total 70 100,00 54 100.00 124 100.00
2.4. Analytical Framework
The stochastic production frontier model proposed by [35] with a Cobb-Douglas function specification denotes the technology of the production process. The empirical model is defined as
+, = '+ -+, -+ +, + .+, .+ /+, /+ 0+, 0+ 1+, 1+ − (6)
Where ' and -− 1 are technological parameters to be
estimated.
= value of the quantity of vegetables produced in FCFA (Franc de la Communauté Financière l’Afrique),
-= farm size in m
2 ,
= labor in man-days,
.= quantity of seeds planted in FCFA,
/= quantity of manure used in bags,
0 = quantity of chemical fertilizer used in bags, and
insecticides and fungicides) used in FCFA, and and are as defined above.
All vegetables produced in sample farms were aggregated into output value (in FCFA), which is the dependent variable, calculated as gross production multiplied by the output price. Where gross production equals Sales + farm use (i.e. farm house consumption/given out as gift) + pre-harvest losses + post-harvest losses. Output prices were gotten from
individual farms. In many studies, the quantity produced is used, but due to lack of consistency in measurement, this study decides to employ the use of the value which was easier to achieve rather than the quantity. In addition, the value approach has been adopted in a range of studies [16, 20, 23, 24, 34].
Following [35], the inefficiency effects model given by the mean of is defined as
2 = &'+ &-)-+ & ) + &.).+ &/)/+ &0)0+ &1)1+ &3)3+ &4)4+ &5)5+ &-')-'+ &--)--+ &- )- + * (7)
where &', &, * are unobservable random variables and )- is
the farm size under vegetable cultivation in 6 , ) is the age
of the farmer, ). is the gender of the farmer, )/ is the
educational level of the farmer, )0 farming experience of the
farm operator in vegetable cultivation, )1 is household size,
)3 land fragmentation, )4 is irrigation, )5 is access to
agricultural extension, 7-' access to credit, )--is membership
to a mutual aid group, )- is the cropping system.
The variables included in the stochastic frontier model are variables that have been commonly employed in similar
studies in both the developed and developing worlds [8, 9, 18, 20, 23, 34, 35, 36, 38].
3. Results and Discussions
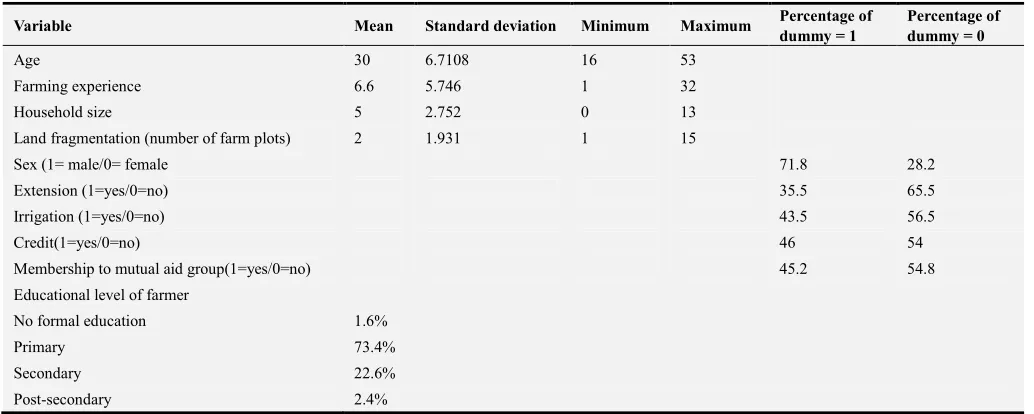
3.1. Socio-economic Characteristics of Respondents
The socio-economic characteristics of the respondents are presented in Table 2.
Table 2. Summary of the socio-economic characteristics of respondents.
Variable Mean Standard deviation Minimum Maximum Percentage of dummy = 1
Percentage of dummy = 0
Age 30 6.7108 16 53
Farming experience 6.6 5.746 1 32
Household size 5 2.752 0 13
Land fragmentation (number of farm plots) 2 1.931 1 15
Sex (1= male/0= female 71.8 28.2
Extension (1=yes/0=no) 35.5 65.5
Irrigation (1=yes/0=no) 43.5 56.5
Credit(1=yes/0=no) 46 54
Membership to mutual aid group(1=yes/0=no) 45.2 54.8
Educational level of farmer
No formal education 1.6%
Primary 73.4%
Secondary 22.6%
Post-secondary 2.4%
The majority (71.8%) of vegetable farms are male headed. This can be attributed to the labor-intensive nature of vegetable production which could possibly scare women from venturing into the activity. Findings are in line with results obtained by [23]. The average age of the surveyed vegetable farmers is found to be 30 years. These results indicate that vegetable production is an activity mostly carried out by the youths who are the active segment of the population. Similar results were obtained by [5]. Results also show that a majority (73.4%) of the surveyed vegetable farmers had obtained at least a primary education, while 22.6% and 2.4% had attained secondary and post-secondary education respectively. These results suggest that vegetable production is a part time activity for the educated. The maximum farming experience is found to be 32 years implying that vegetable cultivation has long since been practiced in the study area. This finding confirms the
observations of [7, 26] that during the 80s, the fall in coffee prices led to most farmers in the West region specializing in vegetable production. Another outcome of the study is that a majority (65.5%) of the vegetable farmers surveyed do not have access to agricultural extension services. Access to agricultural extension services in the study area is usually through farmer visit to extension agent and not the other way round. Irrigation was practiced by only 43.5% of the respondents. The favorable climate might be one of the driving forces that favor rain fed cultivation of vegetables, in addition to the fact that dry season vegetable cultivation is carried out in swamps and marshes.
3.2. Production Analysis for Vegetable Farms
Table 3. Descriptive statistics of vegetable farms based on endogenous and exogenous variables.
Variable Specialized farms (N= 70) Mean Diversified farms (N= 54) Mean Pooled Data Mean
Vegetable output (FCFA) 319505 211500 27247
Land (m2) 1158.5 794 1000
Labor (man-days) 30 28 29
Seed (FCFA) 52081 28985 42023
Manure (bags) 29.4 22 26
Fertilizer (bags) 3 2 2.5
Chemicals(FCFA) 23036 18661 21131
Results of the study revealed the mean land size for
vegetable production to be 1000m2. This implies that
surveyed farmers are mostly smallholders. The mean farm size of sampled specialized farms was however found to be
about 1,158m2 which is slightly larger than diversified farms
(794m2) indicating that land availability is a determinant
factor of strategy choice. The findings of the study also revealed that the mean labor required for vegetable production is 29 man-days. This implies that vegetable cultivation is labor intensive. Labor is required for land clearing, beds preparation, nursery preparation, weeding, fertilizer application, chemical spraying, irrigation, and harvesting. The mean labor of 30 and 28 man-days for surveyed specialized and diversified farms respectively indicate that the amount of labor applied on a vegetable farm is irrespective of cropping system. This might also hold true for fertilizer. On the basis of results obtained it might not be wrong to conclude that vegetable production is dependent on the amount of inputs (land, labor, capital) utilized.
3.3. Estimates of the Parameters of the Stochastic Production Function
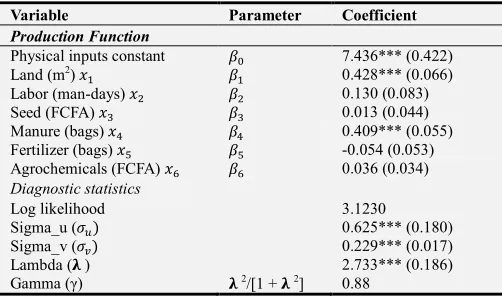
Maximum likelihood estimates of the parameters of the stochastic frontier model are presented in Table 4.
Table 4. Estimated parameters of the stochastic production function.
Variable Parameter Coefficient
Production Function
Physical inputs constant ' 7.436*** (0.422) Land (m2)
- - 0.428*** (0.066)
Labor (man-days) 0.130 (0.083)
Seed (FCFA) . . 0.013 (0.044)
Manure (bags) / / 0.409*** (0.055) Fertilizer (bags) 0 0 -0.054 (0.053) Agrochemicals (FCFA) 1 1 0.036 (0.034) Diagnostic statistics
Log likelihood 3.1230
Sigma_u ( 0.625*** (0.180)
Sigma_v ( 0.229*** (0.017)
Lambda (8 ) 2.733*** (0.186)
Gamma (γ) 8 2/[1 + 8 2] 0.88
Values in parentheses are standard errors. All values have been approximated to three decimal places. *, ** and *** represent statistical significance at the 1%, 5% and 10% levels respectively.
Estimates of the parameters of the stochastic frontier production model revealed that all the estimated coefficients of the variables of the production function, with the exception of fertilizer, were positive. The negative coefficient of fertilizer indicates an over (or abusive) use of this variable
in vegetable cultivation. This is due to the declining fertility of the ferrasols which dominate the area [7]. These results are consistent with results obtained by [1, 40] who reported a negative correlation between fertilizer and potato output in Hhohho (Swaziland), and tomato in Nigeria respectively. Land and manure are the only variables found to be significantly impact vegetable production at p < 0.01.
Therefore, a 1% increase in m2 of land will increase
vegetable output by 0.43%, while a 1% increase in the number of bags of manure will increase vegetable output by 0.40%.
The estimated λ (2.733) exceeds one and is significantly different from zero at the 1% level implying the goodness of the fit of the model. The estimated gamma (γ) value of 0.88 indicates that 88% of the total variation of vegetable output is due to technical inefficiency and not measurement errors or climate variability.
3.4. Estimates of the Magnitude of Technical Efficiencies of Surveyed Diversified and Specialized Farmers
The farm-specific technical efficiency scores obtained from the estimated stochastic frontier are presented in Table 5.
Table 5. Distribution of technical efficiency scores of sampled vegetable farmers.
Efficiency score Specialized farmers (%)
Diversified farmers (%)
Pooled data (%)
< 0.50 1.4 1.9 1.6
0.51-0.60 1.4 0.0 0.8
0.61-0.70 4.3 9.2 6.5
0.71-0.80 8.6 3.7 6.5
0.81-0.90 32.9 50.0 40.3
0.91-1.0 51.4 35.2 44.3
Total 100 100 100
Mean 0.867 0.858 0.863
Minimum 0.028 0.102 0.028
Maximum 0.977 0.953 0.977
The results of the MLE reveal that surveyed vegetable farmers in the study area exhibit a small degree of technical inefficiency. The modal efficiency score group, for instance, is 0.91-1.0 which accounts for 44.3% of the total surveyed vegetable farms; this is closely followed by 0.81-0.90 which accounts for 40.3%. In fact, less than 20% (15.4%) of the surveyed farmers have efficiency scores less than 0.81.
some farmers. The estimated mean TE of approximately 86% implies that there is a possibility to increase vegetable production in the study area by 14% without reducing inputs. Estimated TE scores also indicate that if an average farmer in the sample were to achieve the TE of his most efficient counterpart, then the average farmer could realize an 11.7% (1-(0.863/0.977) cost saving or increase in output. Similarly, calculations for the most technically inefficient farmer reveal an increase in output of 97.2%.
The estimated TE scores of interviewed specialized farmers is found to range from 0.028 to 0.977 with a mean of 0.867, while those of surveyed diversified farmers ranged from 0.102 to 0.953 with a mean of 0.858 for the diversified farmers. This result implies that surveyed vegetable farmers who specialize are slightly more technically efficient than their counterparts who diversify. However, results of a standard t-test for independent samples (two-sample independent t-test) as presented in Table 6 indicate that there is no significant difference in the mean TE indices of specialized and diversified vegetable farmers in the west region of Cameroon.
Table 6. Two-Sample t-test for difference in mean in technical efficiency indices of specialized and diversified vegetable farms.
Null Hypothesis Pr(T>t) t- statistics Conclusion H02:µ1=µ2 0.6756 1.54 Accept HO2
This implies that TE indices are independent of the cropping practices in the humid and forest zone in Cameroon. Similar results were obtained by [18] on the TEs of
groundnut and maize intercrops in Cameroon. Results are however, in contrast with the findings of [11] who reported that specialization impacts negatively on productivity of smallholder farmers in Papua New Guinea. [1, 11,12, 16, 25, 28] also reported in the same line. Their findings revealed that diversification impacts positively on the TEs of vegetable-based cropping systems in South Africa, tomato production in Oyo (Nigeria), small-scale dry season vegetable farmers in Sokoto (Nigeria), peasant farmers in Nigeria, and multiple crop farmers in Vietnam respectively. [14, 15] on their part, however, reported a negative correlation between crop diversification and production efficiency among perishable crop farmers in Cameroon, and vegetable farmers in Benin respectively.
3.5. Sources of Technical Inefficiency
Even though the assessment of the degree of technical efficiency is important, it is not totally dependable. In order to make recommendations for economic policies, it is necessary to identify the sources of variation in technical efficiency between farmers. It is against this background that the inefficiency effects model was estimated following the one-step approach.
The one-sided generalized likelihood ratio (LR) test was first of all performed to check if the explanatory variables in the technical inefficiency effects model are simultaneously
equal to zero, i.e. H0: &-= & … &- = 0 was tested. Results
of the LR test are presented in Table 7.
Table 7. Test for the sources of technical inefficiency.
Null hypothesis Ln(likelihood function) Test statistics Degrees of freedom Critical value Decision
H0: δ1=δ2=...=δ12=0 -24.10254 54.45 12 20.41 Reject H0
Critical value of the test is obtained from Kodde and Palm (1986: 1246, Table 1) at the q+1 degrees of freedom and at the 5% level of confidence
.
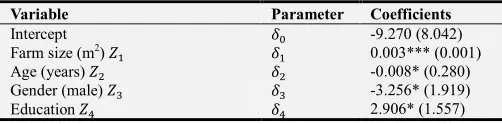
Results indicate that these variables jointly explain inefficiency differences among the sampled farmers even though some of them are not statistically different from zero. The parameter estimates (table 8) showed that age, male gender, access to extension services, farm size, education, access to credit, and membership to mutual aid group are the major factors that significantly affect the technical inefficiency of vegetable farmers in the study area. Age, male gender, and access to extension services reduce technical inefficiency (determinants of technical efficiency) whereas, farm size, education, access to credit and membership to mutual aid group enhance it (sources of technical inefficiency). A negative coefficient value indicates negative
correlation with technical inefficiency but positive
correlation with technical efficiency.
Table 8. Estimates of the technical inefficiency effects model.
Variable Parameter Coefficients
Intercept &' -9.270 (8.042)
Farm size (m2) )
- &- 0.003*** (0.001)
Age (years) ) & -0.008* (0.280)
Gender (male) ). &. -3.256* (1.919) Education )/ &/ 2.906* (1.557)
Variable Parameter Coefficients
Farming experience (years) )0 &0 -0.245 (0.282) Household size )1 &1 0.424 (0.626) Land fragmentation )3 &3 -1.214 (1.193) Access to irrigation )4 &4 -6.390 (4.312) Access to extension )5 &5 -6.384** (2.480) Access to credit )-' &-' 3.256*** (1.315) Membership to mutual aid group )-- &-- 4.365** (1.877) Specialization )- &- -0.392 (1.283)
Values in parentheses are standard errors. All values have been approximated to three decimal places. *, ** and *** represent statistical significance at the 1%, 5% and 10% levels respectively.
Results of this study also revealed a negative significant relationship between age and technical inefficiency. This negative correlation infers that as the age increases, the technical inefficiency decreases. An implication of this is that surveyed older farmers are technically more efficient than their younger counterparts. This can be attributed to the fact that the knowledge, skills, as well as the physical capability of the farmer is likely to increase as age increases. This finding confirmed the results of [34 36, 43, 44]. It is however, contrary to the results obtained by [8, 9, 11, 23, 37, 42].
The results obtained by the MLE revealed a negative and significant correlation between the male gender and technical inefficiency indicating that male vegetable farmers are more technically efficient their female counterparts. A possible explanation could be attributed to the fact that vegetable production is labor-intensive as observed by [23] consequently time consuming hence leading to the decline in the efficiency of women who have other domestic activities to cater for. This observation conforms to the findings of [1, 9, 44]. [12, 23] however, found female vegetable farmers to be more technically efficient than their male counters in Turkey and Nigeria respectively.
Farm size however, showed a positive and significant relationship with technical inefficiency. This implies that as the farm size increases, the technical inefficiency increases. This therefore, suggests that smaller farms are more technically efficient than larger farms. This can be justified by the fact that increase in farm size reduces the timeliness of input use consequently leading to a decline in technical efficiency. These results are consistent with the findings of [45] who reported that small-scale wheat farmers in Kenya are slightly more technically efficient than their large-scale counterparts. Similar results were also reported by [43, 39]. [36, 19] however, obtained an inverse relationship between land size and technical inefficiency of small-scale farmers in the Dominican Republic, and agricultural farms in Bangladesh respectively.
Access to agricultural credit showed an unexpected significant positive sign on technical inefficiency. This implies that the surveyed vegetable farmers that had access to agricultural credits are technically less efficient than their counterparts who did not have access to agricultural credit. A plausible explanation for this could be due to inappropriate utilization of credit. Similar results were obtained by [42]) for specialized livestock farmers in Chile. Nonetheless, credit has been seen to have varied impacts on technical efficiency. [40] for instance, revealed that access to credit had negative impact on the technical efficiency of cabbage and tomato production but impacts positively on green pepper and beetroot production in Swaziland. The findings of [9, 20, 23, 38, 41, 45] are contrary to the findings of the study.
Membership to a mutual aid group was found to have a positive correlation with technical inefficiency. This suggests that vegetable farmers that belong to a mutual aid group are technically more inefficient than their counterparts who do not belong to a mutual aid group. The positive and significant
coefficient of membership to a mutual aid group therefore, did not support the hypothesis that farmers who belong to a mutual aid group were more efficient. [20] in his study of the TE of coffee farmers in Cameroon also obtain a positive but non-significant relationship between membership to a mutual aid group and technical inefficiency. The findings of this study are however, contrary to findings of some studies like [18, 34, 41, 43] who found a negative and significant relationship between membership to a mutual aid group and technical inefficiencies.
In this study’s model education is found to have a positive and significant relationship with technical inefficiency. This indicates that as the educational level of surveyed farmers’ increases, their TE decreases. An implication of this is that the less educated farmers are technically more efficient than the more educated farmers. A possible explanation could be that most educated farmers are involved in part time vegetable farming. Because of their educational level they have permanent jobs hence, high opportunity cost of time on vegetable farms. [43] also found education to increase technically inefficiency of groundnut/maize intercrop farmers in Cameroon though not significantly. Results of this study are similar to findings of [16] in KwaZulu Natal but contrary to the results of [18] in Cameroon, [23]) in Turkey, [20]) in Cameroon, [38] in Nigeria, [34] in Ethiopia, [45] in Kenya, [41] in Kenya, and [12] in Nigeria.
With the exception of the abovementioned seven variables, the experience in vegetable farming, household size, land fragmentation, access to irrigation, and cropping pattern are significantly different from zero even at the 10% level of confidence as indicated in Table 8. This means that any in change (increase or decrease) in the size of these variables will have no significant change on vegetable output. However, the coefficient signs might guide policy formulation.
4. Conclusion
efficiency are age, gender and access to agricultural extension services. The main sources of technical inefficiency are revealed to be farm size, education, access to credit, and membership to a mutual aid group. The study therefore, recommends that agricultural extension be intensified in the region with greater focus on vegetable farmers who have access to credit and those that belong to mutual aid groups.
References
[1] Ogunniyi, L. T., and Oladejo, J. A. (2011). Technical Efficiency of Tomato Production in Oyo State, Nigeria.
Agricultural Science research Journal; Vol 1; No 8, 84-91. [2] FAO (2011) Food and Agriculture Organization of the United
nations, Rome, Italy, 2007. http://www.fao.org. Retrieved from the internet on 16/04/2015
[3] Gockowski, J., and Ndoumbe, M. (2004). The Adoption of Intensive Mono-crop Horticulture in Southern Cameroon.
Agricultural Economics; Vol 30, 195-202.
[4] Countrystat (2015) http://www.countrystat-cameroon.org. Retrieved from the internet on 16/04/2015
[5] Temgoua, E., Ntangmo, T. N., Njine, T., and Serve, M.-A. (2012). Vegetable Production Systems of Swamp Zone in Urban Environment in West Cameroon: Case of Dschang City.
Universal Journal of Environmental Research and technology; Vol 2; issue 2, 83-92.
[6] Berinyuy, J. E., and Fontem, D. A. (2011). Evaluating post harvest opportunities and constraints to utilization and marketing of African leafy vegetables in Cameroon. African Journal of Food, Agriculture, Nutrition and Development, Vol. 11, No.2, 4647-4663.
[7] Ijang, P. T., Ngome, F., Ntsefong, N., and Wirngo, J. N. (2013).
Consultancy Report on Vegetable Seeds: Baseline Survey for Setting up Smallholders Sustainable Vegetable Seed Supply and Distribution System in HUmid Tropics Areas of Cameroon.
Intergrated Agricultural Systems for the Humidtropics; a CGIAR Research Project; AVRDC Cameroon.
[8] Aminu, F. O., Ayinde, I. A., and Ambali, O. (2013). Effect of Ill Health on Technical Efficiency of dry season Vegetable Farmers in Oyo Local Government Area of Lagos State, Nigeria. World Journal of Agricultural Research; Vol 1; No 6, 108-113.
[9] Amoah, S. T., Akobour, I. D., and Abubakari, R. (2014). Technical Efficiency of Vegetable Farmers in Peri-Urban Ghana: Influence and Effects of Resource Inequalities. America Journal of Agriculture and Forestry; Vol2; No 3, 79-87. [10] Etim, N.-A. A., and Udoh, E. J. (2014). Identifying Sources of
Efficiency among Resource Poor Indigenous Vegetable Farmers in Uyo, Nigeria. International Journal of Food and Agricultural Economics; Vol 2; No 1, 33-39.
[11] Coelli, T., and Fleming, E. (2003). Diversification Economies and Specialisation Efficiencies in a Mixed Food and Coffee Smallholder farming Systems in Papua New Guinea. 25th International Conference of Agricultural Economists; 16-22 August. Durban; South Africa: Event Dynamics.
[12] Ogundari, K. (2013). Crop Diversification and Technical Efficiency in Food Crop Production: A Study of Peasant Farmers in Nigeria. International Journal of Social Economics; Vol 40; No 3, 84-91.
[13] Mesfin, W., Fufa, B., and Haji, J. (2011). Pattern, Trend and Determinants of Crop Diversification: Empirical Evidence from Smallholders in Eastern Ethiopia. Iournal of Economics and Sustainable Development, 78-90.
[14] Nzie, J. R., and Nonga, F. N. (2012). Is Diversification an Efficient or Safe Strategy? The Case of Perishable Food Crop Production Systems in Cameroon. International Journal of Business and Management; Vol 17; No 14, 124-134.
[15] Singbo, A. G., Emvalomatis, G., and Lansink, A. O. (2013, August 4-6). Assessing the Impact of Crop Specialisation on Farms Performance in Vegetable Farming in Benin: A Non-Neutral Stochastic Frontier Approach. Selected paper for presentation on the Agricultuiral and Applied Economics Association 2013 AAEA and CAES Joint Annual meeting. Washington.
[16] Mkhabela, T. (2005). Technical Efficiency in a Vegetable Based Mixed-Cropping Sector in Tugela Ferry, Msinga District, Kwazulu-Natal, Agrekon; Vol 44; No 2. 187. [17] Anandalingram, G., and Kulatikala, N. (1987). Decomposing
Production Efficiency into Technical, Allocative and Structural Components. Journal of the Royal Statistical Society; Series A (General); Vol 150; Issue 2, 143-157. [18] Binam, J. N., Tonye, J., and Wandji, N. (2005). Sources of
Technical Efficiency among Smallholder Maize and Peanut Farmers in the Slash and Burn Agriculture Zone in Cameroon.
Journal of Economic Cooperation; Vol 26; No1, 193-210. [19] Haider, M. Z., Ahmed, M. S., and Malick, A. (2011).
Technical Efficiency of Agricultural Farms in Kulna, Bangladesh: Stochastic Frontier Approach. International Journal of Economics and Finance; Vol 3; No 3, 248-256. [20] Nchare, A. (2007). Analysis of Factors Affecting the Technical
Efficiency of arabica Coffee Producers in Cameroon. AERC Research Paper 163. Nairobi, Kenya: African Economic research Consortium.
[21] Ogundari, K. (2009). A Meta-Analysis of Technical efficiency in Nigerian Agriculture. Contributed paper prepared for presentation at the International Association of Agricultural Economists Conference. Beijing, China.
[22] Thiam, A., Bravo-Ureta, B. E., and Rivas, T. E. (2001). Technical Efficiency in Developing Country Agriculture: A Meta-Analysis. Agricultural Economics; Vol 25, 235-243. [23] Bozoglu, M., and Ceyhan, V. (2007). Measuring the Technical
Efficiency and Exploring the Inefficiency Determinants of Vegetable Farms in Samsun Province, Turkey. Agricultural Systems; No 94, 649-659.
[24] Tsobo, B. A., Omotesho, O. A., Salau, S. A., and Adewumi, M. O. (2012). Determinants of Technical, Allocative and Economic Efficiency among Dry Season Vegetable Farmers in Sokoto State, Nigeria. J. Agri. Sci.; Vol 3; No 2, 113-119. [25] Okolle, J. N., Ijiang, P. T., and Ngome, F. A. (2014).
[26] Neba, A. (1999). Modern Geography of Cameroon; 3rd ed.Bamenda: Neba Publishers.
[27] Alam, A., Kobayashi, H., Matsuda, T., Ishida, A., Matsumura, I., and Esham, M. (2012). Stochastic Frontier Approach to Measure Technical Efficiency of two Irrigation Systems in Gigit District, Gilgit-Baltisan Region, Pakistan. Journal of Food, Agriculture and Environment; Vol10; No 1, 543-550. [28] Nguyen, H. (2014). Crop Diversification, Economic
Performance and Household's Behaviuor: Evidence from Vietnam. MPRA Paper No 59168.
[29] Mastromarco, C. (2008). Stochastic Frontier Models.Cambridge: Cambridge University Press
[30] Taylor, T. G., and Shonkwiler, J. S. (1986). Alternative Stochastic Specifications of the Frontier Production Function in the Analysis of Agricultural Credit programs and Technical Efficiency. Journal of Development Economics; Vol 21, 149-160.
[31] Ahmad, M., and Bravo-Ureta, B. (1996). Technical Efficiency Measurement for Diary Farms Using Panel Data: A Comparison of Alternative Model Specifications. J. Prod. Anal; Vol 7, 399-416.
[32] Kopp, R. J., and Smith, V. K. (1980). Frontier Production Function Estimates for Steam Electric Generation: A Comparative Analysis. Southern Econometrics Journal; Vol 47, 1049-1059.
[33] Battese, G. E. (1992). Frontier Production Functions and Technical Efficiency: A Survey of Empirical Applications in Agricultural Economics. Agricultural Economics; Vol 7, 185-208.
[34] Asefa, S. (2011). Analysis of Technical efficiency of Crop Producing Smallholder Farmers in Tigray, Ethiopia. MPRA paper; No 40461.
[35] Aigner, D. J., Lovell, A. K., and Schmidt, P. (1977). Formation and Estimation of Stochastic Frontier Production Function Models. Journal of Econometrics; Vol 6, 21-37. [36] Bravo-Ureta, B. E., and Pinheiro, A. E. (1997). Technical,
Economic and allocative Efficieciency: Evidence from the Dominican Republic. The Developing Economics; XXXV-I, 48-67.
[37] Battese, G. E., and Coelli, T. (1995). A Model of Technical Inefficiency Effects on Stochastic Frontier Production for Panel Data. Empirical Economics; Vol 20, 325-345.
[38] Ajewole, O. C., and Folayan, A, J. (2008). Stochastic Frontier Analysis of the Technical Efficiency of Dry Season Leaf Vegetable Production among Smallholders in Ekiti State, Nigeria. Agricultural Journal; Vol 3; No 4, 252-257.
[39] Haji, J. (2006). Production Efficiency of Smallholders' Vegetable-Dominated Mixed Farming System in Eastern Ethiopia: A Non-Parametric Approach. Joiurnal of African Economics; Vol16; No 1, 1-27.
[40] Malinga, N. G., Masuku, M. B., and Raufu, M. O. (2015). Comparative Analysis of Technical Efficiencies of Smallholder Vegetable Farms with or Without Credit Access in Sawaziland and the Cae of the Hhohho Region.
International Journal of Sustainable Agricultural Research; Vol 2; No 4, 133-145.
[41] Nyagaka, D. O., Obare, G. A., Omiti, J. M., and W, N. (2010). Technical Efficiency in resource Use: Evidence from Smallholder Irish Potato Farmers in Nyandarua North District, Kenya. African Journal of Agricultural Research; Vol 5; No 11, 1179-1186.
[42] Saldias, R., and von Cramon-Taubadel, S. (2012). Access to credit and the determinants of technical Inefficiency Among Small Farmers in Chile.Gottingen: Universitat Gottingen. [43] Kane, G. Q., Fondo, S., and Oyekale, S. A. (2012). Efficiency
of Groundnut/Maize Intercropped farms in Zoetele, South Cameroon: A Data Envelopment Approach. Life Science Journal; Vol. 9; No. 4, 3955-3962.
[44] Abatania, L. N., Hailu, A., and Mugera, A. W. (2012, February 7-10). Analysis of Farm Household Technical Efficiency in Northern Ghana using Bootstrap DEA. Paper presented at the 56th annual conference of the Australian Agricultural and Resource Economics Society. Fremantle, WA.
[45] Njeru, J. (2010). Factors influencing technical efficiencies among selected wheat farmers in Uasin Gishu District, Kenya.