http://www.sciencepublishinggroup.com/j/ijeee doi: 10.11648/j.ijeee.20170202.11
Perspective Performance Evaluation Technique for a
Cascade Heat Pump Plant Functions at Low Temperature
Heat Source
Ali H. Tarrad
Mechatronic Engineering Department, University of Southern Denmark, Sønderborg, Denmark
Email address:
To cite this article:
Ali H. Tarrad. Perspective Performance Evaluation Technique for a Cascade Heat Pump Plant Functions at Low Temperature Heat Source.
International Journal of Economy, Energy and Environment. Vol. 2, No. 2, 2017, pp. 13-24. doi: 10.11648/j.ijeee.20170202.11
Received: April 28, 2017; Accepted: May 17, 2017; Published: June 5, 2017
Abstract: The present investigation deals with the performance assessment of Cascade heat pump plants. The overall power
consumption for a Cascade system for typical heat pump characteristics was studied. Four environment friendly refrigerant pairs R717/R134a, R410A/R134a, R407C/R134a, and R717/R600a were investigated at low temperature cycle (LT) evaporator and high temperature cycle (HT) condenser temperatures of (-15 to -4)°C and (70)°C respectively. A preliminary heat pump plant is suggested to produce (500) kW heat output load as hot water demand at (65)°C with (25)°C temperature lift and a proper circulation rate. The investigation was carried out at cascade heat exchanger intermediate temperature (IT) of (33)°C and (35)°C. Sea water at (7)°C was used as a sustainable low temperature heat source and (30%) ethylene glycol-water brine at temperature of (5)°C as a thermal fluid heat carrier at the LT cycle evaporator. The evaluation of the thermal performance of the refrigerant pairs was based on a fixed heat pump extraction load at the LT cycle. The heat pump heating coefficient of performance (COP) revealed an increase fell within the range of (5-7.5)% higher than that of the plant heating COP value for the studied refrigerant pairs at the whole investigated operating conditions range. The higher IT exhibited the highest heat pump and plant heating COP than those at the lower value. R717/R600a showed the highest heating COP, lower power consumption and lower global warming potential (GWP) among other investigated refrigerant pairs. The power consumed by auxiliary pumps to circulate thermal fluid heat carriers through a heat pump may account to (4-4.5)% and (2-3)% of the extracted and output heating loads respectively, higher values could be expected for real plant. Two polynomial correlations for the assessment of the pumping power in terms of the extracted and output heating loads were derived from the present work.Keywords: Renewable Energy, Clean Environment, Low Temperature Heat Source, Plant Assessment
1. Introduction
The Cascade heat pump has been implemented for decades in the heat conveying technology from a low to high temperature levels. Enormous number of researches has been conducted to focus on the improvement of the COP of the Cascade heat pump by some modifications or techniques implemented to the heat pump cycle. Ejectors were used ejectors as a part of the heat pump unit arrangement circulating R134a and R404a refrigerants [1]. The numerical analysis showed that applying ejectors to both the high and low temperature cycles increase the COP by (26.9%) when compared to standard cascade cycles. The heating COP of the cascade refrigeration system increases when the mass flow rate of higher temperature circuit increases in the test range
as concluded by [2].
Reference [5] investigated the optimal IT for R134a/R410A refrigerant pair in a Cascade heat pump. A low temperature heat source cascade system was developed by [6] which used the sea water at (10)°C to provide hot water in Alaska. The effect of the water temperature lift on the performance of Cascade heat pump water heater was investigated in [7]. A ground source Cascade heat pump performance was investigated by reference [8] when it circulates R134a/R407C refrigerant pair. The optimum condensing temperature of the (LT) cycle fell within the range of (35–37)°C, when the evaporating temperature of R407C and condensing temperature of R134a are at (-5)°C and (65)°C respectively. Reference [9] compared the performance of combined R744/R134a and Cascade R744/ R134a systems for space heating under specific operating conditions. They concluded that cascade system performed better at low ambient temperatures. The combined system exhibited better performance characteristics under conditions of high ambient temperature and high hot water temperature driving force between the system inlet and outlet.
Reference [10] has pointed out that the higher COP for R410A/ R134a cascade system was obtained when the IT was in the range (40-41)°C. This behavior was observed at (7)°C ambient temperature regardless of the water inlet temperature to the high temperature condenser. The R717/R600a and R717/R134a revealed the highest COP and lowest power consumption at (35)°C IT and HT condensation of (70)°C as concluded by [11] and [12]. The best performance was obtained when the IT falls within a range close to (33 - 37)°C. Further, he demonstrated that different operating conditions for both systems at the high and low temperature cycles may exhibit the same coefficient of performance [12].
There was no much research work published, at least in the open literature, to investigate the effect of other electrical power consumption components than compressors on the COP of a heat pump. The majority of the research work has
focused on the assessment of heat pump heating coefficient of performance, compressors power consumption and refrigerant alternatives selection. These studies have ignored the power consumed by pumps and other auxiliaries required to run the Cascade heat pump unit. The present study considered pumps power consumption in a preliminary design of a Cascade unit plant to produce hot water at (65)°C. In this context, the power consumed to run the (3) pumps to deliver sea water, brine and hot water through the heat pump will be taken into a count for the plant COP assessment. The Cascade heat pump is analyzed by different environment friendly refrigerants to optimize the performance and find out the optimum operating conditions for the plant.
2. Case Study
A preliminary thermal design for a Cascade heat pump plant, performance evaluation and best circulated refrigerant pairs will be outlined to produce approximately (500) kW output load for hot water demand. This requires a load of (305) kW to be extracted from the Ethylene Glycol/Water solution at the (LT) evaporator. The sea water is considered as the low temperature heat source used to heat up the brine in a separate heat exchanger prior to the heat pump system.
2.1. Refrigerant Pairs
Table 1 shows a list for some physical properties of the selected refrigerants in this study, all composition values are by a weight percentage. In reality all the selected refrigerants except the R407C behave as pure fluids from the point of view of thermal and heat transfer characteristics. Although R410A contains two refrigerants, it still behaves as a pure refrigerant with a negligible temperature glide of (˂0.2)°C as shown in Table 1.
Table 1. Selected physical properties of the analyzed refrigerants.
Property R-407C R-410A R717 R134a R600a
Composition and Refrigerant (Formula) R32/125/134a (23/25/52)% R32/R125 (50/50)% NH3 (100)% CF3CH2F (100)% C4H10 (100)% Molecular Weight (kg/kmol) 86.2 72.58 17.03 102.03 58.12 Normal Boiling Point (°C) -43.4 -51.58 -33.3 -26.06 -11.7
Temperature Glide (°C) 7.4 ˂0.2 0 0 0
Critical Pressure (MPa) 4.62 4.926 11.3 4.0603 3.64 Critical Temperature (°C) 86.2 72.13 132.4 101.08 135 Ozone Depletion Potential (ODP) 0 0 0 0.005 0 Global Warming Potential (GWP) 1600 1725 0 1430 about 20
2.2. Operating Conditions
The previous work conducted by [4] and [10-12] was recalled for the present assessment where the best operating conditions and performance were attained. Hence, the following conditions were considered for the purpose of this study:
1.Cascade heat pump with useful superheat degree in evaporators of (3-6)°C and subcool degree of (2)°C in
condensers for both cycles.
2.Superheat degrees in piping system were (3)°C and (1)°C for the LT and HT cycles respectively.
3.The (HT) evaporation and condensation were set at (26 and 30)°C and (70)°C respectively with (LT) condenser at (40)°C.
4.The intermediate temperatures at the cascade heat exchanger were at (33)°C and (35)°C.
6.The compressors are operating at (70%) and (80%) isentropic and volumetric efficiencies respectively with (10%) heat loss.
7.Pumps efficiencies were considered as (60%) for shaft power consumption estimation.
8.Fixed heat load input of (305) kW from the sustainable heat source, sea water, at entering temperature of (5)°C for (30%) ethylene glycol –water mixture to the LT evaporator.
9.This extracted load produces output load approximately (471-544) kW for the whole range of operating conditions at compressors isentropic efficiency of (70%).
2.3. Cascade System
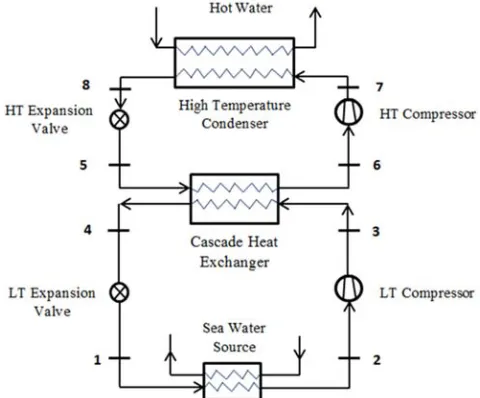
A standard Cascade heat pump technology is to be considered for the assessment. It is composed of two separate cycles and coupled through the cascade heat exchanger as shown in Figure 1.
Figure 1. A schematic diagram for a Cascade system.
A schematic p-h diagram of this cycle is illustrated in Figure 2 for a typical Cascade heat pump system.
Figure 2. A schematic p-h diagram for a Cascade system.
3. Thermodynamic Analysis
Methodology
3.1. Heat Exchangers
The circulated mass flow rate of refrigerant on the LT cycle is estimated from the rejected heating load by the brine, energy balance and adiabatic boundary condition from:
, , (1)
The cascade heat exchanger couples both cycles, it works as an evaporator for the high temperature (HT) cycle and condenser for the LT cycle. The condensation load of this heat exchanger is estimated as:
, (2)
For the HT cycle, the mass flow rate of the refrigerant circulated in this cycle is estimated from the energy balance through the cascade heat exchanger to give:
! , " #" $% & (3)
These relations represent the main concept of thermodynamic analysis for the heat pump on the refrigerant sides. More detailed analysis for these relations was derived by [12].
3.2. Power Consumption
The compressors power consumption may be calculated for individual for each of them from:
' , ()* , , (4)
'! , ()* ! , - . (5)
Hence the total power consumptions by compressors alone to run the heat pump is:
'/(/ 0, ()* ' 1 '! (6)
3.3. Coefficient of Performance (COP)
The higher the value of the heat load output at the HT condenser for a given power input is, the better thermal performance and economic feasibility will be attained. It is defined as:
234!.*6)* :;8; <,"8=7 ,"89$ (7)
This value of COP represents the heat pump coefficient of performance alone. It is always higher than the real expected COP and sometimes it is misleading. Moreover, the used evaluation criteria of the COP are overestimating the heat pump performance.
on the thermal fluid carrier side is usually low, it is still considered as a factor on the heat pump performance. Therefore, the power consumed (4 /) by the (3) pumps, which circulate sea water, brine and hot water through the heat pump will be included, hence:
4/(/ 0, (> '/(/ 0, ()*1 4 / (8)
This relation yields the following COP criterion for the plant:
234*0 >/ ?;8; <,"89#7 ,"89$ (9)
The available software code for vapor compression refrigeration cycle known as (CoolPack) presented in reference [13] is implemented for the extraction of the test refrigerants physical properties and verification objectives.
3.4. Auxiliary Heat Exchangers 3.4.1. Sea Water/Brine
Figure 3 illustrates the temperature distribution through the heat exchanger where the sea water rejects its energy to the brine. A plate heat exchanger type may be selected that possesses high area density per unit volume of the equipment. Filtration system should be installed prior to this heat exchanger on the sea water side.
Figure 3. Sea water/ethylene glycol solution heat exchanger.
Here, the ethylene glycol-water mixture is heated through a closed circuit of the sea water heat exchanger to a set value of (5)°C before it enters to the LT evaporator inlet port.
The sea water flow rate is estimated for a fixed value of temperature difference through the external heat exchanger as shown in Figure 3. The volumetric flow rate is calculated from the following expressions as:
@A : CDEF G*B ; <8 $DEF ∆ DEF 3600 (10)
The flow pressure drop due to friction may be calculated from:
∆L M N CO ; P Q
, R (11)
Where
ST U .VV NNDEFDEF W (12)
3.4.2. Brine/LT Evaporator
The brine is the thermal fluid carrier of the extracted heat, it enters the LT evaporator at (5)°C and reject the heating load of (305) kW to evaporate the LT cycle refrigerant. The freezing point of the brine should be at least (5)°C lower than the estimated mean operating temperature of the heating medium as it passes through the heat exchanger [14]. This criterion holds for the present operating condition for which the freezing point of the brine is (-13.7)°C, hence it operates at a value away from this point, Figure 4.
Figure 4. Ethylene glycol solution/low temperature cycle circulated at the low temperature evaporator.
The (30%) Ethylene Glycol/Water solution flow rate may be estimated from eq. (10) with a proper thermal properties and assumed operating conditions. The properties are taken at the mean temperature of (4)°C. It enters the sea water heat exchanger at (-2)°C and leaves at (5)°C, hence a value of (7)°C for the brine temperature difference as it passes through the heat exchanger will be considered.
3.5. High Temperature Cycle Condenser
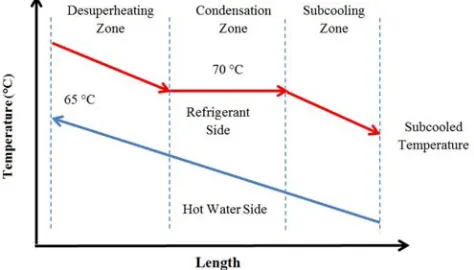
Three zones for heat transfer mechanisms occur through the condenser. Figure 5 illustrates these successive heat transfer modes referred to as desuperheating, condensation and sub-cooling mechanisms. The thermal calculation of the condenser is out of the scope of the present analysis objectives, but the total area of the condenser represents the sum of the three zones surface area required.
high condensing temperature will be set at (70)°C to provide a proper temperature driving force on the condenser side. The logarithmic mean temperature difference (LMTD) is used in the heat transfer calculation of the condenser surface area rather than the direct estimated mean temperature difference.
The hot water heating load is estimated at the (HT) condenser where adiabatic conditions were existed with the help of eq. (10). The physical properties of water are estimated at the mean bulk temperature to assess the flow rate.
Figure 5. Hot water/High temperature cycle condenser thermal variation.
3.6. Pumping Power
The hydraulic power is estimated from a head loss downstream of the flow from:
4 X 60T @0 Y0 Z [/ 3.6 10. (13)
The required value of the shaft power depends on the real efficiency of the pump as:
4 / ?B^$P _<R"` _= (14)
Where (a*6)*) represents the real pump efficiency which is a combination from the pump efficiency and electric motor efficiency. Its value is around (0.6-0.65) as a general design value to be used for the power estimation.
4. Results and Discussion
4.1. Pump Power Assessment
The flow rates and pressure drops for different fluids were estimated for the hypothetical heat pump plant at a typical heat output. Accordingly, the power consumption by pumps to circulate the thermal fluids was calculated. Table 2 shows a rough estimation for the power requirements to extract (305) kW from the sea water and pumping it to the condenser to produce approximately (500) kW heat pump output load. It should be realized that the hot water power consumption is considered only for the water that is circulating through the heat pump. It does not include the pumping power required for hot water through the piping system to the consumers.
Table 2. A preliminary assessment for pumps power consumption to produce (500) kW heat pump heating load output.
Parameter Sea Water Brine Hot Water
Heat Load, (kW) 305 305 500 Temperature Difference, (°C) 3 7 25 Specific Heat, (kJ/kg.°C) 4.002 3.726 4.2 Liquid Density, (kg/m3) 1028 1057 985.2
Flow Rate, (m3/hr) 89.1 39.9 18 Flow Velocity, (m/s) 1.9 2.3 2.3 Nominal Pipe Size ANSI Sch 40,
(in)/mm 5/128.2 3/77.93 2/52.5 Piping Length, (m) 200 50 50 Pressure Drop (Friction in pipes),
(bar) 0.54 0.36 0.55 Head Loss or Lift, (m) 10 10 10 Power (Friction Loss), (kW) 2.3 0.7 0.45 Power (Differential Head), (kW) 4.2 1.92 0.82 Total power, (kW) 6.5 2.6 1.3
The total pumping power consumed by flow circulation is about (10.5) kW for all operating fluids. For design purposes, it is used to employ a safety factor of about (20%) for power consumption by pumps to compensate the uncertainty of correlations for pressure loss estimation. Hence a minimum value of (13) kW would be expected for pumps consumed power at the postulated operating conditions. The pump efficiency was assumed to be the same for all pumps as (60%). The pressure drop should include any minor losses such as fittings, valves, heat exchangers and any instrumentation ports located in the flow direction. This is expected to raise the head losses further and increases the pumping power requirements considerably.
4.2. Thermodynamic Heat Pump Assessment
The thermodynamic analysis was carried out on four refrigerant pairs, which have been believed to achieve the best performance in agreement with previous studies conducted by [4] and [10-12]. They are R410A/R134a, R407C/R134a, R717/R134a and R717/R600a at the specified operating condition stated in this work.
4.2.1. Power Consumption
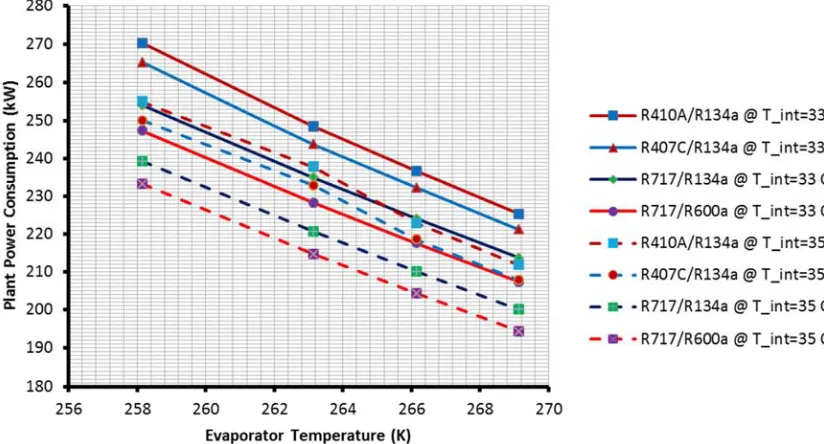
Figure 6 illustrates the compressors power consumption of the analyzed refrigerant pairs compared for both intermediate temperatures. The general trend of power consumption shows an increase with the decrease of LT evaporator and IT. The highest '/(/ 0, ()* was experienced when circulating the R410A/R134a pair at IT of (33)°C. It was ranged between (212) kW and (257) kW calculated at (-4)°C and (-15)°C LT evaporator temperature respectively. Whereas, the R717/R600a system showed the lowest consumed power by compressors at (35)°C IT, it was ranged between (181 and 220) kW for the whole range of LT evaporator temperature. R410A/R134a refrigerant pair showed higher values than those of the R717/R600a by (9-10)% and (10%) at intermediate temperatures of (33)°C and (35)°C respectively for the whole test range of LT evaporator temperatures.
(35)°C showed lower power consumption than that of (33)°C for the whole range of test conditions. This was also
confirmed by a number of previous studies conducted by [4] and [10-12].
Figure 6. Compressors power consumption comparison of the analyzed systems.
The results revealed that R717/R134a at (33)°C IT has exhibited similar behavior and close numerical values to those of the R410A/R134a and R407C/R134a systems at IT of (35)°C. The higher power consumed by R410A or R407C at the LT cycle has been offset by a lower power consumption at the HT cycle by R134a at IT of (35)°C. On the contrary, R717 consumed less power on the LT cycle, but with higher power consumption on the R134a HT cycle. Hence, the total power consumption was almost equal in that sense. These discrepancies between the LT and HT cycles are mainly due to the differences of refrigerant flow rates and specific volumes of circulated refrigerants.
4.2.2. Heating Load Output
Ideal operating conditions for the heat pump states that the heating output load at the HT condenser can be estimated from:
! , (> , b *1 '/(/ 0, ()* (15)
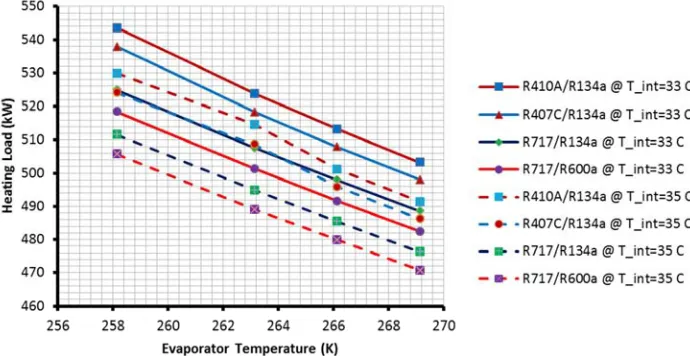
The heating load output of the test refrigerant pairs is compared in Figure 7 for both intermediate temperatures and its variation with LT evaporator temperature. Equation (15) revealed that the highest heating output was observed when circulating R410A/R134a refrigerant pair through the Cascade heat pump. It is ranged between (503) kW and (544) kW estimated at (-4)°C and (-15)°C LT evaporator temperature respectively at (33)°C IT.
Figure 7. Heat pump heating load comparison of different systems.
The lowest heating load output was experienced with R717/R600a system at (35)°C IT due to the lowest compressor power consumption as shown in Figure 6. R410A/R134a system exhibited higher heating load than that of R717/R600 one by (4 to 5)% for the whole range of LT
evaporator temperature and IT. R717/R600a system at (33)°C IT revealed a closer trend to that of R407C/R134a at (35)°C IT of the cascade heat exchanger.
4.2.3. Heat Pump Heating COP
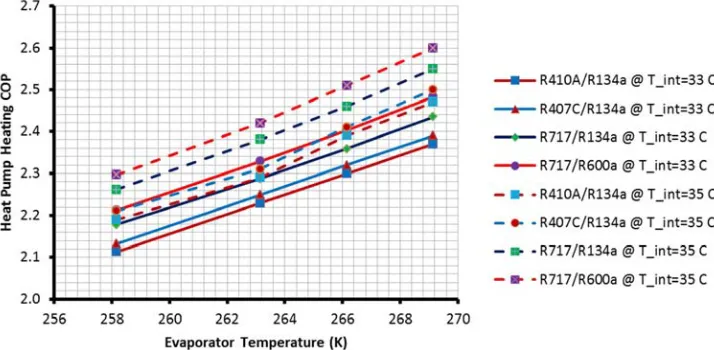
from the coefficient of performance COP. Applying eq. (7) yields the results shown in Figure 8 for the whole range of test operating conditions.
It is obvious that R717/R600a system possesses the highest heating COP among the analyzed systems at (35)°C IT. It was ranged between (2.3 and 2.6) calculated at 15)°C and
(-4)°C respectively. It showed higher COP values than those of the R410A/R134a by (5%) and (4.7%) at (33)°C and (35)°C intermediate temperatures respectively. The lowest heating COP was achieved by R410A/R134a system at (33)°C IT, it fell within the range of (2.1 to 2.4) at the investigated operating conditions.
Figure 8. Heat pump heating COP comparison of different systems.
The data showed that the heating COP of the heat pump increases proportionally with LT evaporator temperature and IT increase. Again, R717/R600a at (33)°C system exhibited a closer trend to that of the R407C/R134a and R410A/R134a refrigerant pairs at (35)°C than other test systems.
The specific power consumption is defined as:
4c)( Ge?=8$.d (16)
It represents the power consumed in (kW) per (3.5) kW of heating load produced from the Cascade heat pump system. The subscript (mode) refers either to the heat pump or plant operating conditions. Figure 9 shows a comparison of
4c!.*6)* between the test refrigerant pair systems at both intermediate temperatures.
The specific power consumed by the analyzed systems
showed lower values at (35)°C than those at (33)°C intermediate temperatures for the whole test range. R717/R600a system exhibited the minimum at (35)°C IT and R410A/R134a system at (33)°C IT occupies the maximum value among the test refrigerant. The respective COP values were ranged between (1.3-1.5) kW for R717/R600a at (35)°C IT and (1.5-1.65) kW for R410A/R134a estimated at (33)°C IT for the whole investigated LT evaporator operating conditions. The R717/R600a system at (33)°C IT exhibited the same specific power consumption as those of the R407C/R134a system and closer than other systems to R410A/R134a at (35)°C IT. The rest of refrigerant pairs fell within the maximum and minimum boundaries represented by the numerical values of (1.3-1.65).
4.3. Thermodynamic Plant Assessment
In this category, other sources of power consumed by the heat pump plant will be addressed and included for the efficiency and performance evaluation purposes.
4.3.1. Plant Power Consumption
The total power consumption is mainly electricity that is used to run compressors, pumps, control system and other auxiliary power consuming functions. The major components of these sources are compressors and pumps; these could be assessed from the preliminary available information for the heat pump objectives. The compressors power consumption for a vapor compression refrigeration unit is estimated as a part of the heat pump thermodynamic analysis. The pumps power consumption is estimated from the knowledge of the amount of heat extraction from the heat source, thermal fluid heat carrier operating conditions and hot water demand. Hence, this component could be accurately estimated for the heating plant as shown in section (3.6) of this article. Figure
10 shows a comparison for the estimated plant power consumption of the studied refrigerant pairs. The assessment of the power consumption by the heating plant showed an increase margin ranged between (5-7.5)% higher than that of the base heat pump value.
The same behavior has been revealed as that of the heat pump power consumption discussed above. The R410A/R134a showed the highest power consumption and the R717/R600a system consumed the lowest power to run the plant.
4.3.2. Plant Overall COP
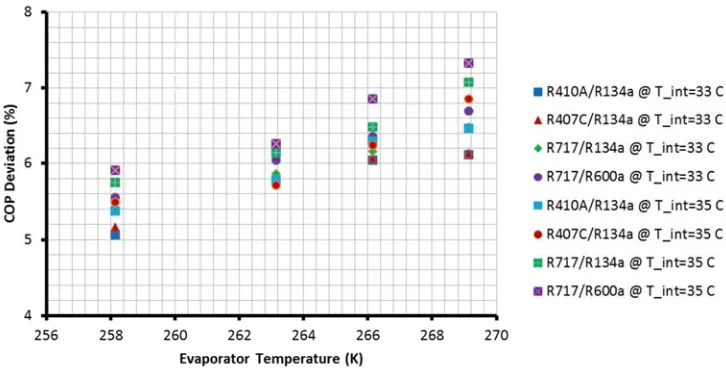
Equation (9) is implemented for the system COP calculation of the plant and comparison between different refrigerant pairs will be considered. The heating load will remain constant and unaltered under these conditions, but the total power consumption increases and consequently the COP of the plan will be reduced. The deviation percent of the power consumption and plant heating COP are compared to the heat pump parameters according to the following expressions:
Figure 10. Plant power consumption comparison of studied systems.
f? ?;8; <,"89#:;8; <,"8= :;8; <,"8= (17)
And
fGe? Ge?7. _=Ge? < 9; Ge? < 9; (18)
Figure 11. The deviation percent of the heat pump heating COP from the plant COP.
Figure 12 shows a comparison of the plant COP for the investigated refrigerant pairs. It is obvious that R717/R600a system still possesses the highest heating COP among the considered systems at (35)°C IT. It showed a range of (2.2
and 2.4) calculated at (-15)°C and (-4)°C respectively. It was higher than that of the R410A/R134a by (4.5%) and (4-5)% at (33)°C and (35)°C intermediate temperatures respectively.
Figure 12. Plant heating COP comparison of different systems.
The lowest heating COP was achieved by R410A/R134a system at (33)°C IT, it fell within the range of (2 to 2.2) at the test conditions. The data showed that the heating COP of the plant increases with LT evaporator and IT increase. Again, R717/R600a at (33)°C system exhibited a closer trend to that of the R407C/R134a and R410A/R134a refrigerant pairs at (35)°C than other analyzed systems.
The specific power consumption of the plant 4c*0 >/ is illustrated in Figure 13 with comparison for the implemented refrigerant pairs at the studied operating conditions. The minimum specific power consumption was revealed by R717/R600a system at (35)°C IT and the highest was possessed by R410A/R134a pair at (33)°C IT. Other refrigerant pairs occupy the zone extended between these two refrigerant systems.
It is clear that the power consumed by the plant is higher than that used to run the heat pump itself alone by a range fell within (5-7.5)% depending on the refrigerants circulated and operating conditions. Hence, the heating COP varies according to the power consumption; it is lower for the plant than that of the heat pump alone where only the power
consumed by compressors was implemented.
5. Closure Statement
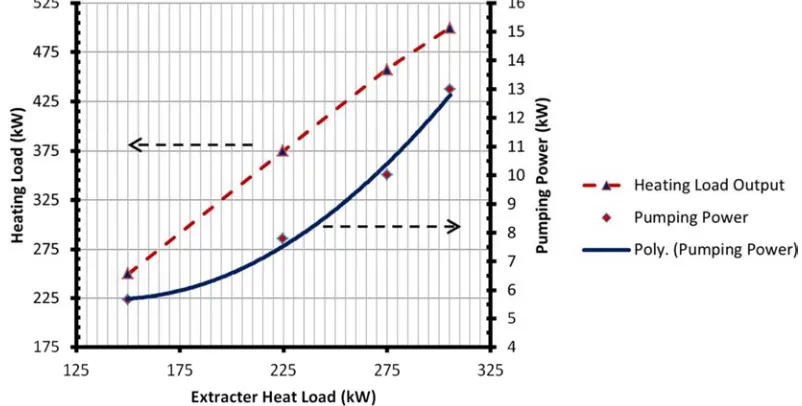
The R410A/R134a and R717/R600a systems at (35)°C IT were studied in a further detail for other extracted and heat pump output loads to assess the pumping power. These systems showed the lowest and highest plant COP when compared to other systems at the same operating conditions. Figure (14) was deduced from low temperature heat source extracted loads of (150, 225, 275 and 305) kW at the LT cycle evaporator. These values of pumping power consumption exhibited a deviation of about (5-7.5)% higher than that consumed by the compressors alone. The heating load output depends on the circulated refrigerant pairs and operating conditions. Hence, the data shown represent a rough estimate for the purpose of the present conclusion in this statement. The results of this study revealed that the power consumed by pumps to circulate sea water, brine and hot water through heat pump may account for (4-4.5)% of the load extracted.
Figure 14. Pumping power consumption and heating load output variation with extracted load from low temperature heat source.
The pumping power consumption variation revealed a polynomial equation with the extracted heat load at the LT evaporator in the form:
4/(/ 0, / 0.0003 g , b *h, 0.0733 g , b *h 1 10.808 (19)
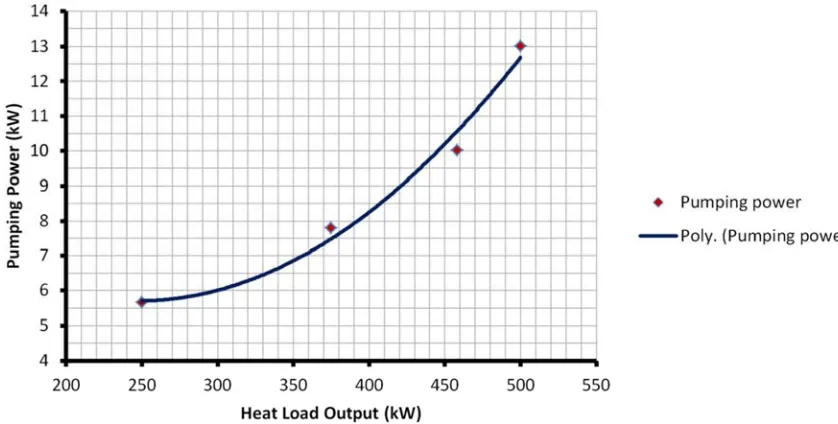
The pumping power variation with heating load output is illustrated in Figure 15. A polynomial behavior has been revealed for the trend of power consumption in the form:
4/(/ 0, / 0.0001 g ! , (> h, 0.0541 g ! , (> h 1 12.393 (20)
The results of this study revealed that the power consumed by pumps to circulate sea water, brine and hot water through heat pump may account for (2-3)% of the heating output load.
These relations hold for the investigated operating conditions
Figure 15. Pumping power consumption variation with heat output load.
6. Conclusions
A preliminary design of heating plant implementing a heat pump technology has been accomplished where low temperature heat source was considered. More accurate performance method was postulated to evaluate the power consumption to run a heat pump where pumping power consumption was included. R717/R600a revealed the lowest power and specific power consumptions and highest heat pump and plant COP among the rest refrigerant pairs at (35)°C IT. On the contrary, R410A/R134a showed the highest power consumption, lowest plant and lowest heat pump heating COP at (33)°C IT. The suggested assessment technique showed that the heat pump heating COP was higher than that of the plant one by a range of (5 to 7.5)%. The specific power consumption of the plant was higher than that of the heat pump by (5-7.5)%.
All of circulated refrigerant pairs exhibited higher heating
COP at (35)°C IT than that of (33)°C one when are operating under the same conditions. The trend of heating COP showed an increase with intermediate and LT evaporator temperatures increase. The results showed that the power consumed by pumps to circulate sea water, brine and hot water through heat pump may account for (4-4.5)% and (2-3)% of the extracted and output loads of the heat pump respectively. Higher values of power consumption are expected when other pressure losses in the flow direction are taken into consideration.
Acknowledgement
The author would like to express his sincere thanks to Mechatronic Engineering Department staff in the University of Southern Denmark (SDU) for providing the facilities to accomplish this work.
Nomenclature
Parameter Definition Subscripts
COP Coefficient of performance, (---) cascade Cascade heat exchanger
cp Fluid specific heat, (kJ/kg°C) comp Compressor
d Diameter, (mm) cond Condenser
F Coefficient of friction, (---) cons Consumed
g Gravitational acceleration, (m/s2) evap Evaporator
GWP Global warming potential of refrigerant H. Pump Heat pump
h Fluid enthalpy, (kJ/kg) HT High temperature cycle
IT Intermediate temperature, (°C) or (K) i Inner
L Pipe length, (m) IT Intermediate Temperature
LMTD Logarithmic mean temperature difference, (K) l Liquid
Fluid mass flow rate, (kg/s) LT Low temperature cycle
∆p Pressure drop in eq. (11), (Pa) P Power consumption value
P Power consumption, (kW) ref Refrigerant
4c Specific power consumption, (kW) shaft Shaft power of pump
Heat load, (kW) S-W Sea water
sg Specific gravity, (---) total Total value
T Temperature, (°C) or (K) Greek Letters
∆T Temperature difference, (°C) or (K) ∆ Difference
V Fluid velocity, (m/s) ε Deviation percent, (%)
@ Fluid volumetric flow rate, (m3/hr) η Efficiency (%)
' Compressor power consumption ρ Fluid density (kg/m3)
'c Specific power consumption, (kW) Z Differential pumping head, (m)
References
[1] Jang, S. W. and Lee, Y. L., Study on improving the performance of the Cascade heat pump cycle using ejectors”, Indian Journal of Science and Technology, 8 (30), 2015. DOI:10.17485/ijst/2015/v8i30/73895.
[2] Kasi, P., Simulation of thermodynamic analysis of Cascade refrigeration systems with alternative refrigerants, International Journal of Mechanical Engineering and Technology (IJMET), 6 (1), pp. 71-91, 2015.
[3] Bertsch, S., Uhlmann, M., and Heldstab, A., Heat pump with two heat sources on different temperature levels, International Refrigeration and Air Conditioning Conference, 14th July (2014), Paper 1372, Purdue University, USA, 2014. http://docs.lib.purdue.edu/iracc/1372.
[4] Tarrad, A. H., Thermodynamic analysis for hybrid low temperature sustainable energy sources in Cascade heat pump technology, Asian Journal of Engineering and Technology (AJET),5 (2), pp 29-46, 2017.
[5] Kim, D. H., Park, H. S., and Kim, M. S., Optimal temperature between high and low stage cycles for R134a/R410A Cascade heat pump based water heater system”, Experimental Thermal and Fluid Sci.,47, 172-179, 2013.
[6] Baker, A. and Schaefermeyer, D., Sea water heat pump project, Alaska Center for Energy and Power (ACEP) Rural Energy Conference Forum, 2013.
[7] Kim D. H. and Kim M. S., The effect of water temperature lift on the performance of Cascade heat pump system, Appl. Therm. Eng.; 67, 273-282, 2014.
[8] Yrjölä, J. and Laaksonen, E., “Domestic hot water production with ground source heat pump in apartment buildings”, Energies, 8, 8447-8466, 2015. DOI: 10.3390/en8088447. [9] Song, Y., Li, D., Yang, D., Jin, L., Cao, F., and Wang, X.,
Performance comparison between the combined R134a/CO2 heat pump and Cascade R134a/CO2 heat pump for space heating, International Journal of Refrigeration, 2016. DOI:10.1016/j.ijrefrig. 2016.12.001.
[10] Kim, J., Lee, J. Choi, H, Lee S., Oh, S. and Park, W., Experimental study of R134a/R410A Cascade cycle for variable refrigerant flow heat pump systems, Journal of Mechanical Science and Technology, 29 (12), pp 5447-5458, 2015. DOI: 10.1007/s12206-015-1146-2.
[11] Tarrad, A. H., Thermodynamic performance evaluation for low temperature heat source Cascade system circulating environment friendly refrigerants, International Journal of Energy and Environmental Science, 2 (2), pp 36-47, 2017. DOI: 10.11648/j.ijees.20170202.12.
[12] Tarrad, A. H., Thermodynamic evaluation for intermediate temperature optimization in low temperature heat source Cascade heat pump technology, accepted for publication in International Journal of Environmental Science (IJES), 2017. [13] Technical University of Denmark (DTU), “CoolPack: A
Collection of Simulation Tools for Refrigeration”, Denmark, 2001.