INTERNATIONAL JOURNAL OF PHARMACEUTICAL, CHEMICAL AND BIOLOGICAL SCIENCES
Available online at www.ijpcbs.com
A NEW HPLC METHOD FOR SIMULTANEOUS
DETERMINATION OF ATENOLOL AND
PREGABALIN IN DOSAGE FORMS AND IN HUMAN URINE
AM. Atta
1, S. Mostafa
2, I. Salama
2and MS. Gomaa
2*1Department of Pharmaceutical Chemistry, Faculty of Pharmacy
and Pharmaceutical Industries, Sinai University (Elkantra branch), Egypt.
2Department of Pharmaceutical Chemistry, Faculty of Pharmacy,
Suez Canal University-41522 Ismailia, Egypt.
INTRODUCTION
Atenolol
(RS)-2-{4-[2-Hydroxy-3-(propan-2-ylamino) propoxy] phenyl} acetamide (Fig.1)
is a selective β1 (cardioselective) receptor
antagonist, a drug belonging to the group of beta blockers which is group of drugs used primarily in treatment of cardiovascular diseases. It is used alone or in combination with other medications for treatment of hypertension so it helps prevent strokes, heart attacks, and kidney problems. Several methods in the literature were found describing the determination of atenolol in dosage form, human plasma and human urine. These methods include high
performance liquid chromatography (HPLC)1-16,
Gas Chromatography17, Chemometry18,19
capillary zone electrophoresis20,
Spectrofluorometry21.
Pregabalin
(S)-3-(aminomethyl)-5-methylhexanoic acid (Fig.2) is structural analogue to the naturally occurring transmitter
GABA (gamma-aminobutyric acid). It is a potent ligand for the alpha-2-delta subunit of voltage-gated calcium channels in the central nervous system that reduces depolarization-induced calcium influx with a consequential modulation in excitatory neurotransmitter release. It is
currently being developed for epilepsy,
neuropathic pain, and generalized anxiety
disorder22. Pregabalin is the first drug to receive
approved labeling from the Food and Drug Administration (FDA) for the treatment of painful diabetic neuropathy and postherpetic neuralgia and is the first antiepileptic agent to
receive FDA-approved labeling since 199923.
Several methods in the literature described the determination of pregabalin in dosage form, human plasma and human urine. These methods
include high performance liquid
chromatography (HPLC)24-35,
Spectrophotometry36-42, Spectroflurometry43,
Research Article
ABSTRACT
In this study, we have developed, optimized and validated a new high-performance liquid chromatographic method for simultaneous determination of atenolol and pregabalin in their dosage forms and in human urine. The new method used a C18 column with mobile phase consisting of
potassium dihydrogen phosphate and methanol in the ratio of 92.5:7.5 (v/v) and buffered at pH 6.0 with orthophosphoric acid, with a flow rate of 1 mL/min. Quantitation was achieved with UV detection at 230 nm. In addition, the urinary excretion patterns of atenolol and pregabalin were calculated using the proposed method by analysis of urine samples of five healthy volunteers during 24 hours after single oral administration of both drugs. The developed method was proved to be specific, robust and accurate for the determination of the studied drugs in pharmaceutical preparations and in human urine.
capillary electrophoresis44 and Gas
Chromatography45.
Recent consensus guidelines recommend
pregabalin as a first-tier treatment for painful
diabetic peripheral neuropathy (DPN)46.
Atenolol is used in the treatment of several cardiovascular diseases including hypertension, coronary artery disease, heart attack and angina. This type of patients usually has diabetes and/or other cardiovascular disorders which require the concomitant administration of these two medications. Pregabalin can be taken safely by patient treated with atenolol making this combination a highly prescribed
one47.Unlike, pregabalin is not prescribed to
patients treated with Angiotensin-converting-enzyme inhibitors (e.g. lisinopril & enalapril) as there is a drug- drug interaction (increased risk
of angioodema)48. Therefore, the biological
quantification of atenolol and pregabalin in presence of each other is of pharmaceutical and clinical significance. However, there is no
reported method for simultaneous
determination of atenolol and pregabalin by
high performance liquid chromatography
(HPLC), in dosage form, spiked and human urine.
The aim of the present work was to develop, optimize and validate a simple, fast and reliable isocratic RP-HPLC method with UV detection for simultaneous determination of atenolol and pregabalin. Confirmation of the applicability of the developed method to urinary excretion, study was performed in healthy volunteers after single oral administration of commercially
available (Ateno®) tablet and (Lyrica®) capsule.
MATERIALS AND METHODS
Pharmaceutical-grade authentic standards of atenolol and pregabalin were kindly supplied by Eva pharmaceutical company, and were certified to contain 99,8 % (w/w)and 99.9 % (w/w) respectively.
Acetonitrile (SDS, France) used was of HPLC-grade. Potassium dihydrogen phosphate and
orthophosphoric acid (Riedel-de Haën
Laboratory Chemicals, Germany) used were of analytical-grade. All chemicals were used as received without further modification or purification.
Twenty mM potassium dihydrogen phosphate was prepared by dissolving 2.72 g of potassium dihydrogen phosphate in 1 L of distilled water for HPLC prepared by double glass distillation, filtered through 0.45 µm nylon membrane filters (Merck, Germany) and then degassed for 30 minutes in an ultrasonic bath.
The pharmaceutical preparation Ateno® 50
tablets manufactured by E.I.P.I.CO.
pharmaceutical company (Egypt) (Batch No. 1301548) labeled to contain 50 mg atenolol. The
pharmaceutical preparation Lyrica®75 capsules
manufactured by Pfizer pharmaceutical
company (Egypt) (Batch No. 2006) labeled to contain 75 mg pregabalin.
Instrumental and chromatographic conditions
The HPLC instrument used was (Bischoff, Germany); equipped with model series 2250 LC pump, Rheodyne 7125 injector with a 20 µL loop and a LC lambda 1010 variable wavelength
spectrophotometric detector (Bischoff).
Seperation and quantitation were made on
reversed phase phenomenex column [C18 (5µm,
250 ×4.6 mm,i.d.)]. The sample was injected with 25 µl Hamilton analytical syringe. Data acquisition was performed on a model MCDACq data acquisition (version 1.3 x) and Kyocera FS-820 printer.
The detection wavelength was set at 230 nm and was selected using a double –beam Shimadzu [Tokyo, Japan] UV-1601 PC UV-Visible spectrophotometer (10 mm optical path length matched quartz cell).
The mobile phase was prepared by mixing 20 mmol/L of potassium dihydrogen phosphate, adjusted to pH 6 ± 0.1 by 1 M orthophosphoic acid and 100% methanol, in ratio of 92.5: 7.5. The pH of the mobile phase was adjusted by
Cole Parmer® pH-meter. The mobile phase was
filtered using PhenomenexTM vaccum
filteration system equipped with 0.45 µm nylon membrane filter and degassed for 30 minute via an ultrasonic bath. The flow rate was 1mL/min. All determinations were performed at ambient temperature.
Standard solutions and calibration graphs
Stock standard solutions were prepared in concentration of 1mg/mL for pregabalin and 0.1mg/mL for atenolol. The standard solutions were prepared by further dilution of stock
solutions with methanol to reach the
concentration range of 200-700 µg mL-1 for
pregabalin and 5-55 µg mL-1 for atenolol.
Triplicate 20 µl injections were made for each concentration and chromatographed using the specified HPLC chromatographic conditions described previously. The peak area values were plotted against corresponding concentrations in order to construct the calibration curve for each compound. Linear relationships were obtained.
Sample preparation
Determination of Lyrica® capsules
equivalent to 75 mg pregabalin was accurately weighed transferred to 100 mL volumetric flask and extracted with 75 mL methanol. The solution was filtered through 0.45 µm
membrane filter; further dilutions with
methanol to reach the linearity range for drug were done. The prepared solutions were analyzed using the HPLC chromatographic conditions described previously. The peak area ratio for each concentration was plotted against the corresponding concentration to construct the calibration graph of pregabalin.
Determination of Ateno® tablets
Twenty tablets were weighed and finely powdered. A portion of the powder equivalent to 50 mg atenolol was accurately weighed transferred to 100 mL volumetric flask and extracted with 100 mL methanol. The solution was filtered through 0.45 µm membrane filter, and further dilution with methanol to reach linearity range for the drug was done. The prepared solutions were chromatographed using HPLC conditions described previously. The peak area ratio for each concentration was plotted against the corresponding concentration to construct the calibration graph of atenolol.
Determination of pregabalin and atenolol in spiked urine
Standard solutions of pregabalin and atenolol were diluted with drug free human urine to obtain the concentration range of 200-700 µg/mL for pregabalin and 5-55 µg/mL for atenolol. Into 2 mL Eppendorf tubes, 1 mL of the spiked urine samples were added to I mL methanol and filtered through 0.45 µm membrane filter. Triplicate 20 µl injections were
made for each concentration and
chromatographed under the HPLC conditions described above. The peak area of each
concentration was plotted against the
corresponding concentration to obtain the calibration graph of each compound.
In vivo procedures
Written consent was obtained from the volunteers and the study was approved by the Human Ethics Committee of the faculty of pharmacy, Suez Canal University.
The proposed method was applied to determine the concentration of pregabalin and atenolol in urine of 5 healthy (normal liver, kidney functions and electrocardiogram) Egyptian female and male volunteers (aged between 25 & 40 years, weighing between 45 &75 Kg and 157 & 170 cm height) after an oral administration of 75mg pregabalin and 50 mg atenolol (single dose of Lyrica® 75mg capsule and Ateno® 50
mg tablet). The method was also applied to investigate the urinary excretion patterns of pregabalin and atenolol.
The volunteers were instructed to stop all medications for 2 weeks before administration and also during study. Also, the volunteers were instructed to be sure of evacuating the urinary bladder as thoroughly as possible just before the administration of one pregabalin capsule (75 mg) and one atenolol tablet (50mg) with about 350 mL of water.
The 0-h urine samples were collected as blank. Urine samples were collected at intervals for up to 24 hours. The volume of urine specimens were measured and recorded after each
collection, and stored at -20˚C until
determination. Suitable volume (1mL) of the urine specimen from each sampling point was transferred to 2 mL Eppendorf tubes and I mL methanol was added. The solution was filtered through 0.45 µm membrane filter. A 20 µl was injected into HPLC, in triplicate for each solution and chromatographed under the conditions
described above. The concentration of
pregabalin and atenolol were calculated using regression equation.
RESULTS AND DISCUSSION
Optimization of chromatographic conditions
The proposed RP-HPLC method was proved to be simple, accurate and reproducible for simultaneous determination of pregabalin and atenolol in dosage forms, spiked and volunteers human urine without any interference from excipients or urine matrix. The proposed method was optimized for parameters such as effect of organic modifier, pH of buffer and flow rate.
The effect of organic modifier
The percentage of organic modifier (methanol) has a critical effect on separation of pregabalin and atenolol. It was found that increasing the proportion of methanol than 10% led to interference between pregabalin peak and urine matrix and inadequate resolution between atenolol and pregabalin. While decreasing the proportion of methanol less than 7.5% caused excessive tailing of pregabalin and atenolol peaks. Best separation was obtained using 7.5% methanol.
The effect of buffer pH
peaks was accomplished but best resolution and better peak shape were achieved at pH 6. The reason behind that could be due to the basic nature of atenolol that is protonated in acidic pH and pregabalin that is amino acid in nature and is mainly zwitter ion at acidic pH and this led to rapid elution and inadequate separation as well as interference with urine matrix. In the alkaline side, atenolol is highly retained leading to undesirable long run time. The optimum pH was found to be in the slightly acidic side where the atenolol is not highly retained and pregabalin is not mainly ionic and rapidly eluted. This is also appropriate for the application of the method to the biological samples that necessities the elution of the first compound of the sample matrix (~ 6 min).
The effect of flow rate
The proposed method was performed at flow rate 1mL/min. At higher flow rate (> 1mL/min), bad resolution between studied compounds and urine matrix was obtained but at flow rate less than 1mL/min led to peak broadening and undesirable increase in run time.
According to the above investigation, the
optimum chromatographic separation of
pregabalin and atenolol was obtained using mobile phase prepared by mixing 20 mM potassium dihydrogen phosphate (pH adjusted to 6 by orthophosphoric acid) with methanol in the ratio of 92.5: 7.5 (v/v). The flow rate was 1.0 mL/min. Quantitation was achieved using of UV detection at 230 nm. The performance of the proposed method on real samples was demonstrated by its application to human urine samples taken from healthy volunteers who
received Lyrica® 75 capsule and Ateno® 50
tablet. Figure (3) shows typical chromatograms
of Lyrica® 75 capsule and Ateno® 50 tablet.
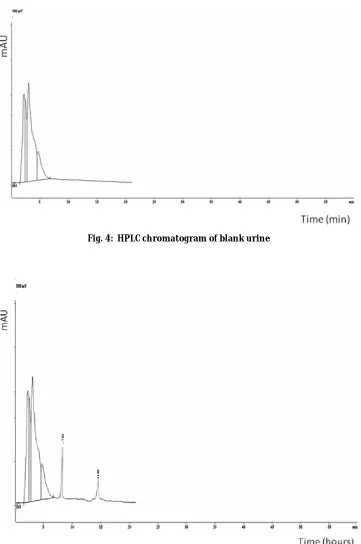
Figure (4) and figure (5) show typical chromatograms of urine samples. Average retention time (± SD) for pregabalin and atenolol were 7.9 ± 0.08 and 14.9 ± 0.06 min, respectively.
Urinary excretion patterns
Cumulative urinary excretion is often used in pharmacokinetic and clinical studies in humans and animals to learn about the disposition of the drug, the fraction of drug absorbed and the extent of bioavailability (EBA) of a drug. Therefore we decided to determine the urinary excretion patterns of these two drugs after single oral administration and by which we can determine the concentration of atenolol and pregabalin in urine at any time during 24 hours after oral administration.
The cumulative urinary excretion patterns of pregabalin and atenolol were investigated in
healthy volunteers after a single oral
administration of Lyrica® 75 mg capsule and
Ateno® 50 mg tablet figure (6-7) and table (8-9).
It appeared that approximately 80 % of pregabalin and 45.6 % of atenolol were excreted unchanged within 24 hours after oral administration.
Method validation Linearity and range
The linearity of the proposed HPLC method was evaluated by analyzing a set of different concentrations of atenolol and pregabalin. Five concentrations were selected, ranging between 5-55 µg/mL for atenolol and 200-700 µg/mL for pregabalin. Each concentration was injected in triplicate and the mean value of the peak area ratios was taken for constructing the calibration curve. The regression analysis revealed a satisfactory correlation and an intercept value
not statistically (P ≤ 0.05) different from zero.
Characteristic parameters for the regression equations of the HPLC method obtained by least-squares treatment of the results were given in table (1-2).
Detection and quantification limits (sensitivity)
The limit of detection (LOD) and limit of
quantification (LOQ) were determined
according to the current ICH guidelines as the ratio of 3.3 and 10 standard deviations of the blank respectively, against the slope of the
calibration line49. The theoretical values were
calculated practically and given in tables (1-2) indicating the high sensitivity of the proposed HPLC method.
Accuracy
The accuracy of the method was performed by standard addition method that was applied for each compound in pharmaceutical dosage form and in human urine. Three replicate samples of each concentration level were prepared and % recovery at each level and mean % recovery were determined as listed in tables (3-4). The proposed method shows high degree of accuracy as neither the excipients in the pharmaceutical formulations nor the biological endogenous compounds interfere in the analysis of atenolol and pregabalin by the proposed HPLC method.
Precision
The intra-day precision of HPLC method was determined by injection of three replicates of
three different concentrations of each
compound which were prepared and analyzed on the same day. The inter-day precision of the HPLC method was determined by injection of
three replicates of three different
concentrations of each compound, which were prepared and analyzed on three successive days. CV values were calculated and found to be less than 2 (table 5-6) showing excellent precision for the proposed HPLC method during analysis either on the same day or on three successive days.
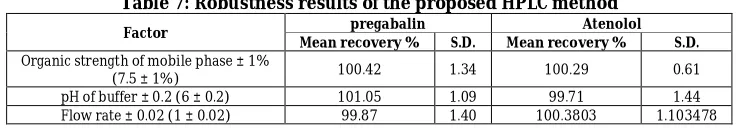
Robustness
Variation of buffer pH by ± 0.2 units, organic composition of the mobile phase by ± 1 % or elution flow rate by ± 0.02 mL/min did not have a considerable effect on chromatographic resolution. Only one parameter was varied and analysis was performed according to the previous chromatographic procedure (number of replicate n=3). The results revealed a good robustness of the proposed method (table 7).
Selectivity
Selectivity of the proposed method in bulk was determined by preparing five mixtures of different concentrations of atenolol and pregabalin within their linearity range. The selectivity of the method in spiked human urine was carried out by preparing five mixtures of different concentrations of atenolol and pregabalin within their linearity range using drug free human urine. Then, the prepared
mixtures were analyzed using the
chromatographic conditions described
previously. The obtained results revealed the high selectivity of the proposed HPLC method for simultaneous determination of pregabalin and atenolol in bulk and in spiked human urine (table 10-11).
Analytical solutions stability
It was found that the samples of atenolol and pregabalin in mobile phase were stable for at least 5 hours at room temperature. The stability of stock solutions of atenolol and pregabalin in methanol were checked and proved to be stable
for at least 2 weeks at 4˚C.
Urine samples spiked with atenolol and pregabalin were evaluated for the stability following freezing and thawing. The drugs were stable for at least three freeze-thaw cycles. No considerable changes were observed for the stability of the spiked urine samples after 2
weeks of storage at -20˚C.
System suitability tests
Resolution and other system suitability parameters (capacity factor (k/), selectivity
factor (α), number of theortical plates and RSD% of retention time were calculated for atenolol and pregabalin. A value of 20.56 for resolution and tailing factor of 0.83 and 1.16 for pregabalin and atenolol respectively implies a good separation of these components within a reasonable run time. Also the values of the capacity factor and the theoretical plate counts reflect the efficiency of the seperation (table 12).
CONCLUSION
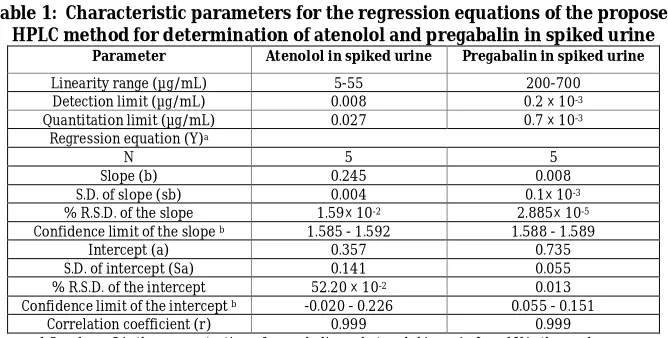
Table 1: Characteristic parameters for the regression equations of the proposed HPLC method for determination of atenolol and pregabalin in spiked urine
Parameter Atenolol in spiked urine Pregabalin in spiked urine
Linearity range (µg/mL) 5-55 200-700
Detection limit (µg/mL) 0.008 0.2 × 10⁻³
Quantitation limit (µg/mL) 0.027 0.7 × 10⁻³
Regression equation (Y)a
N 5 5
Slope (b) 0.245 0.008
S.D. of slope (sb) 0.004 0.1× 10⁻³
% R.S.D. of the slope 1.59× 10⁻² 2.885× 10⁻⁵
Confidence limit of the slope b 1.585 - 1.592 1.588 - 1.589
Intercept (a) 0.357 0.735
S.D. of intercept (Sa) 0.141 0.055
% R.S.D. of the intercept 52.20 × 10⁻² 0.013
Confidence limit of the intercept b -0.020 - 0.226 0.055 - 0.151
Correlation coefficient (r) 0.999 0.999
ay= a+bC , where C is the concentration of pregabalin and atenolol in µg/mL and Y is the peak area,
b 95% confidence limit.
Table 2: Characteristic parameters for the regression equations of the proposed HPLC method for determination
of atenolol and pregabalin in bulk
Parameter Atenolol Pregabalin
Linearity range (µg/mL) 5-55 200-700
Detection limit (µg/mL) 0.007 1.7×10⁻⁴
Quantitation limit (µg/mL) 0.023 5.4×10⁻⁴
Regression equation (Y)a
N 5 5
Slope (b) 0.300 0.0076
S.D. of slope (sb) 0.004 8.4 × 10⁻⁵
% R.S.D. of the slope 0.013 2.05 × 10⁻⁵
Confidence limit of the slope b 1.586 –
1.592
1.588 – 1.589
Intercept (a) 3.572 1.741
S.D. of intercept (Sa) 0.120 0.038
% R.S.D. of the intercept 0.444 0.009
Confidence limit of the interceptb 0.924 – 1.135 0.068 ̵ 0.137
Correlation coefficient (r) 0.999 0.999
ay= a+bC , where C is the concentration of pregabalin and atenolol
in µg/mL and Y is the peak area, b 95% confidence limit.
Table 3: Results of the recovery studies by standard addition technique for the assay of atenolol in tablet and spiked urine
Atenolol Level
Amount of atenolol
taken (µg/mL)
Amount of atenolol
added (µg/mL)
Total concentration found (µg/mL)
Recovery
% recovery % Mean
Tablet
I 50 3 52.991 99.98
100.275
II 50 5 55.322 100.58
III 50 7 56.455 99.04
IV 50 9 59.887 101.50
Spiked urine
I 10 2 11.543 96.19
98.69
II 10 4 14.443 103.16
III 10 6 15.486 96.78
IV 10 8 17.760 98.66
Table 4: Results of the recovery studies by standard addition technique for the assay of pregabalin in capsules and spiked urine
Pregabalin Level Amount of pregabalin taken (µg/mL) Amount of pregabalin added (µg/mL) Total concentration found (µg/mL)
Recovery
% recovery % Mean
capsules
I 300 20 321.45 100.45
100.55
II 300 55 358.55 101.00
III 300 70 367.89 99.43
IV 300 100 405.33 101.33
Spiked urine
I 400 10 415.34 101.30
99.72
II 400 35 438.67 100.84
III 400 75 468.44 98.61
IV 400 90 480.88 98.13
Table 5: Results of the intra-day and inter-day precision expressed as CV in the assay of atenolol in tablets and spiked urine
Atenolol Concentration (µg/mL)
Intra-day precision Inter-day precision Recovery % a ± S.D CV Recovery % b ± S.D CV
Tablets
10 100.5 ± 0.05 0.52 99.1 ± 0.34 0.34
30 100.4 ± 0.07 0.24 99.78 ± 0.25 0.8
50 99.19 ± 0.28 0.56 100.6 ± 0.19 0.3
Spiked urine
10 100.7 ± 0.25 0.25 99.7 ± 0.21 0.21
30 100.6 ± 0.35 0.12 99.4 ± 0.16 0.5
50 99.8 ± 0.28 0.5 99.7 ± 0.30 0.6
a Mean and S.D. for three determinations. b Mean and S.D. for three constitutive days.
Table 6: Results of the intra-day and inter-day precision expressed as CV in the assay of pregabalin in capsules and spiked urine
Pregabalin Concentration(µg/mL) Intra-day precision Inter-day precision Recovery % a ± S.D CV Recovery % b ± S.D CV
capsules
300 100.12 ± 0.35 0.116 99.4 ± 0.61 0.24
400 99.9 ± 0.81 0.203 100.6 ± 0.8 0.19
500 99.5 ± 0.64 0.129 100.05 ± 0.8 0.16
Spiked urine
350 100.14 ± 0.55 0.166 100.56 ± 0.9 0.28
370 100.28 ± 0.45 0.122 99.5 ± 0.72 0.19
450 99.99 ± 0.71 0.159 99.36 ± 0.9 0.20
a Mean and S.D. for three determinations. b Mean and S.D. for three constitutive days.
Table 7: Robustness results of the proposed HPLC method
Factor pregabalin Atenolol
Mean recovery % S.D. Mean recovery % S.D. Organic strength of mobile phase ± 1%
(7.5 ± 1%) 100.42 1.34 100.29 0.61
pH of buffer ± 0.2 (6 ± 0.2) 101.05 1.09 99.71 1.44
Table 8: Cumulative amount of atenolol excreted in urine
Excretion profile
Time (h) Cumulative amount (mg)
0.0 0.0
2.0 2.0
3.0 5.0
6.0 11.0
8.0 15.0
9.5 18.0
12.0 20.0
15.0 20.9
18.0 21.5
20.5 22.3
24.0 22.8
Table 9: Cumulative amount of pregabalin excreted in urine
Excretion profile
Time (h) Cumulative amount (mg)
0.0 0.0
2.0 3.5
3.0 8.0
6.0 25.0
8.0 38.0
9.5 44.0
12.0 49.0
15.0 53.0
18.0 55
20.5 57.3
24.0 60.0
Table 10: Results of selectivity of HPLC method in bulk
Mix. No.
Mixture- conc.
(µg/mL) % Recovery
Pregabalin atenolol Pregabalin atenolol
1 200 50 100.5 98.8
2 300 40 99.2 99.7
3 400 30 98.8 100.9
4 500 20 101 99.6
5 600 10 99.1 101.6
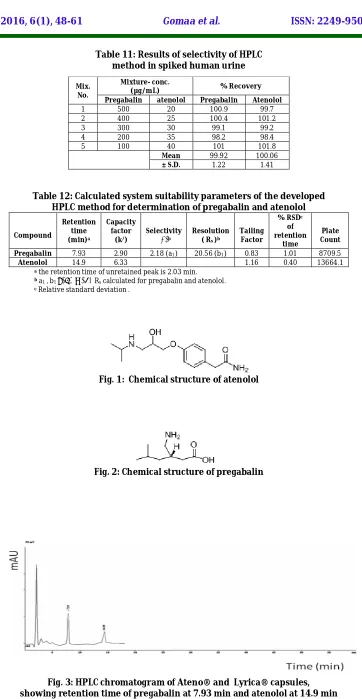
Table 11: Results of selectivity of HPLC method in spiked human urine
Table 12: Calculated system suitability parameters of the developed HPLC method for determination of pregabalin and atenolol
Compound
Retention time (min)a
Capacity factor
(k/)
Selectivity
(α)b
Resolution ( Rs )b
Tailing Factor
% RSDc
of retention
time
Plate Count
Pregabalin 7.93 2.90 2.18 (a1) 20.56 (b1) 0.83 1.01 8709.5 Atenolol 14.9 6.33 1.16 0.40 13664.1
a the retention time of unretained peak is 2.03 min. b a1 , b1 : are α and Rs calculated for pregabalin and atenolol. c Relative standard deviation .
Fig. 1: Chemical structure of atenolol
Fig. 2: Chemical structure of pregabalin
Fig. 3: HPLC chromatogram of Ateno® and Lyrica® capsules, showing retention time of pregabalin at 7.93 min and atenolol at 14.9 min
Mix. No.
Mixture- conc.
(µg/mL) % Recovery Pregabalin atenolol Pregabalin Atenolol
1 500 20 100.9 99.7
2 400 25 100.4 101.2
3 300 30 99.1 99.2
4 200 35 98.2 98.4
5 100 40 101 101.8
Fig. 4: HPLC chromatogram of blank urine
Fig. 6: Cumulative excretion pattern of atenolol in urine of a healthy human volunteer after a single oral dose of 50 mg atenolol
Fig. 7: Cumulative excretion pattern of pregabalin in urine of a healthy human volunteer after a single oral dose of 75 mg pregabalin
REFERENCES
1. Weich A, Oliveira DC, Melo J, Goebel K
and Rolim CMB. Validation of UV spectrophotometric and HPLC methods for quantitative determination of
atenolol in pharmaceutical
preparations. LAT AM J PHARM. 2007;26(5):765–770.
2. Kumar N, Verma N, Songh O, Joshi N
and Singh KG. Estimation of Atenolol by Reverse Phase High Performance Liquid
Chromatography. E-J CHEM.
2010;7(3):962-966.
3. Bhaskara BL, Kumar SA and Kumar
URA. A Facile and Rapid HPLC Method for the Determination of Atenolol in
Pharmaceutical Formulations. Asian J Appl Sci. 2011; 4:306-313.
4. Yilmaz B, Arslan S and Asci A. HPLC
Method for Determination of Atenolol in Human Plasma and Application to a Pharmacokinetic Study in Turkey. J Chromatogr Sci. 2012;50(10):914-919.
5. Spanakis M and Niopas I. Determination
of Atenolol in Human Plasma by HPLC with Fluorescence Detection: Validation and Application in a Pharmacokinetic
Study. J Chromatogr Sci.
2013;51(2):128-132.
6. Kadian N, Maste M and Bhat AR. An
Effective RP-HPLC Method for the
Atenolol and Indapamide in Marketed Tablet Formulation (ATEN-D). Asian J Research Chem. 2012;5(3):405–408.
7. Vasant PP, Damuanna GP, Himmatrao
BV and Pandit PS. Development and validation of RP-HPLC method for simultaneous estimation of atenolol and indapamide in pharmaceutical dosage form. Int J Res Ayurveda Pharm. 2011;2(3):918-923.
8. Kavitha J and Muralidharan S.
Development and Validation of New
Method for Atenolol,
Hydrochlorothiazide and Losartan
potassium by RP-HPLC: Its Application to Routine Quality Control Analysis. Int J Chem Tech Res. 2010;2(2):880-884.
9. Sharma R, Khanna S and Mishra GP.
RP-HPLC Method for Simultaneous
Estimation of Atenolol,
Hydrochlorothiazide and Losarton in Tablet Dosage form. Chem Sci Trans. 2013; 2(S1):S1-S6.
10. Tengli AR and Gurupadayya BM.
Method development and validation of tablet dosage form containing losartan, atenolol and hydrochlorthiazide using internal standard by RP-HPLC. J Chromatogr Sep Tech. 2013;4(5):180.
11. Elgawish MS, Mostafa SM and
Elshanawane AA. Simple and rapid
HPLC method for simultaneous
determination of atenolol and
chlorthalidone in spiked human plasma. Saudi Pharm J. 2011;19(1):43-49.
12. Giachetti C, Tenconi A, Canali S and
Zanolo G. Simultaneous determination of atenolol and chlorthalidone in plasma by high-performance liquid
chromatography. Application to
pharmacokinetic studies in man. J Chromatogr B Biomed Sci Appl. 1997;698(1-2):187-194.
13. El-gindy A, Sallam S and Abdel-salam
RA. HPLC method for the simultaneous
determination of atenolol and
chlorthalidone in human breast milk. J Sep Sci.2008;31(4):677-682.
14. Elshanawane AA, Mostafa SM and
Elgawish MS. Development and
validation of a reversed-phase high-performance liquid chromatographic
method for the simultaneous
determination of amiloride
hydrochloride, atenolol,
hydrochlorothiazide, and
chlorthalidone in their combined
mixtures. J AOAC Int. 2009;92(2):404- 409.
15. Belal F, Sharaf El-Din M, Aly F, Hefnawy
M and El-Awady M. Stability-indicating HPLC method for the determination of
atenolol in pharmaceutical
preparations. J Chromatogr Sep Tech. 2013;4(1):164.
16. Youssef RM, Maher HM, El-kimary El,
Hassan EM and Barary MH. Validated stability-indicating methods for the
simultaneous determination of
amiloride hydrochloride, atenolol, and chlorthalidone using HPTLC and HPLC with photodiode array detector. J AOAC int. 2013;96(2):313-323.
17. Yilmaz B and Arslan S. Determination of
atenolol in Human Urine by Gas
Chromatography–Mass Spectrometry
Method. J Chromatogr Sci.
2011;49(5):365-369.
18. Ferraro MC, Castellano PM and
Kaufman TS. Chemometrics-assisted simultaneous determination of atenolol and chlorthalidone in synthetic binary mixtures and pharmaceutical dosage
forms. Anal. Bioanal. Chem.
2003;377(7-8):1159-1164.
19. El-Gindy A, Emara S and Mostafa A.
HPLC and chemometric-assisted
spectrophotometric methods for
simultaneous determination of atenolol,
amiloride hydrochloride and
chlorthalidone. Farmaco.
2005;60(3):269-278.
20. Al Azzam KM, Saad B and Aboul-Enein
Hy. Simultaneous determination of atenolol, chlorthalidone and amiloride in pharmaceutical preparations by capillary zone electrophoresis with
ultraviolet detection. Biomed
Chromatogr. 2010;24(9):977- 981.
21. Gajewska M, Glass G and Kostelecki J.
Spectrofluorometric analysis of
propranolol and atenolol. Acta Pol Pharm. 1992;49(3):1-4.
22. Ben-Menachem E. Pregabalin
pharmacology and its relevance to clinical practice. Epilepsia. 2004;45:13-18.
23. Blommel ML and Blommel AL.
Pregabalin: an antiepileptic agent useful for neuropathic pain. Am J Health Syst Pharm. 2007;64(14):1475-1482.
24. Martinc B, Grabnar I, Mrhar A and Vovk
T. Rapid high-Performance liquid
chromatography method for
25. Ahmadkhaniha R, Mottaghi S, Zargarpoor M and Souri E. Validated HPLC method for quantification of pregabalin in human plasma using
1-Fluoro-2,4-dinitrobenzene as
derivatization agent. Chromatogr Res Int. 2014;2014(2014):450461-456467.
26. Gujral RS, Haque SKM and Kumar S. A
novel method for the determination of pregabalin in bulk pharmaceutical formulations and human urine samples. Afr J Pharm Pharacol. 2009;3(6):327-334.
27. Prashant P and Tanmay S. Development
and validation of HPLC method for the determination of pregabalin in bulk and in pharmaceutical formulations. Res J Pharm Technol. 2012;5(6):829-833.
28. Priez-Barallon C, Carlier J, Boyer B,
Benslima M, Fanton L, Mazoyer C and Gaillard Y. Quantification of pregabalin using hydrophilic interaction HPLC-high-resolution MS in postmortem human samples: eighteen case reports. J Anal Toxicol. 2014;38(3):143-148.
29. Dousa M, Gibala P and Lemr K. Liquid
chromatographic separation of
pregabalin and its possible impurities
with fluorescence detection after
postcolumn derivatization with o-phtaldialdehyde. J Pharm Biomed Anal . 2010;53(3):717-722.
30. Ashu M, Parmar S, Nagarajan K and
Vijendra S. Development and validation
of rapid HPLC method for
determination of Pregabalin in bulk drug and capsule dosage forms. Der Pharma Chem. 2011;3(1):482-389.
31. Berry D and Millington C. Analysis of
pregabalin at therapeutic
concentrations in human plasma/serum by reversed-phase HPLC. Ther Drug Monit. 2005;27(4):451-456.
32. Balaji J, Ramachandra B and Naidu NVS.
Analytical RP-HPLC method for
development and validation of
pregabalin in bulk and the
determination of pregabalin in capsule dosage form. Int j innov res Sci eng technol. 2014;3(4):11094-11098.
33. Tripathi A, Rathor RPS, Kamble PR and
Vyas G. Reverse phase HPLC method for estimation of acelofenac and pregabalin in combined dossage form. Int J Pharmamedix India. 2014;2(3):764-780.
34. Vermeij TA and Edelbroek PM.
Simultaneous high-performance liquid chromatographic analysis of pregabalin,
gabapentin and vigabatrin in human serum by precolumn derivatization
with o-phtaldialdehyde and
fluorescence detection. J Chromatogr B Analyt Technol Biomed Life Sci. 2004;810(2):297-303.
35. Kavitha MP and Rajasekhar A. A
validated HPLC method for the analysis of pregabalin and methylcobalamin in bulk and pharmaceutical formulation. Pharmacie Globale (IJCP). 2013;7(4):1-4.
36. Bali A and Gaur P. A novel method for
spectrophotometric determination of pregabalin in pure form and in capsules. Chem Cent J. 2011;5:59.
37. Saleh HM, EL-Henawee MM, Ragab GH
and Mohamed OF. Spectrophotometric and spectrofluorimetric determination
of pregabalin via condensation
reactions in pure form and in capsules.
Int J Pharm Chem Biol Sci.
2014;4(3):738-747.
38. Armagan O. Development and
Validation of Selective
Spectrophotometric Methods for the
Determination of Pregabalin in
Pharmaceutical Preparation. Chin J Chem. 2009;27(4):781–786.
39. Gujral RS, Haque SM and Shanker P. A
Sensitive spectrophotometric method for the determination of pregabalin in bulk, pharmaceutical formulations and in human urine samples. Int J Biomed Sci. 2009;5(4):421-427.
40. Navneet K, Karan M, Rishabh N, kunal N
and Arti T. A sensitive
spectrophotometric method for the determination of pregabalin in pure drug and pharmaceutical formulations
through benzoylation. IRJP.
2010;1(1):175-180.
41. Varik S and Walke T.
Spectrophotometric determination of pregabalin from the capsule dosage form based on its micellar catalyzed reaction with sanger’s reagent. Int J Res Pharma Biomed Sci. 2013;4(4):1051-1054.
42. Sowjanya K, Thejaswini JC,
Gurupadayya BM and priya MI. Spectrophotometric determination of pregabalin using
1,2-napthaquinone-4-sulfonic acid sodium and 2,4
dinitrophenyl hydrazine in
pharmaceutical dosage form. Der Pharma Chem. 2011;3(1):112-122.
43. Walash MI, Belal F, Enany N and
spectrofluorimetric method for the determination of pregabalin in capsules
through derivatization with
fluorescamine. Luminescence.
2011;26(5):342–348.
44. Rodríguez J, Castañeda G and Muñoz L.
Direct determination of pregabalin in human urine by nonaqueous
CE-TOF-MS. Electrophoresis.
2013;34(9-10):1429-1436.
45. Mudiam MK, Chauhana A, Jain R, Ch R,
Fatima G, Malhotra E and Murthya RC.
Development, validation and
comparison of two microextraction techniques for the rapid and sensitive determination of pregabalin in urine and pharmaceutical formulations after
ethyl chloroformate derivatization
followed by gas chromatography–mass spectrometric analysis. J Pharm Biomed Anal. 2012;70:310-319.
46. Arezzo JC, Rosenstock J, LaMoreaux L
and Pauer L. Efficacy and safety of pregabalin 600 mg/d for treating painful diabetic peripheral neuropathy:
A double-blind placebo-controlled
trial. BMC Neurol. 2008;8:33-46.
47. http://www.drugs.com/drug
interactions/atenolol-with-lyrica.html
48. Product Information. Lyrica
(pregabalin). Pfizer U.S.
Pharmaceuticals Group, New York, NY.
49. International Conference on
Harmonisation of Technical
Requirements for Registration of
Pharmaceuticals for Human Use, ICH
Harmonised Tripartite