e- ISSN: 2278-067X, p-ISSN: 2278-800X, www.ijerd.com
Volume 14, Issue 10 (October 2018), PP.01-07
Wireless Optical Link for Discharge Warning System
Ferry Satria
1, Sutrisno
2, Asep B Simanjuntak
31) PoliteknikNegeriBandung, Jl.Gegerkalong Hilir Ds.Ciwaruga Bandung 2)
PoliteknikNegeriBandung, Jl.Gegerkalong Hilir Ds.Ciwaruga Bandung
3)
PoliteknikNegeriBandung, Jl.Gegerkalong Hilir Ds.Ciwaruga Bandung Corresponding author: Ferry Satria
ABSTRACT
:
Overflow of water in a dam or reservoir can cause serious problems to the dam it self and people living surounding. When the water level has exceed danger level or above, spilway gates have to discharge excees water to river basin. Sometimes there are many people doing some activities like diging sand, collecting stones and many others in the river. Unfortunately they are not early warned that there will be a discharge of water from the dam or reservoir. This paper reports design and implementation of wireless optical link for discharge warning system. Firstly wireless optical transceiver comprissing optical transmitter and optical receiver must be implemented and meet line of sight condition. Wireless opticlink is a medium to transmit rain fall, water level, temperature and humidity data on real time basis from the dam to a monitoring station. The real time data can also be monitored any time and any where using smart mobile phone as long as internet network exists. This project also used low cost devices available in on line shopping which can be adapted to the system. Based on test and mesurement conducted in almost real situation and environment the result shows that Biterror rate (BER) is 1x10⁻⁹ for the most of the time of measurement so all data from the respective sensors can be delivered to the monitoring station and seen on mobile devices with 99% level of success.KEYWORDS:-river basin, wireless optical , gateways, laser diode, photo diode
--- --- Date of Submission: 27-12-2018 Date of acceptance: 12-01-2019 ---
-I.
INTRODUCTION
High rainfall intensity can have a bad impact, especially in some areas such as in the dam area and river basin that are directly connected to the dam. This can be dangerous to the people living near by the dam or along the river basin if they are not well informed when the dam has to discharge excess water. The water is usually discharged through spillway gates of the dam. As it was the case in Pekalongan, Central Java-Indonesia, the reason for the rain pouring down in Pekalongan Regency and its surroundings occurred throughout the day and made the dam unable to accommodate the water so that it overflowed and resulted flood in several villages [1]. Another case was the Lake Gintung tragedy which took place due to the rainfall of 113.2 mm/day It cause the water level in lake Gintung raised without being known and given opportunity for surrounding residents to save them self, the disaster actually occured nine hours after the rain dropped [2]. Based on these event, discharge warning system is developed to inform when the water has to be spilled out the dam and warn people to be aware early. So this system hopefully can minimize number of victims. Design of discharge warning system basicallyis supported by number of knowledge and skill in some areas of disciplines such like instrumentation for sensors design,ICT technologies for sensor data transmission and optical devices like lasers, photo diode [3]. Rainfall and water level sensors which are located at the dam will collect data regularly by measuring of rainfall intensity and reservoir water level [4]. The measurement data collected will then be processed in based microcontroller data logger unit prior to be transmitted to the monitoring station that is far away enough from where sensor are located . The use of wireless optical is made for the data transmission [5]-6]. The data can also can be accessed via websites in form of easy-to-read tables, graphs and an alarm to the public as well.
II.
BASIC
THEORIES
A. Digital Modulation and Demodulation
modulate its frequency or wave lenght. This kind of modulation is called wavelenght modulation. [7]. Since OOK modulates its amplitude therefore for the purpose of simple explanation, this modulation can be considered as two state modulation technique or binary phase shift keying modulation (BPSK). This digital modulation basically is based on phase shift of carrier in accordance with digital signal transition from low to high state. Fig.1 illustrate how a 180 phase shift can be made to corespond a ―0‖ --- ―1‖ transition.
Fig.1 Illuitrate how a 1800 phase shift of carrier
Two phase shift keying configuration as shown in Fig.I shoul be realized that the transition may occur at any point on the sinusoid. , since there is no a-priori phase relationship between carrier frequency and the clock frequency, except in the special case of coherent modulation, which has certain advantages. In demodulation process there is a problem of phase relation shift, phase respect to what?. When the demodulation is not performed at the same point as the modulation, it is necessary to find a way of recovering the carrier in order to provide phase reference. So when the recovery has been achieved this demodulation process is known as coherent demodulation. Several process may be used, but all consist in using intelligence implicity contained in the signal to be demodulated. This signal actually indicates information frequency and phase of the carrier. This process is known as carrier recovery. So when the phase of carrier signal to be demodulated is precisely adjusted to the phase of carrier signal from local oscillator or in this case , Voltage Control Oscillator (VCO), The phases of the two carriers are said to be locked at certain phase. In other word the VCO is locking to the rate of the intelligence mentioned above therefore the phase of the receiving carrier can be recovered.
B. Error Rate
Digital signal are transmitted via network comprising amplifier that compensate for attenuation due to propagation. And the result the signal at the receiver end is no longer pure and include added noise. In an extreme case, the noise may produce confusion between two binary state. This phenomenon, which appears only from time to time in the succession of large number of symbols representing the data is termed digital error. For approximation It may be considered statically as Gaussian. In order to evaluate the effect of noise to the decision making process It is necessary to define error rate . By definition ‖An error occur if ―0‖ is transmitted and ―1‖ is decided or if ―1‖ is transmitted and ―0‖ is decided. As the approximation is made statically Gaussian. So The result of decision process is refered as the error rate which is the ratio between the average number of errors to the number of decisions made. Because of the presence of noise, a noise voltage x(t) is superimposed on signal s(t). So the overall signal appears in the form of the sum s(t) + x(t). Let it be assumed that the noise distribution is Gaussian and the probability density function p(x) that x lies between x + dx is given by:
𝑃 𝑥 = 1
2𝜋𝜎𝑒
−𝑥 2 2𝜎 2 (1)
where is RMS of noise x(t).
When the noise exceed over the decision level, the probability is obtained as follow ;
𝑃𝑒𝑟𝑟𝑜𝑟 = 𝑝 0 + 𝑝 1 𝑃 𝑥 =
1
2𝜋𝜎 𝑒
−𝑥 2
2𝜎 2. 𝑑𝑥 (2)
∞
𝑎
For the binary code p (0) + p(1) = 1, the following is obtained,
𝑃𝑒𝑟𝑟𝑜𝑟 = 1
2𝜋𝜎 𝑒
−𝑥 2
2𝜎 2. 𝑑𝑥 (3)
which is already tabulated
Finally, the error rate for NRZ digital base band signal can be obtained as;
𝑝𝑒𝑟𝑟𝑜𝑟 =
1
2𝑒𝑟𝑓
𝑎
2𝜎 = 𝐸𝑟𝑟𝑜𝑟 𝑅𝑎𝑡𝑒 = Γ (5)
Where 𝑎
2𝜎 is power to noise ratio.
C. Wireless Optical link budget calculation
Link budget calculation is basically calculating gain and loss and additional loss caused by any atmospheric disturbance. In this design thefree spacew optic link channel is assumed only involve the losses without any atmospheric disturbance. Therefore link channel equation can be given with thesefollowing equations [7]
𝑃 𝑅𝑋 = 𝑃 𝑇𝑋. 𝐺 𝑇𝑋.𝐺 𝑟. 𝐴 𝑆𝑦𝑠𝑡𝑒𝑚𝑙 𝑖𝑛 (7)
According to the equation above the performwnce of the free space optic link just relies on the optical power transmitted (PTX, Gain of transmitting antenna GTX, Gain of receiving antenna (GRX, range loss Gr and system-dependent losses Asystem-lin. The antenna gain GTX can be found from the expression below;
𝐺 𝑇𝑋 =
32
𝜃 2 (8)
Where 𝜃 𝑟𝑎𝑑 is divergent angle of the transmit beam.
While the range loss Gr depends on the link propagation distance L and is given by
𝐺 𝑟 =
ʎ
4𝜋ʎ.𝐿
2 (9)
Futher, the receing antenna gain with telescope aperture diameter a(antenna size) D is given by
𝐺 𝑅𝑋 =
𝜇 .𝐷 ʎ
2 (10)
The system-dependent losses Asystem-lin.is due to losses including loss caused by mis allignment, telescope loss , and loss due to splitting out light for tracking systems. Since atmospheric effects is neglected so the link Margin
𝑀 𝑙𝑖𝑛𝑘 in dB is given by 𝑀 𝑙𝑖𝑛𝑘(dB) = 𝑃 𝑅𝑋(dBm) -𝑆 𝑟. (11)
III.
WIRELESS
OPTICAL
TRANSCEIVERAND DISCHARGE
WARNING
SYSTEM
DESIGN
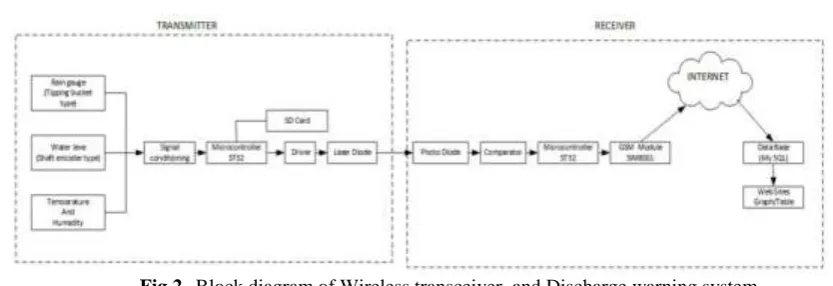
Fig.2.Block diagram of Wireless transceiver and Discharge warning system
A. Discharge Warning System Design
The core device in this system is STM32F103C microcontroller and micro SD card. The whole process of polling, processing, stroring, and sending rainfall, water level, temperature and humadity data are performed by the microcontroller on pre-schedule based time interval. The heart of the microcontroller is microprocessor with 32 bit RISC ARM, namely Cortex M7, Cortex M4F, Cortex M3, Cortex M0+ and Cortex M0 from STMicroelectronic industry. It has high clock frequency about 72 MHz and it is the reason why this microcontroller is chosen for this design. Micro SD card is required to store all data from sensors after being processed in microprocessor. Sensors used for rainfall is typing bucket type sensor. The output is digital pulse with 0,053 inchi of rain or 1,3466 mm of rain per tip while HC SR04 is ultra sonic water level sensor. This sensor works by transmitting electromagnetic wave at frequency 40 Hz and receiving wave which is reflected by an object. This working method is then used to measure the height of water surface of dam lake. Temperatur and humadity of environment is also measured. The value of this parameter is obtained from DHT22 temperature and humadity sensor. Basically this sensor work by making use of polymer capacitor as a sensing element for humadity and temperature messurement. All of data signal are then converted into light by means of modulated using on-off keying method prior to be transmitted to free space as shown in figure 2. Signals from sensors are fed to on-off keying modulator for transmission via laser diode to free space. The modulated light is then received by optical receiver by means of photo diode to recover the original data.
B. Optical Wireless Transceiver Design
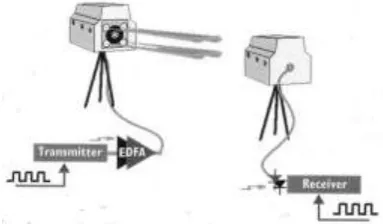
Wireless optical link is demonstrated as in Fig. 3 contains three components namely transmitter, wireless transmitted channel line of sight, and receiver. Transmitter is considered as an optical source -laser diode (LD) or light emitting diode (LED) to transmit of optical radiation through the atmosphere [8].
Source : Author(s). Licensee InTech.
Fig.3. Block diagram of an optical wireless transmitter and receiver
1) Transmitter
The main device of transmitter is a light source. In this design, red dot laser diode module is used as specified in Table 1;
TABLE 1.
applied to comparator circuit as signal conditioning circuit. Microcontroller used for data processing and it is also programmed to store data to database. Data can be viewed in local host data base or hosting to access rainfall, water level data via global internet application in smart phone.
TABLE 2.
Specification of photo diode diode Wavelenght 400 nm to 1100 nm Short switching time 20 ns
Photo diode sensitivity -70 dBm Photo diode aperture diameter 8 mm
3) Free Space Budget link Calculation
Based on Specification of red dot laser diode shown in Table.1. Ones can calculate GTX, GRX, Gr and so on.
using equation (8), 𝐺 𝑇𝑋 = 32
𝜃 2 =
32
0.04 = 800 , in logarithmic form 10 log 800 =29 dB
Using equation (10), 𝐺 𝑅𝑋 = 𝜇 .𝐷
ʎ
2 = 3.14 0.008 650 10−9
2
= 91 dB
While the range loss based on equation (9), 𝐺 𝑟= ʎ
4𝜋.𝐿
2 = 650 𝑥10 −9 4𝜋𝐿
2 ,for distance of 1500 meter,
give range loss 𝐺 𝑟 of 210 dB.
When the light propagate in atmosphere it is affected by some atmopheric factors like clouds, rain, snow, fog, haze, pollution etc. And the transmittance T of laser radiation that has propagate over a distane L is described
by Beer’s Law [, 𝑇 = exp −𝛼 𝑒 ʎ . 𝐿|𝑘𝑚 2 (12)
So Atmospheric transmittance based on absorption analysis using LOWTRAN others like FASCODE , MODTRAN, HITRAN,and zenith path from 0 km to 120 km altitude as well as the midlatitude summer atmospheric model are assumed. [7]. So for given atmospherc transmission window (650 nm), the atmospheric transmittance is obtained about 0.2 dB/km . Since the distance is already known as 1500 m, therefore the losses due to Atmospheric Extinction is obtained to be 0.2 dB/km x 1.5 km = 3 dB.
By equation 7 , 𝑃 𝑅𝑋 = 𝑃 𝑇𝑋. 𝐺 𝑇𝑋. 𝐺 𝑟. 𝐺 𝑅𝑋 .𝐴 𝑆𝑦𝑠𝑡𝑒𝑚𝑙𝑖𝑛. We can calculate how much power received
by the receiver.
𝑃 𝑅𝑋 = 23dBm +29 dB+91dB-210dB-3dB = -70 dBm
IV.
TEST
AND
MEASUREMENT
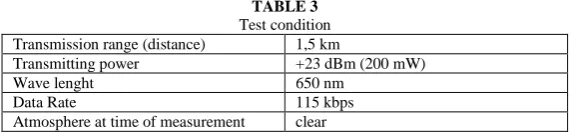
Since wireless optical link relays on line of sight condition. Therefore those laser diode and photo diode devices shall be located on the high place where they are free from any obstruction. This means the units shall be placed above any possible obstrutions like above trees, buildings and so on. Setup diagram for test and measurement is shown in Fig. 4. The test is conducted at the dam or reservoir in order to get as close as to real situation and condition and to obtain line of sight condition of the optical link path goes over the dam water. The test condition is like shown in Table 3.
TABLE 3
Test condition Transmission range (distance) 1,5 km
Transmitting power +23 dBm (200 mW) Wave lenght 650 nm
Data Rate 115 kbps Atmosphere at time of measurement clear
Fig. 4. Setup diagram for test and measurement Source : www.fiberoptictechnology.net
By Larry Desjardin
Based on the receiving power of light which is measured by optical meter at the receiver, ones can calculate error rate of the woreless optical link. Since the expression (5) is for calculating error rate of digital base band signal the expression needs a little bit modification so that it can be used to calculate error rate of modulated signal, The expression to calculate error rate of modulated signal is obtained as;
𝜏 =1 2𝑒𝑟𝑓𝑐
𝐶 𝑁0× 𝐷
(6)
Where : C is the power received signal D is digital rate
No is power noise density
V.
RESULT
AND
ANALISIS
It is necessary to calculate error rate in the present of noise in the receiver. Based on specification of photodiode BPW34, its power noise density is 4x10-14 W/Hz or -134 dBm/Hz bandwidth. Ones can calculate error rate, Γ as a function of received power level of modulated carrier C, data rate, D and power noise density,NO, and Noise Figure of receiver, F. Refering to test condition shown in Table III andusing values of error function complementer,( erfc) which is already tabulated. We can obtain the error rate, Γ as a function of power to noise ratio10 log 𝐶
𝑁𝑜 𝑥 𝐷 using equation (6). Based on the measurement, the power level received at the
receiver is – 67 dBm. With data rate of 155 kbps and power noise density, 𝑁 𝑜 = 𝑘. 𝑇 𝑊
𝐻𝑧 . If noise figure
receiver is assumed to be ideal 0 dB therefore 𝑁 = 𝑘. 𝑇. 𝐹 = -134 dBm + 0 dB = -134 dBm/Hz. And 10 log 𝐷 = 10log155 𝑥103= 52 dB.
Now thepower to noise ratio10 log 𝐶
𝑁𝑜 𝑥 𝐷 can be optained as [(-67 dBm – (-134 dBm +52dB)] = 15B.
Let us confirm this result with the Table 4 that shows the result of error rate calculated for different values of
10 log 𝐶
𝑁𝑜 𝑥 𝐷.
TABLE 4
.Values of Γ as a function of power to noise ratio, 10 log 𝐶
𝑁𝑜𝑥𝐷
10 log 𝐶
𝑁𝑜 𝑥 𝐷 𝜏 =1
2𝑒𝑟𝑓𝑐
𝐶
𝑁0× 𝐷
6,8 dB 1x 10⁻³
8,4dB 1x10⁻⁴
9,6 dB 1x10⁻⁵ 10,5 dB 1x10⁻⁶
measurement, the power to noise ratio 10 log 𝐶
𝑁𝑜 𝑥 𝐷 is obtained 15 dB. Refered to the table, it means the error
rate is less than 1x10⁻¹⁰ or error rate Γ = 0 (no error). It means or no error transmission.
VI.
CONCLUSIONThis research is intended to demonstrate how to measure received power level of optical link within the range of 1,5 km. The power received signal will determine error rate.Comparing with the received power theoritically calculated -70 dBm, measurement result gave about 3 dB less which gives no error transmission. By adjusting the focus of laser beam, the power signal level received can be varied to extend the distance as long as power to noise ratio 10 log 𝐶
𝑁𝑜 𝑥 𝐷still not less than 15 dB.
ACKNOWLEDGMENT
I would like to express my gratitude to Indonesian Ministry of Research, Technology and Higher Education who has funded this research. Hopefully this research can be beneficial to students, lecturers, researchers and practitioners
REFERENCES
[1]. B. Susanto, PekalonganKaliwadas Dam Is Breaking After Rain All Day,TribunJateng,Pekalongan Regency, 2018.
[2]. F. A. Firdausi, The Negligence of Making LakeGintungbroke,March 27, 2018. [Online]. Available: https://tirto.id/kelalaian-yang-membuat-situ-gintung¬jebol-cGJm. [Accessed May 31 2018].
[3]. Krzhizhanovskaya, V.V., G.S. Shirshov, N.B. Melnikova, R.G. Belleman, F.I. Rusadi, B.J. Broekhuijsen, B.P. Gouldby, Flood Early Warning System: Design, Implementation and Computational Modules.Procedia Computer Science 4 (2011): 106–15. https://doi.org/10.1016/j.procs.2011.04.012.
[4]. G. Pegram , S. Van Biljon, and J. M. Jordaan. Hydrological Data Acquisition Systems.Hydraulic Structures, Equipment and Water Data Acquisition System- Hydrological Data Acquisition Systems – Vol II.
[5]. Leitgeb, E., M. Gebhart, U. Birnbacher, S. Sheikh Muhammad, andChChlestil. Applications of Free Space Optics for Broadband Access. In Optical Networks and Technologies, 579–86. IFIP International Federation for Information Processing. Springer, Boston, MA, 2005. doi:10.1007/0-387-23178-1
[6]. Sandalidis, H. G., T. A. Tsiftsis, G. K. Karagiannidis, dan M. Uysal. BER Performance of WIRELESS OPTICAL Links over Strong Atmospheric Turbulence Channels with Pointing Errors. IEEE Communications Letters 12, no. 1 (Januari 2008): 44–46. doi:10.1109/LCOMM.2008.071408.
[7]. Hennes HENNIGER, OtakarWILFERT,AnIntroduction to Free-space Optical Communication, [8]. (Radio engineering, Vol. 19, No. 2, June 2010).
[9]. Alkholidi, AbdulsalamGhalib, danKhaleel Saeed Altowij. Free Space Optical Communications — Theory and Practices, 2014. https://doi.org/10.5772/58884.