Original Research Article.
139 |P a g e Int J Med Res Prof.2018 Jan; 4(1); 139-47. www.ijmrp.com
Perception of Patients About Communication Skills of Physicians at
Al-Iskan PHC Center, Makkah City
Samah Abed Al-Tweirkey
1*, Salwa Mahmoud Bardisi
21*Family Medicine Specialist, Al-awali PHC Center, Ministry of Health, Makkah Al Mokarramah, KSA.
2Family Medicine Consultant, Director of Female Anti-Smoking Committee, Makkah Al Mokarramah, KSA.
ABSTRACT
Background: Good patient-physician communication skills are essential for high quality, effective and safe medical practice. Doctor-patient communication assumes a special status in Saudi Arabia where as a result of mixed ethnicity of the manpower in the health service and the expatriate community, there is a vast diversity of languages, health traditions and beliefs.
Objectives: To estimate the perception among patients attending al-Iskan PHC center about their doctors communications skills and factors affecting it in Makkah Al-Mokarramah city, 2013.
Subjects and Methods: A cross-sectional analytical study was adopted. It included a representative sample of patients attended al -Iskan PHC center in makkah city, KSA throughout September 2013. Self-administered questionnaire designed by the researcher after revising the literature was utilized for data collection. It included four parts; the first part included socio-demographic characteristics of patients. The second part includes details of patient-physician communication. The third part concerned with patient`s satisfaction with physician`s communication during and after the visit (20 questions with 5-likert responses ranged between strongly agree to strongly disagree). The fourth part included questions about the health status of the participants.
Results: The study included 327 patients out of 350 patients recruited for the study giving a response rate of 93.4%. Their age ranged between 13 and 50 (32.3±10.1 years). Males represent 51.1% of them. Overall, 47.1% of the patients were unsatisfied with physician communication. Female patients had higher significant satisfaction with physician communication score compared to male patients (mean rank were 178.69 versus 149.92, p=0.006). Patients who had private houses were less satisfied with physician`s communication compared
to those who had rented houses (mean ranks was 151.49 versus 178.50, p=0.037). Patients were more satisfied with communication with non-Saudi compared to Saudi physicians (mean rank 199.82 versus 139.44, p<0.001). Patients with health problem of short duration (one week) reported higher significant satisfaction score with physician communication compared to those with longer duration of the current health problem (more than one year) (mean rank was 169.56 versus 37.07, p=0.008).
Conclusion: Almost half of patients attended Al-Iskan PHC center in Makkah city were unsatisfied with physician`s communication. Male patients, those living in private houses, those of longer duration of illness, patients seen by Saudi physicians and those visited consultant physicians were less satisfied with physician communication than others.
Keywords: Patient, Physician, Communication, Perception, Skills.
*Correspondence to:
Samah Abed Al-Tweirkey Family Medicine Specialist, Al-awali PHC Center, Ministry of Health,
Makkah Al Mokarramah, Saudi Arabia. Article History:
Received: 26-11-2017, Revised: 20-12-2017, Accepted: 03-01-2018
Access this article online Website:
www.ijmrp.com
Quick Response code
DOI:
10.21276/ijmrp.2018.4.1.028
INTRODUCTION
Good communication skills are essential for high quality, effective and safe medical practice. These skills are used for information gathering, diagnosis, treatment and patient education. Recent research shows that when the doctor uses effective communication skills, both doctor and patient benefit. As a result, medical schools and specialist colleges are emphasizing their
accurately and their patients adjust better psychologically and are more satisfied with their care.5 Doctors with good communication skills have greater job satisfaction and less work stress.5
Problems no longer lie in demonstrating the effectiveness of therapeutic communication skills; rather today’s problems are concerned mainly with how to transfer such skills from training programmes into daily practice.6
The manner in which a physician communicates information to a patient is as important as the information being communicated. Patients who understand their doctors are more likely to acknowledge health problems, understand their treatment options, modify their behavior accordingly, and follow their medication schedules.7,8 In fact, research has shown that effective patient-physician communication can improve a patient's health as quantifiably as many drugs—perhaps providing a partial explanation for the powerful placebo effect seen in clinical trials.9,10
Unfortunately, doctors often fail in tasks used in communicating with patients that good doctors should be able to perform.5 Only half of the complaints and concerns of patients are likely to be elicited.11 Often doctors obtain little information about patients' perceptions of their problems or about the physical, emotional, and social impact of the problems.12 When doctors provide information they do so in an inflexible way and tend to ignore what individual patients wish to know. They pay little attention to checking how well patients have understood what they have been told.10
Less than half of psychological morbidity in patients is recognized.13 Often patients do not adhere to the treatment and advice that the doctor offers and levels of patient satisfaction are variable.11,14
Effective methods of communication skills training are available. The opportunity to practice key skills and receive constructive feedback of performance is essential.5
Until recently, undergraduate or postgraduate training paid little attention to ensuring that doctors acquire the skills necessary to communicate well with patients. Doctors have therefore been reluctant to depart from a strictly medical model, deal with psychosocial issues, and adopt a more negotiating and partnership style.11,12 They have been loath to inquire about the social and emotional impact of patients' problems on the patient and family lest this unleashes distress that they cannot handle. They fear it will increase patients' distress, take up too much time, and threaten their own emotional survival. Consequently, they respond to emotional cues with strategies that block further disclosure.5
This study was done to evaluate the perception among patients attending al-Iskan PHC center about their doctors communications skills in Makkah Al-Mokarramah city as well as to identify factors affecting that perception.
SUBJECTS AND METHODS
This study is a cross- sectional analytical study. It is conducted in Makkah Al-Mukarramah which is is a city in the Hijaz and the capital of Makkah province in Saudi Arabia. In Makkah region there are 10 hospitals and 75 governmental (MOH) primary health care centers, 30 of them in Makkah proper (Makkah city). The specific study area is Al-Iskan PHC center which included several clinics such as: general, chronic diseases, antenatal,
dressing, dietitian, dental, well baby and nocturnal enuresis clinic. Moreover Al-Iskan is recognized as the Training Center for the Joint Program of Family and Community medicine in Makkah Al-Mokkaramah. The patient attending Al-Iskan PHC center throughout the study period constituted the study population. The total number of the patients in al-Iskan PHC center about 2000 males and females in one month. Raosoft Sample size calculator was used to obtain a sample of 323 according to: (margin of error=5%; confidence level=95%, prevalence was considered 50% to obtain maximum sample size). The sample was increased to 350 to compensate of none-response.
Sample size was distributed between male and female sections by proportion. The researcher used systematic sampling technique by taking every 2nd patient coming to the center to recruit the sample size.
Self-administered questionnaire used for assessing patients‟
perception and satisfaction was adopted from the General Practice Assessment Questionnaire (GPAQ) 15, and the Consultation Today Questionnaire.16
It is previously used and proved to be valid and reliable;17 validated by 5 consultants. The Questionnaire included four parts; the first part included socio-demographic characteristics of patients (age, gender, marital status, educational level, residence, occupation and income). The second part includes details of patient-physician communication (number of visits last year, duration of the current visit, phone contact with physician, physician`s nationality and category). The third part concerned with patient`s satisfaction with physician`s communication during and after the visit (20 questions with 5-likert responses ranged between strongly agree to strongly disagree). The total satisfaction score was computed. Thus the score ranged between 20 and 100. Patients whose score was less than the median score (64) was considered as unsatisfied whereas those whose score was median score or more were considered satisfied. The fourth part included questions about the health status of the participants (duration of the current health problem, history of seeking treatment in other places and history of chronic diseases). Little modifications have been made on the questionnaire to suit our study.
Permissions from Makkah Al-Mokarramah joint program of family and community medicine and directorate of health affairs of Holy Capital PHC were obtained before study conduction.
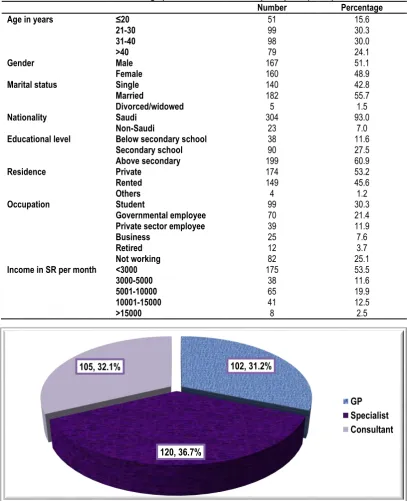
141 |P a g e Int J Med Res Prof.2018 Jan; 4(1); 139-47. www.ijmrp.com Table 1: Socio-demographic characteristics of the participants (n=300)
Number Percentage
Age in years ≤20
21-30 31-40 >40
51 99 98 79
15.6 30.3 30.0 24.1
Gender Male
Female 167 160 51.1 48.9
Marital status Single
Married
Divorced/widowed
140 182 5
42.8 55.7 1.5
Nationality Saudi
Non-Saudi
304 23
93.0 7.0
Educational level Below secondary school
Secondary school Above secondary
38 90 199
11.6 27.5 60.9
Residence Private
Rented Others
174 149 4
53.2 45.6 1.2
Occupation Student
Governmental employee Private sector employee Business
Retired Not working
99 70 39 25 12 82
30.3 21.4 11.9 7.6 3.7 25.1
Income in SR per month <3000
3000-5000 5001-10000 10001-15000 >15000
175 38 65 41 8
53.5 11.6 19.9 12.5 2.5
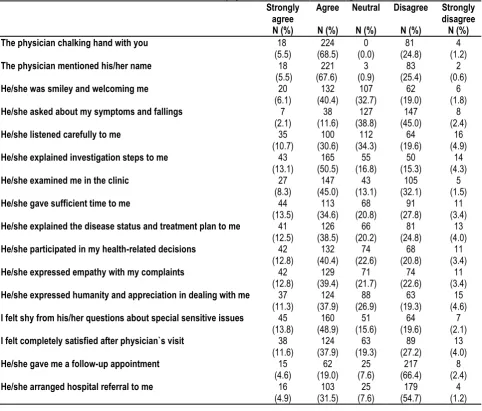
Figure 1: Category of the visited physician
RESULTS
A response rate 93.4% has been achieved as out of 350 patients recruited for the study, 327responded properly by filling in the questionnaire. Table 1 summarizes their socio-demographic characteristics. Their age ranged between 13 and 50 (32.3±10.1 years). Males represent 51.1% of them. More than half of them (55.7%) were married whereas 42.8% were singles. Majority of them (93%) were Saudis. Regarding their educational level, 60.9% were above secondary school educated whereas 11.6% were below secondary school educated. More than half of them (53.2%) had private residence. Almost a third of them (30.3%) were students and 21.4% were governmental employees whereas 25.1% were not working. The monthly income of more than half of them (53.5%) was below 3000 SR whereas it was over 15000 in only 2.5% of them.
Almost two-thirds of the participated patients (67%) visited the health center from three to six times during the last year where as 25.4% of them visited it more than 6 times. Duration of the current physician`s visit ranged between 10 and 15 minutes among 60.9% of the participants while it exceeded 15 minutes in 20.1% of them. Treating physician was Saudi among 59.3% of the participants. Most of the participants (79.8%) did not try to contact their physicians by phone and 18.7% tried and described it as easy. During health center visits, 35.5% of the patients always looked for the same physician, 32.1% preferred to be seen by another physician and 7% always looked for hospital referral. Regarding the category of the visited physician, slightly more than a third of participants (36.7%) visited a specialist whereas less than a third of them either visited general practitioner (31.2%) of consultant (32.1%) as illustrated in figure 1. Among almost a quarter
102, 31.2%
120, 36.7% 105, 32.1%
of physicians (24.5%), the number of waited patients was 15 whereas the number was 10 among almost half of them (49.2%). (Table 2) The duration of the current health status of the participants was one day in 42.8% of the patients while it was one week among 40.4% of them. Chronically ill patients represent
41.6% of the participants, mostly diabetes mellitus (53.7%). Hypertension and bronchial asthma were reported by 28.7% and 17.6% of chronically ill patients, respectively. More than a third of patients (401%) consulted other places seeking for care, mostly governmental facilities (86.3%).
Table 2: Data on patient-physician communication among the participants
Frequency Percentage
Number of visits to the health
center during the last year Not at all 1-2
3-4 5-6 >6 2 23 95 124 83 0.6 7.0 29.1 37.9 25.4 Duration of the current physician`s
visit (minutes) 5-10 10-15
>15 62 199 66 19.0 60.9 20.1
Physician`s nationality Saudi
Non-Saudi
194 133
59.3 40.7 It was easy to contact physician
through the phone Yes No
Didn’t try 61 5 261 18.7 1.5 79.8
During health center visits Always looking for the same physician
Prefer to be seen by another physician No difference regarding physician Always looking for hospital referral
116 105 83 23 35.5 32.1 25.4 7.0
Table 3: Patient`s satisfaction with physician communication during the visit
Strongly disagree N (%) Disagree N (%) Neutral N (%) Agree N (%) Strongly agree N (%) 4 (1.2) 81 (24.8) 0 (0.0) 224 (68.5) 18 (5.5) The physician chalking hand with you
2 (0.6) 83 (25.4) 3 (0.9) 221 (67.6) 18 (5.5) The physician mentioned his/her name
6 (1.8) 62 (19.0) 107 (32.7) 132 (40.4) 20 (6.1) He/she was smiley and welcoming me
8 (2.4) 147 (45.0) 127 (38.8) 38 (11.6) 7 (2.1) He/she asked about my symptoms and fallings
16 (4.9) 64 (19.6) 112 (34.3) 100 (30.6) 35 (10.7) He/she listened carefully to me
14 (4.3) 50 (15.3) 55 (16.8) 165 (50.5) 43 (13.1) He/she explained investigation steps to me
5 (1.5) 105 (32.1) 43 (13.1) 147 (45.0) 27 (8.3) He/she examined me in the clinic
11 (3.4) 91 (27.8) 68 (20.8) 113 (34.6) 44 (13.5) He/she gave sufficient time to me
13 (4.0) 81 (24.8) 66 (20.2) 126 (38.5) 41 (12.5) He/she explained the disease status and treatment plan to me
11 (3.4) 68 (20.8) 74 (22.6) 132 (40.4) 42 (12.8) He/she participated in my health-related decisions
11 (3.4) 74 (22.6) 71 (21.7) 129 (39.4) 42 (12.8) He/she expressed empathy with my complaints
15 (4.6) 63 (19.3) 88 (26.9) 124 (37.9) 37 (11.3) He/she expressed humanity and appreciation in dealing with me
7 (2.1) 64 (19.6) 51 (15.6) 160 (48.9) 45 (13.8) I felt shy from his/her questions about special sensitive issues
13 (4.0) 89 (27.2) 63 (19.3) 124 (37.9) 38 (11.6) I felt completely satisfied after physician`s visit
8 (2.4) 217 (66.4) 25 (7.6) 62 (19.0) 15 (4.6) He/she gave me a follow-up appointment
143 |P a g e Int J Med Res Prof.2018 Jan; 4(1); 139-47. www.ijmrp.com
Table 3 presents the patient`s satisfaction with different elements of physician`s communication during the clinic visit. Most of them strongly agreed or agreed that the physician cheeked hand with them (74%) and mentioned his/her name (73.1%). Almost two-thirds of them strongly agreed or agreed that physicians explained investigation steps to them (63.6%) and felt shy from physician`s questions about special sensitive issues (62.7%). Almost half of them strongly agreed or agreed that the physician explained the disease status and treatment plan to me (51%), expressed empathy with their complaints (52.2%), examined them in the clinic (53.3%), participated in their health-related decisions (53.2%), felt completely satisfied after physician`s visit (49.5%), was smiley and welcoming them (46.5%) and gave sufficient time
to them (48.1%). On the other hand, almost two thirds of the patients either strongly disagreed or disagreed that that physician gave them a follow-up appointment (66.8%) and half of patients either strongly disagreed or disagreed that the physician asked about their symptoms and fallings (47.4%).
After the visit, majority of patients (86.3%) either strongly agreed or agreed to compliant with treatment. Slightly less than half of them (47.7%) decided to change some of their bad health habits after physician`s visit and 43.2% felt that the physician understood their health status clearly whereas only 16.9% decided to change some of their bad health habits. (Table 4)
Overall, 47.1% of the patients were unsatisfied with physician communication as illustrated in figure 2.
Table 4: Patient`s satisfaction with physician communication after the visit
Strongly disagree
N (%) Disagree
N (%) Neutral
N (%) Agree
N (%) Strongly
agree N (%)
1 (0.3) 76
(23.2) 109
(33.3) 115
(35.2) 26
(8.0) I am felling that the physician understood my health status
clearly
1 (0.3) 94
(28.7) 76
(23.2) 144
(44.0) 12
(3.7) I decided to follow his/her instructions
7 (2.1) 223
(68.2) 48
(14.7) 41
(12.5) 8
(2.4) I decided to change some of my bad health habits
4 (1.2) 7
(2.1) 34
(10.4) 186
(56.9) 96
(29.4) I decided to compliant with treatment
Table 5: Association between patient`s demographic characteristics and satisfaction with physician communication. Patient satisfaction with physician
communication score(20-100)
p-value
Median IQR Mean rank
Gender Male (n=167)
Female (n=160)
60 67
51-69 54-71
149.92
178.69 0.006
Marital status Single (n=140)
Married (n=182) Divorced/widowed (n=5)
66 63.5
61
51.25-72 51.75-70 57.5-73.5
169.25 159.46
182.0 0.596
Patient`s nationality Saudi (n=304)
Non-Saudi (n=23)
64 67
51-71 59-69
162.18
188.04 0.206
Educational level Below secondary school (n=38)
Secondary school (n=90) Above secondary (n=199
65 65 61
59-70.25 53.75-73 51-70
176.18 174.56
156.90 0.237
Residence Private (n=174)
Rented (n=149) Others (n=4)
61 66 64
50-70 55-72 56.5-70
151.49 178.50
168.25 0.037
Occupation Student (n=99)
Governmental employee (n=70) Private sector employee (n=39) Business (n=25)
Retired (n=12) Not working (n=82)
65 60 62 56 54 66
53-72 50.70.25
51-73 50.5-67
42-67 56.75-72.75
168.42 152.11 165.13 135.20 121.96
183.21 0.094
Income (SR/month) <3000 (n=175)
3000-5000 (n=38) 5001-10000 (n=65) 10001-15000 (n=41) >15000 (n=8)
66 64.5
60 61 58.5
53-72 52.5-73 51-68.5 52-68.5 48.5-66.25
172.67 170.80 147.85 153.22
Figure 2: Overall patient satisfaction with physician communication.
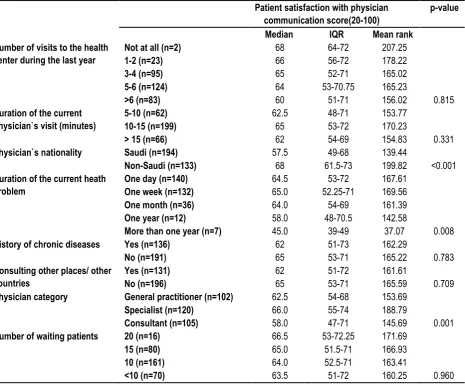
Table 6: Association between visit characteristics and satisfaction with physician communication. Patient satisfaction with physician
communication score(20-100)
p-value
Median IQR Mean rank
Number of visits to the health center during the last year
Not at all (n=2) 1-2 (n=23) 3-4 (n=95) 5-6 (n=124) >6 (n=83)
68 66 65 64 60
64-72 56-72 52-71 53-70.75
51-71
207.25 178.22 165.02 165.23
156.02 0.815 Duration of the current
physician`s visit (minutes)
5-10 (n=62) 10-15 (n=199) > 15 (n=66)
62.5 65 62
48-71 53-72 54-69
153.77 170.23
154.83 0.331
Physician`s nationality Saudi (n=194)
Non-Saudi (n=133)
57.5 68
49-68 61.5-73
139.44
199.82 <0.001 Duration of the current heath
problem
One day (n=140) One week (n=132) One month (n=36) One year (n=12)
More than one year (n=7)
64.5 65.0 64.0 58.0 45.0
53-72 52.25-71
54-69 48-70.5
39-49
167.61 169.56 161.39 142.58
37.07 0.008
History of chronic diseases Yes (n=136)
No (n=191)
62 65
51-73 53-71
162.29
165.22 0.783 Consulting other places/ other
countries
Yes (n=131) No (n=196)
62 65
51-72 53-71
161.61
165.59 0.709
Physician category General practitioner (n=102)
Specialist (n=120) Consultant (n=105)
62.5 66.0 58.0
54-68 55-74 47-71
153.69 188.79
145.69 0.001
Number of waiting patients 20 (n=16)
15 (n=80) 10 (n=161) <10 (n=70)
66.5 65.0 64.0 63.5
53-72.25 51.5-71 52.5-71 51-72
171.69 166.93 163.41
160.25 0.960
Table 5 shows that female patients had higher significant satisfaction with physician communication score compared to male patients (mean rank were 178.69 versus 149.92, p=0.006). Lower educated patients (below secondary school) had higher satisfaction with physician communication score compared to higher educated patients (above secondary school) (mean ranks were 176.18 and 156.90, respectively). However, the difference was statistically insignificant. Patients who had private houses were less satisfied with physician`s communication compared to those who had rented houses (mean ranks was 151.49 versus
178.50). This difference was statistically significant, p= 0.037. The highest patient`s satisfaction with physician communication score was reported among not working patients (mean rank was 183.21) whereas the lowest score was reported by retired patients (mean rank was 121.96). However, the association between patient`s occupation and satisfaction with physician communication was not statistically significant. Patient`s age and income were not significantly associated with satisfaction with physician communication score. It is demonstrated in table 6 that patients were more satisfied with communication with non-Saudi compared
154, 47.1% 173, 52.9%
145 |P a g e Int J Med Res Prof.2018 Jan; 4(1); 139-47. www.ijmrp.com
to Saudi physicians (mean rank 199.82 versus 139.44). This difference was statistically significant, p<0.001. Patients whose current health problem of short duration (one week) reported higher significant satisfaction score with physician communication compared to those with longer duration of the current health problem (more than one year) (mean rank was 169.56 versus 37.07). This difference was statistically significant, p=0.008. Patients who visited specialists reported the highest satisfaction with physician communication score (mean rank was 188.79) whereas those who visited consultants reported the lowest satisfaction with physician communication score (mean rank was 145.69). The difference was statistically significant, p=0.001.
DISCUSSION
The primary care program in the kingdom of Saudi Arabia is a pioneering program in the area that has achieved considerable success within a few years of its establishment.18
Patients` satisfaction is generally considered as the extent to which they feel that their needs and expectations are being met by the service provided. Patients usually express their views through complaint procedures, changing doctors, and by expressing their opinions on the quality of services received.19 In health care, patient satisfaction has long been considered as an important component when measuring health outcomes and quality of care.20,21
This study aimed to evaluate the satisfaction of primary health care patients regarding the communication with the treating physician. The results showed that a considerable percentage of them, approaching their half were unsatisfied with physician`s communication..
Gender difference in satisfaction with physician-communication reported in this study was confirmed in other studies conducted among Omanis22 Iraqi23, Quatari24 and Saudi25 patients. Hansen et al. reported that female patients who were visited by a female provider perceived higher quality.26
Patients with relatively low socio-economic status (manifested in the current study by lower education, less income, not working and having rented houses) were more satisfied with physician communication than those of higher socio-economic status (manifested by higher education, higher income, working and having private houses), although it was significant only with type of housing. This finding could be explained in the light that physicians are more informative with low socio-economic patients, possibly because they assume that these patients are particularly more interested in hearing about their health status and they need more explanation to understand health information about their health status.27,28
In agreement with Zachariae et al,29 our finding revealed that patients with relatively longer duration of illness were less satisfied with physician communication. This could be attributed to the fact that patients with longer duration of the disease often feel that they lack enough information about their disease, which can lead to uncertainty, anxiety and depression and consequently less satisfaction with physician communication.
As regards number of patients waiting for physicians and its impact on patient satisfaction with physician communication, it was found that this factor not significantly related to satisfaction with physician communication. In another study conducted by Salem in Quassim Province, Saudi Arabia,30 he reported that
waiting one hour or more in both urban and rural health centers recorded the lowest satisfaction score (72.11% and 76.88% respectively) with significant difference (P<0.05). Wassem et al, 200331 found that users with actual waiting times exceeded two hours were significantly more likely to be dissatisfied than users with actual waiting time one hour or less. Katezetal (1991)32 confirmed this when mentioned that in general, it can be stated that the longer customers wait for their health care, the less satisfied they will be and the less likely to return to further treatment, but Brown 199333 had another view when mentioned that the extent of the relationship between waiting time and patient satisfaction is unclear where many patient were overestimate the length of their wait, therefore, actual waiting time should be measured and compared rather than the number of waiting patients.
As regards consultation time (time spent with doctor) in primary health care centers and its association with satisfaction, the study showed that almost 60% of the patients had a consultation time ranged between 10 and 15 minutes with physicians and the satisfaction was highest, although not significant with this duration than shorter or longer consultation time. Salem34 reported that patients with longer consultation (one quarter of hour or more) time recorded a significant higher satisfaction score and this was in agreement with Hull et al 200935 who found a clear association between mean consultation time and patient satisfaction. Al Hajeri 200936 concluded that longer consultation time has been linked to a higher satisfaction rate. Nevertheless, each patient requires a different amount of time to receive the appropriate management. Dousari et al, 200837 confirmed this when reported that patients were more satisfied when their physicians allowed more consultation time to express themselves in their own wards during the medical history and when physicians were more informative in the treatment planning part.
Regarding patient` nationality, the study didn't find any difference in satisfaction between Saudi and non-Saudi patients. Al Qatari and Haran 200838 didn't find any difference in satisfaction between Saudi and non-Saudi patients and this was confirmed by Dousari et al, 200837 who showed that Kuwaiti patient`s satisfaction was not influenced by age, gender and nationality of the patients of PHC centers. Salem30 in his study revealed that non-Saudi patients in both urban and rural health centers had significant higher levels of satisfaction and this finding was in agreement with Al Emadi et al 201039 who found that non Qatari patients were more satisfied with PHC services than Qatari patients.
Concerning educational level of patients and its impact on satisfaction with physician communication, the study revealed that less educated patients were more satisfied with physician communication offered in the last visit than patients of higher education, although not statistically significant. Al Qatari and Haran, 200838 found that the less the education level, the more satisfaction but Scott 2004,40 mentioned that studies on educational status showed that educational status may has a positive or negative influence on satisfaction depending on its interaction with other socio-demographic variables.
The study has some important limitations has to be mentioned and discussed. The sample of patients was selected from only one health care facility (Al-Iskan primary health care centers in Makkah Al-Mokarramah city), thus the results cannot be generalized to other health care centers in Makkah Al-Mokarramah city. Another limitation is the time when patients were interviewed. The patients were asked to evaluate only one visit to the physician and this may gives rise to some bias in the results. Finally, the cross-sectional study and the respondent bias do not permit causal inferences about the results. Despite of those limitations, the results of this study can be valuable in understanding the nature of the patient-physician communication in our culture and factors that could enhance it which consequently has a direct positive effect on the quality of care provided.
From the results of this study, we concluded that almost half of patients attended Al-Iskan PHC center in Makkah city were unsatisfied with physician`s communication. Male patients, those living in private houses, those of longer duration of illness, patients seen by Saudi physicians and those visited consultant physicians were less satisfied with physician communication than others. Since the patient-physician communication skills are not wholly formed on graduation from medical school or completion of medical residency and strengthening one’s communication skill set takes time and ongoing practice. A reminder of the most fundamental elements of communication through CME activities may be helpful and lead to more productive patient-physician encounters and better overall clinical outcomes.
REFERENCES
1. The Royal New Zealand College of General Practitioners. Stage 1 General Practice Education Programme Syllabus. 2nd ed. New Zealand. RNZCGP, 2005.
2. Travaline JM, Ruchinskas R, D'AlonzoJr GE. Patient-Physician Communication: Why and How. J Am Osteopath Assoc 2005; 105(1):13-18.
3. Stiefel F, Barth J, Bensing J, Fallowfield L, Jost L, Razavi D.
Communication skills training in oncology: a position paper based on a consensus meeting among European experts in 2009 Ann Oncol 2010; 21 (2): 204-207.
4. Anderson JG, Goodman KW. Ethics and Information Technology: A Case-Based Approach to a Health Care System in Transition, Springer, 2002.
5. Maguire P, Pitceathly C. Key communication skills and how to acquire them. BMJ. 2002; 325(7366): 697–700.
6. Brunett PH, Campbell TL, Cole-Kelly K, Danoff D, Frymier R, Goldstein MG, et al. Essential elements of communication in medical encounters: The Kalamazoo Consensus Statement. Acad Med 2001; 76:390–393.
7. Stewart MA. Effective physician-patient communication and health outcomes: a review. CMAJ. 1995; 15(9):1423-1433. 8. Bull SA, Hu XH, Hunkeler EM, Lee JY, Ming EE, Markson LE, et al. Discontinuation of use and switching of antidepressants: influence of patient-physician communication. JAMA 2002; 288(11):1403-1409.
9. Ciechanowski PS, Katon WJ, Russo JE, Walker EA. The patient-provider relationship: attachment theory and adherence to treatment in diabetes. Am J Psychiatry. 2001; 158(1):29-35. 10. Bogardus ST Jr, Holmboe E, Jekel JF. Perils, pitfalls, and possibilities in talking about medical risk. JAMA. 1999; 281(11):1037-1041.
11. Teutsch C. Patient-doctor communication. Med Clin North Am. 2003;87(5):1115-45.
12. Stewart MA, Roter D, editors. Communicating with medical patients. Newbury Park, CA: Sage Publications; 1989.
13. Mack JW, Cronin A et al. Associations between end-of-life discussion characteristics and care received near death: A prospective cohort study. JCO 2012; 30(35): 4387-4395. 14. Butler C, Rollnick S, Stott N. The practitioner, the patient and the resistance of change: recent ideas and compliance. Can Med Assoc J. 1996; 154:1357–1362.
15. The General Practice Assessment Questionnaire (GPAQ). 2008 [cited 2009 Feb 12]. Available from: National Primary Care Research and Development Centre, University of Manchester and Safran/NEMCH,www.pcc.nhs.uk/uploads/QOF/NW%20Training% 20docs/QPAQ%20Patient%20Survey.pdf
16. Your consultation today questionnaire. 2008 [cited 2009 Feb 12]. Available: University of Bristol, Division of Primary Health Care Web site: http://www.epi.bris.ac.uk/wic/gpattquest.doc 17. Thabit ZK. Assessment of Doctor-Patient Relationship In Primary Health Care Centers, Jeddah 2009. Joint Program of Family and Community Medicine in Jeddah, 2009.
18. Al-Ahmadi H, Roland M. Quality of primary health care in Saudi Arabia: a comprehensive review. International Journal for Quality in Health Care 2005; 17(4):331–346.
19. Ware JE Jr, Davies-Avery A, Stewart AL. The measurement and meaning of patient satisfaction. Health Med Care Serv Rev 1978; 1: 3-15.
20. Kelson M. Consumer involvement initiatives in clinical audit and outcomes: A review of development and issues in the identification of group practice. London (UK): Department of Health Clinical Outcomes Group; 1995.
21. Donabedian A. Evaluating the qulity of medical care. Milbank Q 2005;83:691-729.
22. Albalushi RM, Sohrabi M-R, Kolahi A-A. Clients’ Satisfaction with Primary Health Care in Muscat. Int J Prev Med 2012;3:713-7. 23. AbdSa'adoon A, Hussien AH, Museher TR. Patients' satisfaction for health care services at qar province, Iraq. Thi-Qar Medical Journal (TQMJ) 2008;2(1):39-45.
24. Abd al Kareem A, Aday L, Walker G. Patient satisfaction in Government health facilities in the State of Qatar. J Community Health 1996; 21: 349-58.
25. Al-Doghaither AH, Saeed AA. Consumers' satisfaction with primary health services in the city of Jeddah, Saudi Arabia. Saudi medical journal. 2000 May; 21(5):447-54.
147 |P a g e Int J Med Res Prof.2018 Jan; 4(1); 139-47. www.ijmrp.com
27. Willems S, De Maesschalck S, Deveugele M, Derese A, De Maeseneer J. Socio-economic status of the patient and doctor– patient communication: does it make a difference? Patient Education and Counseling 2005;56:139-146.
28. Street R. Information giving in medical consultations: the influenceof patients communicative styles and personal characteristics. SocSci Med 1991;32:541–8.
29. Zachariae R, Pedersen GG, Jensen AB. Ehrnrooth E, Rossen PB, von der Maase H. Association of perceived physician communication style with patient satisfaction, distress, cancer-related self-efficacy, and perceived control over the disease. British Journal of Cancer 2003; 88: 658- 665.
30. Salem SA. Patient Satisfaction with Primary Health Care Services in Qassim Province, Saudia Arabia. Egyptian Journal of Community Medicine. 2010;28(3)89-108.
31. Wassem M, Eavil L, Gantis. Parental perception of waiting time and its influence on parental satisfaction in an urban pediatric emergency department: are parents be accurate in determining waiting time?. South med. J. 2003: 96 (9): 880-93.
32. Katz K, Larson B, Meng Y. Prescription for waiting in line blues: the quality assurance project. Sloan Management review. 1991; 32 (20): 44-53.
33. Brown L. Quality assurance of health care in developing countries. Bethesda Maryland, the quality assurance project, center for human services. BMJ 1993; 205-207.
34. Razavi D, Merckaert I, Marchal S, Libert Y, Conradt S, Boniver J, et al. How to Optimize Physicians’ Communication Skills in Cancer Care: Results of a Randomized Study Assessing the Usefulness of Posttraining Consolidation Workshops. JCO 2003;2(16):3141-3149.
35. Hull J, Feldstien M, Fretwell M. Older patient's health status and satisfaction with Medical care. J. Med. care.2009;28(3):68-70.
36. AL Hajeri A. Consultation length in primary health care: is it getting longer?, Bahrain Medical J . (2009) 31 (3): 33-41. 37. Dousari H, Al Mutawa A, Al Mithen N. Patient satisfaction according to type of primary health care practitioner in the capital health region, Kuwait. Kuwait Medical Journal 2008; 40 (1): 30-38. 38. AL- Qatari M, Haran D. Determinants of satisfaction with primary health care settings and services among patients visiting primary health care centers in Qateef, Eastern Saudi Arabia. Middle East J. Family Medicin 2008; 6: 12-25.
39. Al- Emadi M, Flamarzi S, Al Kuwarig E. Patient's satisfaction with primary health care in Qatar, Middle East J. Family Med. 2010; 7(9): 202-211.
40. Scott A. Keeping the customer satisfied: issues in the Inter pretention use of patient satisfaction survey. Int. J. for Qual. In health care. 2004; 6(4): 353-359.[
Source of Support: Nil.
Conflict of Interest: None Declared.
Copyright: © the author(s) and publisher. IJMRP is an official publication of Ibn Sina Academy of Medieval Medicine & Sciences, registered in 2001 under Indian Trusts Act, 1882. This is an open access article distributed under the terms of the Creative Commons Attribution Non-commercial License, which permits unrestricted non-commercial use, distribution, and reproduction in any medium, provided the original work is properly cited.