Comparison of Run-off Computed by Strange’s
Table and ‘Dry Damp Wet’ Method
Dr. R. Bhavani Associate Professor Department of Civil Engineering JNTUA College of Engineering, Anantapur
Abstract
Run-off calculations are essential for designing any storage structure. Rrun-off can be calculated based on the rainfall data of rain gauge stations influencing the catchment area. In general, empirical methods are being used to compute the runoff. One of the methods of computing run-off is by Strange’s table. The Strange’s table provides the run-off in terms of percentage of the monsoon rainfall for Good, Average and Bad catchments. One more method is Dry Damp Wet method to compute the run-off. In this method, the condition of the catchment can be considered as Dry, Damp or Wet based on the occurrence of daily rainfall. In the present study, an attempt has been made to compare the runoff obtained by these two methods. The influencing zone of Anantapur rain gauge station, determined by Theissen polygon method has been selected for the present study. Rainfall data of Anantapur rain gauge station for the period from 1982 to 2013 has been used to compute the run-off. Monsoon rainfall of corresponding year has been considered for computation of run-off using Strange’s table and daily rainfall data has been used to compute the run-off as per Dry Damp Wet method. Run-off values obtained by Strange’s table and by Dry Damp Wet method have been compared and found that the values are varying. The variation is due to occurrence of rainfall at varied frequencies. As the frequency of rainfall is also taken in to account in addition to the magnitude of rainfall in Dry Damp Wet method, the values obtained by this method can be considered more precise.
Keywords: Dry Damp Wet method, Monsoon Rainfall, Rain gauge station, Run-off, Strange’s table and Theissen polygon Abbreviations: mm - Milli meters; S. No - Serial number
________________________________________________________________________________________________________
I. INTRODUCTION
The 'run-off' of a catchment area in a particular year (or other specified season) is the volume of water discharged by the stream draining the area. The run-off is stated in terms of the equivalent depth of water over the catchment area. Computation of runoff is the most essential requirement in hydrological aspect of any project. For computing runoff, monsoon rainfall data is the basic requirement which is measured at rain gauge stations in terms of depth. Monsoon rainfall is the rainfall received during monsoon period (considered from May to December). General practice to compute the runoff is using Strange’s table. Another method to compute the runoff is Dry Damp Wet method. In Strange’s table the runoff is given in terms of depth for different catchments like good, average and bad. In Dry Damp Wet method, the catchment is considered as dry, damp and wet based on the occurrence and magnitude of daily rainfall. In the present study, the runoff obtained by these two methods has been compared for a particular rain gauge station.
II. STUDY AREA
Anantapur district is one of the drought affected area in Andhra Pradesh, India which is having an average annual rainfall of 540 mm. There are 63 rain gauge stations in the district located in mandal headquarters. Among these rain gauge stations, Anantapur rain gauge station has been considered. Study area is the influencing zone of Anantapur rain gauge station which is determined by ‘Theissen polygon’ method. An Index map showing the study area i.e. influencing zone of Anantapur rain gauge station is given in figure 1.
III. DATA
Following data has been collected for the present study
1) Daily rain fall data for a period of 32 years from 1982 to 2013 from the Chief Planning Office (CPO) of Anantapur district. 2) Strange’s run-off table for good, average and bad catchments and also run-off table for ‘Dry Damp Wet’ method have been
Fig. 1: Index Map showing the influencing zone of Anantapur rain gauge station
IV. METHODOLOGY
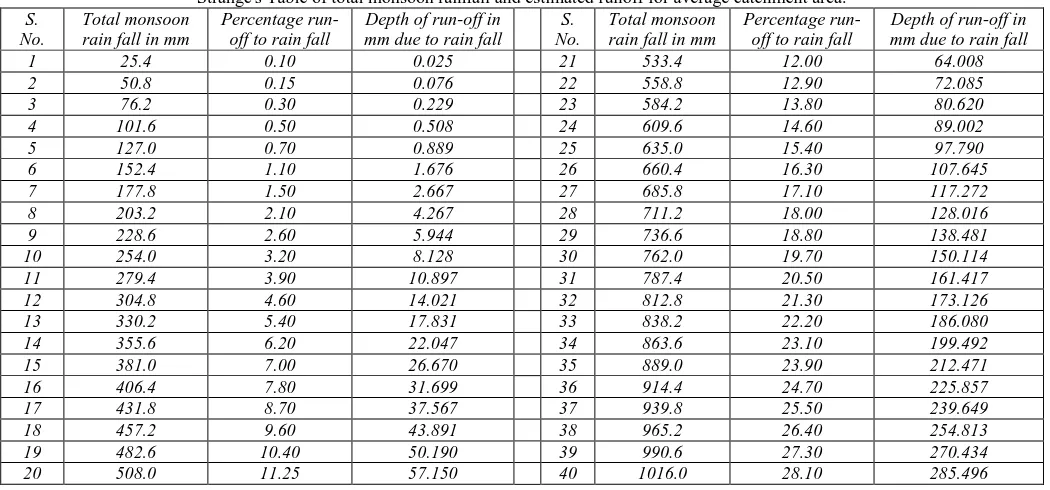
A catchment is a basin shaped area of land from which surface and sub-surface water flows into streams and rivers. In general, the catchment can be considered as Good, when it is in hilly terrain with steep slopes and thick vegetative cover. Similarly, the catchment can be considered as Average, if it is in undulated terrain with moderate slopes and little vegetative cover. Where the catchment area consists of flat terrain with no vegetative cover, it can be considered as Bad. Accordingly study area has been considered as ‘average catchment’ for the purpose of run-off calculations. In general, the run-off will be estimated based on Strange’s table for planning storage reservoirs. The details of estimated run-off for the monsoon rainfall considering the catchment as average has been presented in table 1.
Table – 1
Strange's Table of total monsoon rainfall and estimated runoff for average catchment area. S.
No.
Total monsoon rain fall in mm
Percentage run-off to rain fall
Depth of run-off in mm due to rain fall
S. No.
Total monsoon rain fall in mm
Percentage run-off to rain fall
Depth of run-off in mm due to rain fall
1 25.4 0.10 0.025 21 533.4 12.00 64.008
2 50.8 0.15 0.076 22 558.8 12.90 72.085
3 76.2 0.30 0.229 23 584.2 13.80 80.620
4 101.6 0.50 0.508 24 609.6 14.60 89.002
5 127.0 0.70 0.889 25 635.0 15.40 97.790
6 152.4 1.10 1.676 26 660.4 16.30 107.645
7 177.8 1.50 2.667 27 685.8 17.10 117.272
8 203.2 2.10 4.267 28 711.2 18.00 128.016
9 228.6 2.60 5.944 29 736.6 18.80 138.481
10 254.0 3.20 8.128 30 762.0 19.70 150.114
11 279.4 3.90 10.897 31 787.4 20.50 161.417
12 304.8 4.60 14.021 32 812.8 21.30 173.126
13 330.2 5.40 17.831 33 838.2 22.20 186.080
14 355.6 6.20 22.047 34 863.6 23.10 199.492
15 381.0 7.00 26.670 35 889.0 23.90 212.471
16 406.4 7.80 31.699 36 914.4 24.70 225.857
17 431.8 8.70 37.567 37 939.8 25.50 239.649
18 457.2 9.60 43.891 38 965.2 26.40 254.813
19 482.6 10.40 50.190 39 990.6 27.30 270.434
The Strange’s table has been presented from 25.40 mm to 1016 mm with regular increment of 25.40 mm to cover 1005 mm which is the maximum monsoon rainfall during the study period. Where ever records of daily rainfall covering the entire catchment area are available and the accuracy is important, the daily rainfall can be considered for estimation of run-off using Dry Damp Wet method. The details of run-off estimated from the daily rainfall considering the catchment as average have been presented in table 2.
Table - 2
Estimated run-off from daily rainfall for average catchment as per Dry Damp Wet method
Rain fall in mm
Dry Damp Wet
Percentage Run-off in mm Percentage Run-off in mm Percentage Run-off in mm
0 0 0.00 0 0.00 0 0.00
6.35 0 0.00 0 0.00 8 0.51
12.70 0 0.00 6 0.76 12 1.52
19.05 0 0.00 8 1.52 16 3.05
25.40 3 0.76 11 2.79 18 4.57
31.75 5 1.59 14 4.45 22 6.99
38.10 6 2.29 16 6.10 25 9.53
44.45 8 3.56 19 8.45 30 13.34
50.80 10 5.08 22 11.18 34 17.27
63.50 15 9.53 29 18.42 43 27.31
76.20 20 15.24 37 28.19 55 41.91
101.60 30 30.48 50 50.80 70 71.12
The criteria considered for classifying the catchment area as dry, damp and wet is given in table 3. Table - 3
Criteria considered for classifying the catchment as dry, damp and wet
Conditions required for transition from' dry' to 'damp' Conditions required for transition from' Wet' to 'damp'
Rain fall Rain fall
In Inches In mm In Inches In mm
0.25 6.35 In the previous day 1 Day Damp 0.17 4.32 In the previous day 1 Day Wet and then Damp 0.50 12.7 In the previous day 3 Days Damp 0.25 6.35 In the previous day 2 Days Wet and then Damp 1.00 25.4 In the previous day 7 Days Damp 0.50 12.7 In the previous day 4 Days Wet and then Damp 1.50 38.1 In the previous day 10 Days Damp 0.75 19.05 In the previous day 5 Days Wet and then Damp
Conditions required for transition from 'damp' to 'Wet' Conditions required for transition from 'damp' to 'Dry'
Rain fall Rain fall
In Inches In mm In Inches In mm
0.33 8.38 In the previous day 1 Day Wet 0.13 3.3 In the previous day 1 Day Damp and then Dry 0.50 12.7 In the previous day 2 Days Wet 0.25 6.35 In the previous day 3 Days Damp and then Dry 1.00 25.4 In the previous day 3 Days Wet 0.50 12.7 In the previous day 7 Days Damp and then Dry 1.50 38.1 In the previous day 5 Days Wet 0.75 19.05 In the previous day 10 Days Damp and then Dry If more than 2.50 Inches (63.50 mm) is occurred, upto 2.50
Inches (63.50 mm) is to be considered as dry and remaining as Wet on the same day
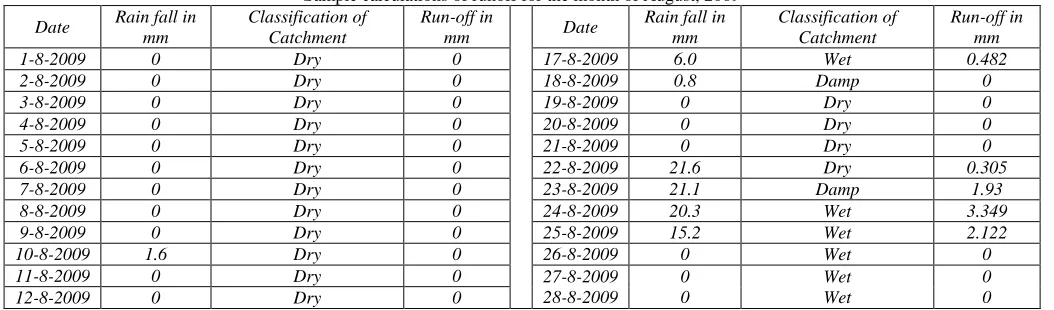
Based on the above criteria classification of the catchment (like dry, damp and wet) has been noted against the rainfall occurred in each day as per daily rainfall data. The runoff has been calculated for the rainfall occurred on the day and with respect to the classification of the catchment on the same day as per tables 2 and 3. Sample calculations showing the classification of catchment and runoff for the respective rainfall for the month of August, 2009 is shown in table 4.
Table – 4
Sample calculations of runoff for the month of August, 2009
Date Rain fall in mm
Classification of Catchment
Run-off in
mm Date
Rain fall in mm
Classification of Catchment
Run-off in mm
1-8-2009 0 Dry 0 17-8-2009 6.0 Wet 0.482
2-8-2009 0 Dry 0 18-8-2009 0.8 Damp 0
3-8-2009 0 Dry 0 19-8-2009 0 Dry 0
4-8-2009 0 Dry 0 20-8-2009 0 Dry 0
5-8-2009 0 Dry 0 21-8-2009 0 Dry 0
6-8-2009 0 Dry 0 22-8-2009 21.6 Dry 0.305
7-8-2009 0 Dry 0 23-8-2009 21.1 Damp 1.93
8-8-2009 0 Dry 0 24-8-2009 20.3 Wet 3.349
9-8-2009 0 Dry 0 25-8-2009 15.2 Wet 2.122
10-8-2009 1.6 Dry 0 26-8-2009 0 Wet 0
11-8-2009 0 Dry 0 27-8-2009
28-8-2009 0 0 Wet Wet 0 0
13-8-2009 0 Dry 0 29-8-2009 0 Wet 0
14-8-2009 0 Dry 0 30-8-2009 0 Damp 0
15-8-2009 6.5 Dry 0 31-8-2009 27.5 Dry 1.011
16-8-2009 11.1 Damp 0.569 Total : 131.7 9.768
Similarly, the run-off has been calculated for a period of 32 years i.e. from 1982 to 2013. The runoff has also been calculated as per Strange’s table using monsoon rainfall for the respective years.
V. RESULTS
Run-off values obtained from Dry Damp Wet method and as per Strange’s table have been presented in table 5. Table – 5
Run-off values obtained from Dry Damp Wet method and as per Strange’s table
S. No. Year
Rain fall in mm
As per Dry Damp Wet method
As per Strange's
table S.
No. Year
Rain fall in
mm
As per Dry Damp Wet method
As per Strange's table Run-off
in mm %
Run-off
in mm %
Run-off in
mm %
Run-off
in mm %
1 1982 552.70 79.177 14.33 70.145 12.69 17 1998 710.60 79.916 11.25 117.272 16.50
2 1983 530.60 40.421 7.62 63.252 11.92 18 1999 598.00 87.372 14.61 85.174 14.24
3 1984 339.40 47.811 14.09 17.831 5.25 19 2000 634.00 81.864 12.91 97.444 15.37
4 1985 280.00 23.725 8.47 10.897 3.89 20 2001 659.80 105.416 15.98 107.412 16.28
5 1986 388.40 39.432 10.15 28.135 7.24 21 2002 317.60 28.849 9.08 15.941 5.02
6 1987 475.30 62.798 13.21 43.891 9.23 22 2003 233.40 19.830 8.50 6.357 2.72
7 1988 746.20 126.252 16.92 142.878 19.15 23 2004 558.80 67.257 12.04 72.085 12.90
8 1989 602.60 185.896 30.85 86.692 14.39 24 2005 616.00 77.421 12.57 91.216 14.81
9 1990 558.80 52.014 9.31 72.085 12.90 25 2006 378.40 21.271 5.62 26.197 6.92
10 1991 472.00 91.231 19.33 43.891 9.30 26 2007 871.80 210.758 24.18 203.682 23.36
11 1992 400.90 21.449 5.35 30.61 7.64 27 2008 605.60 58.629 9.68 87.682 14.48
12 1993 509.90 44.174 8.66 57.663 11.31 28 2009 540.90 55.347 10.23 66.393 12.27
13 1994 274.70 8.204 2.99 10.385 3.78 29 2010 618.20 52.528 8.50 91.977 14.88
14 1995 794.30 195.233 24.58 164.598 20.72 30 2011 602.60 72.128 11.97 86.692 14.39 15 1996 1005.00 227.732 22.66 278.973 27.76 31 2012 588.80 112.962 19.19 82.138 13.95
16 1997 594.60 93.133 15.66 84.052 14.14 32 2013 490.20 69.792 14.24 52.273 10.66
A graph showing the above run-off values in ascending order is presented in figure 2.
Fig. 2: Graph showing run-off values obtained from Dry Damp Wet method and as per Strange’s table
The results obtained by the said methods are applicable for the proposals of any storage structure located within the influencing zone of respective rain gauge station.
REFERENCES
[1] COL. W. M. Ellis, College of Engineering,”Run-off” in Manual for Iirrigation printed by the Superintendent Government Press, Madras 1950.
[2] FAO CORPORATE DOCUMENT REPOSITORY, “Rainfall – runoff analysis” in Water harvesting produced by Natural resources management and Environment Department.
[3] K. Subramanya, Engineering Hydrology, 3rd edition, The McGraw-Hill Publishing Company Ltd, New Delhi, India. [4] P. Jaya Rami Reddy, A textbook of Hydrology, 2nd edition, Laxmi publications (P) LTD, New Delhi.