Vol. 08, Issue 7 (July. 2018), ||V (IV) || 63-79
Analysis Of Effect Of Job Satisfaction And Organizational
Commitment On Performance With Turnover
Intention Moderation
CiciMinarwati
1, Bustanul Arifin Noer
21,2Department of Industry Management, Sepuluh Nopember Institute of Technology, Surabaya, Indonesia
Corresponding Author: Cici Minarwati
Abstract:
Turnover intention can have an impact on employee’s performance decline , while the company’s success is strongly influenced by the performance of its employees . Various ways can be taken to make employee’s performance effective and efficient. Today many companies or agencies use outsourced labor. One of them is the Department of Culture and Tourism of Surabaya City where the outsourced labor here is a Non-Permanent Employees (NPEs) that is individuals who receive contracts employment from the related Regional Governmental Organizations (RGOs) and amount of Non-Permanent Employee (NPEs) in 2017 is 70 % of the total number of employees. The results of survey shown that the rate of turnover of Non-Permanent Employees (NPEs) in the Department of Culture and Tourism of Surabaya reaches 16,3 % or 32 employees in 2017. The turnover rate is so high that the factors which effecting it should be known. Consequently, the turnover intention of employees can be suppressed.To solve the problems, in this research a model of empirical study developed using four variables, namely job satisfaction, organizational commitment, performance , and turnover intention. Four research hypotheses will be formulated from the four variables. This research uses the primary data obtained directly from respondents through the distribution of questionnaires to Non - Permanent Employees (NPEs) of Department of Culture and Tourism Surabaya, with the amount of 150 respondents and PLS- SEM used in the data analysis .
The result of the research shown that the job satisfaction has no significant effect on performance, while organizational commitment has significant effect on performance, and turnover intention moderating variable, also significantly affect job satisfaction and organizational commitment to performance. Suggestions were given to Department of Culture and Tourism of Surabaya in the end of this work in order to further improve its performance.
Keywords:
Non-Permanent Employees (NPEs),Turnover Intention , Job Satisfaction, Organizational Commitment, and Performance.--- --- Date of Submission: 06-07-2018 Date of acceptance: 23-07-2018 ---
---I.
INTRODUCTION
The developing democratization in the life of nation and state and the existence of national commitment to realize good governance, encouraging the government to grant wider authority to the regions. The government provides authority through the implementation of decentralization and regional autonomy. Decentralization and regional autonomy are needed to foster regional initiatives while facilitating regional aspirations in accordance with the diversity of conditions of each region. In the Implementation of regional autonomy contained three main mission that is to create efficiency and effectiveness of management of local resources, to improve the quality of public services and community welfare, and to empower and create space for the community to participate in the development process (Mardiasmo, 2002). In line with the main mission to implement regional autonomy, and in order to stay integrated and controlled in supporting the programs and achievements of the central government, the decrease of basic tasks and functions until the level of Local Government was imposed.
To maximize the services provided to the community, the Surabaya City Government conducted recruitment of manpower to assist the task or workload of Civil Servants (CSs). The Human Resources and Training Agency is responsible for the managerial of all employment in the Surabaya City Government, the recruitment process was handed over to the respective Regional Governmental Organizations (RGOs). In 2017, the number of civil servants known is 83 people 30% of total, consisting of the officials of Head of Department, Secretary Department, Head of Tourism Promotion, Head of Culture, Head of Tourism Industry, Head of Tourism Destination, Head of Local Technical Executive Unit (LTEU) Kenjeran Beach Amusement Park, Kalimas Water Tour, and Ampel Religious Tourism, Head of LTEU Tugu Pahlawan, Museum of Hall of Youth, and People's Amusement Park, and staffs in each Unit, while the number of Non-Permanent Employees (NPEs) are 196 people dominating by 70% of total Employees.
Job satisfaction is a person's feelings about their work or general behavior and employee attitudes toward their work and related to how employees see, think, and feel on their work. Based on the results of initial observations made by researchers, the level of job satisfaction of Non-Permanent Employees (NPEs) in the Office of Culture and Tourism Surabaya tend to be low or not satisfied due to several factors including the lack of assistance received from working colleagues because each individual will only focus on their own workload binded by their own Work Orders (WOs) respectively, the lack of positive support from the direct superior, the salary that is not in accordance with the workload given, and not allowed to change their status to be that of Civil Servants as listed in the Work Orders (WOs).
Organizational commitment is a collection of emotional feelings and beliefs of employees to the environment where they work. The level of organizational commitment of Non-Permanent Employee (NPEs) in the Office of Culture and Tourism of Surabaya City tends to be low due to the absence of associations that protect them (NPEs) specifically in Surabaya City Government. The low level of organizational commitment can lead to unfavorable potential that affects employees’ discipline and loyalty include the attitude of too much unimportant chatting while working, the task is completed tend to be last minute after being asked by the boss, still high number of delay and absence of NPEs although subjecting to salary cutting sanctions.
Turnover intention is the desire or action to resign from the organization/agency. The turnover intention rate of Non-Permanent Employees (NPEs) in the Office of Culture and Tourism of Surabaya City tends to be quite high, reaching 16.3% during the Year 2017.
Performance is the result of the quality and quantity of work achieved by the employee in performing its functions in accordance with the responsibilities given. Non-Permanent Employees (NPEs) Performance level in Surabaya Culture and Tourism Department is still good. This can be known from the early record in 2017 nobody was discontinued or dismissed dishonorably because of unfavorable work or disciplinary issues. It should be considered by the Sub Division General and Personnel in order to improve the performance of Non - Permanent Employees (NPEs). However, the obstacle is that there is no integrated and quantitative assessment system for Non-Permanent Employees’ performance in Surabaya City Government because the appraisal of superiors to subordinates so far is only subjective and qualitative.
II.
METHODS
Research framework
The research framework is the framework used to conduct research. The framework examines the methods used during the research. The steps of this research are problems identification by comparing gap between ideal condition and reality, and from that comparation we determine the purpose of this research, then data collection, analysis, and formulation of conclusions. This study is using primary data resources that collected directly from the related targets.
1. Problem Identifications 2. Research Modeling 3. Sampling
4. Questionnaire Distribution 5. Collecting Data
6. Data Anlysis and Discussion a. Technical Aspects
- Validity and Reliability Tests
- Data Processing using PLS-SEM b. Managerial Aspects
Identification of problems
The preliminary survey results shown that the number of Non-Permanent Employees (NPEs) in 2017 in the Department of Culture and Tourism of Surabaya City is 70% of the total number of existing employees with turnover rate reached 16.3%. The Non-Permanent Employees (NPEs) have the strategic role and workload of the in each Unit.Therefore, job satisfaction and organizational commitment of Non-Permanent Employees (NPEs) need to be investigated because it can influence their performance and the agency’s performance as a whole.
Research model
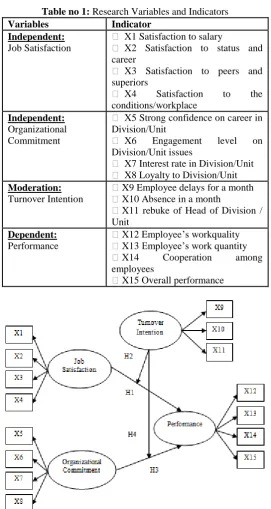
In this study will be sought the relationship of independent variables with a moderating variable on the dependent variable as well as indicators that influence it. Furthermore, these variables are translated into research indicators presented in Table no 1 and the research model in Figure no 1.
Table no 1: Research Variables and Indicators
Variables Indicator Independent:
Job Satisfaction
X1 Satisfaction to salary
X2 Satisfaction to status and career
X3 Satisfaction to peers and superiors
X4 Satisfaction to the conditions/workplace
Independent:
Organizational Commitment
X5 Strong confidence on career in Division/Unit
X6 Engagement level on Division/Unit issues
X7 Interest rate in Division/Unit X8 Loyalty to Division/Unit
Moderation:
Turnover Intention
X9 Employee delays for a month X10 Absence in a month
X11 rebuke of Head of Division / Unit
Dependent:
Performance
X12 Employee’s workquality X13 Employee’s work quantity X14 Cooperation among employees
X15 Overall performance
The proposed theoretical framework includes job satisfaction variables, organizational commitment, turnover intention and employees’ performance. Theoretical thinking framework taken based on the results of literature study and previous research. Based on the theoretical framework, the rational hypothesis proposed in this study are:
H1: Job satisfaction has a positive effect on the performance
H2:Turnover Intention as a moderating variable weakens the effect of job satisfaction on the performance H3: Organizational commitment has a positive effect on the performance
H4: Turnover Intention as a moderating variable weaken the influence of organizational commitment on the performance
Sampling technique
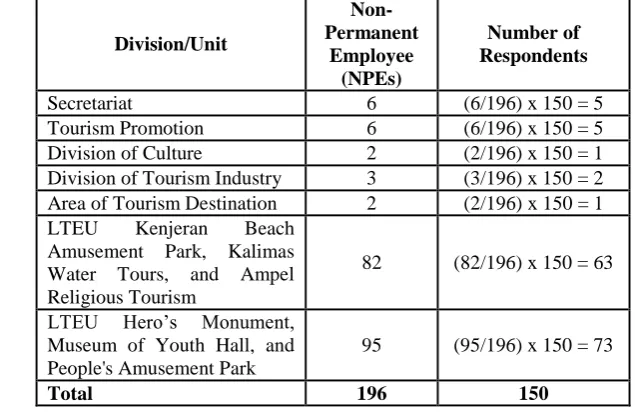
The sample is part of the population to be studied, viewed as an estimation to the population, but not the population itself. Samples are considered representative of the population whose results represent the overall symptoms observed. Determination of the number of samples for the Structural Equation Modeling (SEM) analysis is using the formula of sample size = number of indicators multiplied by 5 to 10 (Ferdinand, 2005). This study used 15 indicators, based on that, we take 150 respondents from 196 Persons Non-Permanent Employees (NPEs). The sampling technique used was Stratified Random Sampling with a proportional sampling approach so that the employees of each Division or Unit are represented. The calculation result of sample requirement of Non Permanent Employees (NPEs) at Culture and Tourism Office of Surabaya City can be seen in Table no 2.
Table no 2: Number of Sample Needs Calculations Department of Culture and Tourism of Surabaya City
Division/Unit
Non-Permanent
Employee (NPEs)
Number of Respondents
Secretariat 6 (6/196) x 150 = 5 Tourism Promotion 6 (6/196) x 150 = 5 Division of Culture 2 (2/196) x 150 = 1 Division of Tourism Industry 3 (3/196) x 150 = 2 Area of Tourism Destination 2 (2/196) x 150 = 1 LTEU Kenjeran Beach
Amusement Park, Kalimas Water Tours, and Ampel Religious Tourism
82 (82/196) x 150 = 63
LTEU Hero’s Monument, Museum of Youth Hall, and People's Amusement Park
95 (95/196) x 150 = 73
Total 196 150
Research instruments
In this research, the measurement of the sample was done using Likert scale, that included an attitude measurement by stating the approval or disapproval of a certain subject or object. The questionnaire used as research instrument used to collect data from the respondents. It contains questions about each variable. The question indicator is derived from some previous research that is considered to be in accordance with the variables tested. The list of questions in this study is closed that is the respondents answer the questions by referring to the context provided. Likert measurement scale using the criteria selection in Table no 3.
Table no 3: Likert Measurement Scale
Value
Measurement
Scale Information
Criteria Code
5 Strongly Agree SA
Respondents strongly agree to the statement because it is very appropriate to the circumstances experienced
4 Agree A Respondents agreed to the statement because it was suitable with the circumstances experienced
Value
Measurement
Scale Information
Criteria Code
circumstances experienced
2 Disagree D Respondents disagreed on the statement because it was unsuitable with the circumstances experienced
1 Strongly Disagree SD
Respondents strongly disagree on the statement because it very unsuitable to the circumstances experienced
Data collection technique
Data collection techniques in this study were conducted using questionnaires. The distribution of questionnaires is done by personal administrated questionnaires, where the researchers directly deal with the respondents and provide the necessary explanation to the respondents.
Sample testing technique Validity test
An instrument has a high validity when capable of performing its measuring function or providing a measuring result that corresponds to the purpose of the measurement. Measurement of construct validity by partial least square software can use two ways, namely convergent validity and discriminant validity. Measurement of convergent validity by considering the loading factor of each indicator, if there is factor loading value with average variance extracted (AVE) value greater than 0.5 (α> 0.5) then the indicator is valid. While the measurement disciminant validity is done by comparing the square root of average variance extracted ( AVE) value for each construct with the correlation between other constructs in the model. The model has sufficient discriminant validity if the AVE root value for each construct is greater than the correlation value between the constructs.
Reliabilitytest
Reliability refers to the internal consistency and stability of the value of a particular measurement scale. Reliability concentrates on the problem of accuracy of measurement and its results. The measurement of construct reliability using partial least square software is done by considering on the composite reliability output value of each construct. If the output value is greater than 0.7 (α> 0.7), then the construct is declared reliable.
Data analysis technique
This research uses Structural Equation Modeling (SEM) method and analysis tool used is Smart PLS software . PLS is an analysis tool that allows researchers to get the value of latent variables for prediction purposes. Partial Least Square (PLS) is a powerful analytical method because it is not based on many assumptions. PLS can also be used to confirm the theory, and to explain the existence or non-existence of relationships among latent variables. Because of moreemphasis on data and the limited estimation procedures, the model specification does not significantly affect the parameter estimation. The strong point of PLS is able to estimate large and complex models with hundreds of latent variables and thousands of indicators. For predictive purposes, the PLS approach is more suitable. The steps in PLS-SEM analysis are as follows;
a. Designing Model Measurement (Outer Model)
In SEM all measurement indicators are reflective, whereas in PLS measurement indicators can be reflective or formative. The determination of the basis of this measurement affects the construct validity test. The formation of a measurement model can be based on the previous theory of empirical studies, as well as the rational thinking logic.
b. Designing Structural Models (Inner Model)
In the PLS the design of other models can be sourced from: 1. Theory
2. Empirical research results
3. Analogy, the relationship between variables in other fields of science 4. Normative sources, for example in other fields of science
5. The logic of other rational thinking
One of the advantages of PLS is that it can be used to explore the relationship between variables. c. Coefficient, path, loading, and weight Estimation
2. Path estimate (path coefficient) connects between latent variables 3. Loading connect between latent variables with indicator
4. The estimation method used in the PLS is the ordinary least square by means of iteration d. Goodnes of fit appraisal
he assessment of goodnes of fit criteria in PLS is based on an assessment of outer model and inner model. The Outer model tests the feasibility of formed constructs (relationships between latent variables and indicators) using discriminant validity, convergent validity, and composite reliability. Inner model eligibility was measured using Q-square predictive method with the formula:
𝑄2= 1 − 1 − 𝑅12 1 − 𝑅22 … (1 − 𝑅𝑝2)
Where: R 1
2
, R 2 2
... R p 2
= R square of the endogenous variable in the model
The interpretation of Q 2 equals the total coefficient of determination in path analysis (similar to R2 in regression)
e. Hypothesis testing
Hypothesis testing research done by looking at the T-value of statistics of the inner model that has been formed. If the T-Value of statistics ≥ 1.96 then the relationship between latent variables is significant at α = 5%
FGD ( Focus Group Discussion)
After doing data analysis phase using PLS-SEM, then we got the results of analysis of factors affecting performance. To provide solutions or problem solving for the performance of NonPermanent Employees (NPEs) in the Department of Culture and Tourism of Surabaya City, the FGD process was conducted together with the General and Personnel Sub-Section based on the results of research. The stages of problem solving and discussion through FGD methods are:
1. Designing FGD questions
2. Prepare a total of 5-10 representation of competent staffs 3. Implement FGD
4. Analyzing FGD results data
Managerial implications
The results from the research and Forum Group Discussion (FGD) will be analyzed as a whole to produce a recommendation for the Sub Division of General and Civil Service Department of Culture and Tourism of Surabaya. This recommendation is expected to have a positive impact on the sustainability of one of the Regional Governmental Organizations of Surabaya. The recommendations will be explained in later part of this work and related to the research results, and hopefully it will have some impacts, that are:
1. The Increase in job satisfaction
2. The Increase in organizational commitment 3. The Improvement of performance
4. The Decrease in turnover intention
III.
RESULT
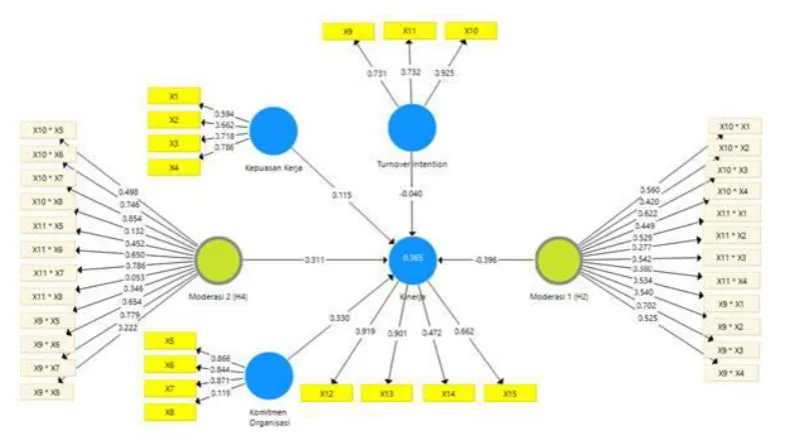
Evaluation result of measurement model (outer model)Figure no 2: Diagram Results of PLS-SEM Data Stage 1
Based on the results of the data of PLS-SEM Phase 1, it is found that there are still not yet valid indicators that is X8 (independent variable) and X14 (dependent variable) with loading factor value smaller than 0.5 by 0.119 and 0.472. Indicators with small loading factor indicate a small contribution so that the indicator needs to be eliminated and re-done. Meanwhile, if the value of loading factor in moderation 1 and 2 smaller than 0.5 it can be ignored because the value is result of multiplication of the research indicator, so that it is eliminated or not depends on the valid value of the main influencing indicator.
Table no 4: Value of Outer Loading PLS-SEM Data Stage 1
Job Satisfaction
Organizational Commitment
Turnover
Intention Performance
Moderation 1 (H2)
Moderation 2 (H4) X1 0.594
X2 0.662
X3 0.718
X4 0.786
X5 0.866
X6 0.844
X7 0.871
X8 0.119
X9 0.731
X10 0.925
X11 0.732
X12 0.919
X13 0.901
X14 0.472
X15 0.662
X1 * X9 0.534
X1 * X10 0.560
X1 * X11 0.529
X2 * X9 0.540
X2 * X10 0.420
X2 * X11 0.277
X3 * X9 0.702
X3 * X10 0.622
X3 * X11 0.542
Job Satisfaction
Organizational Commitment
Turnover
Intention Performance
Moderation 1 (H2)
Moderation 2 (H4)
X4 * X10 0.449
X4 * X11 0.380
X5 * X9 0.346
X5 * X10 .498
X5 * X11 0.452
X6 * X9 0.654
X6 * X10 0.746
X6 * X11 0.650
X7 * X9 0.779
X7 * X10 0.854
X7 * X11 0.786
X8 * X9 0.222
X8 * X10 0.132
X8 * X11 0.053
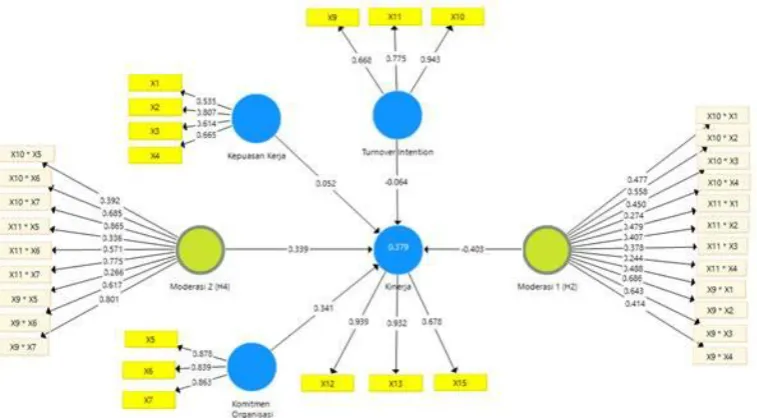
Then the phase 2 with PLS-SEM got result in Figure no 3 and Table no 5.Based on the results of the data PLS-SEM Stage 2, it was found that all indicators have been valid or already meet the value of loading factor > 0.5.
Figure no 3: Diagram Results of PLS-SEM Data Stage 2
Table no 5: Value of Outer Loading PLS-SEM Data Stage 2
Job Satisfaction
Organizational Commitment
Turnover
Intention Performance
Moderation 1 (H2)
Moderation 2 (H4) X1 0.535
X2 0.807
X3 0.614
X4 0.665
X5 0.878
X6 0.839
X7 0.863
X9 0.668
X10 0.943
X11 0.775
Job Satisfaction
Organizational Commitment
Turnover
Intention Performance
Moderation 1 (H2)
Moderation 2 (H4)
X13 0.932
X15 0.678
X1 * X9 0.488
X1 * X10 0.477
X1 * X11 0.479
X2 * X9 0.686
X2 * X10 0.558
X2 * X11 0.407
X3 * X9 0.643
X3 * X10 0.450
X3 * X11 0.378
X4 * X9 0.414
X4 * X10 0.274
X4 * X11 0.244
X5 * X9 0.266
X5 * X10 0.392
X5 * X11 0.336
X6 * X9 0.571
X6 * X10 0.685
X6 * X11 0.571
X7 * X9 0.801
X7 * X10 0.865
X7 * X11 0.775
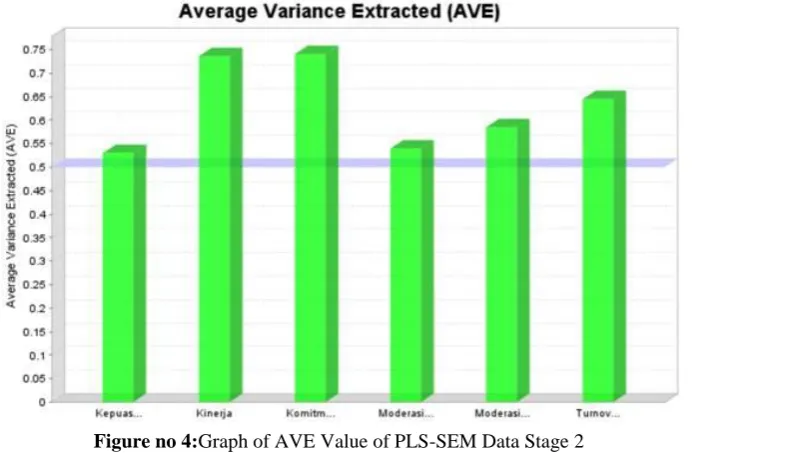
Variable validity can also be assessed by looking at the AVE value (Average Variance Extracted) where the AVE value is able to show the ability of the latent variable value in representing the original data score. Cut-off value of AVE used is 0.50. The following are AVE values resulting from PLS-SEM data processing stage 2:
Table no 6:Value of AVE Data Sports PLS-SEM Stage 2
Average Variance Extracted (AVE) Job
Satisfaction 0.539 Performance 0.736
Organizational
Commitment 0.740 Moderation 1
(H2) 0.525
Moderation 2
(H4) 0.613
Turnover
Intention 0.645
Based on the above results, it is seen that if the data PLS-SEM in phase 2 test yields AVE value which can be assessed good considered from each variable because it has fulfilled the requirement with value more than 0.5. This shows that latent variables can account for more than 50% of the indicator variant. So from Figure no 4, Table no 5, and Table no 6 it can be concluded that all indicators and constructs in the model have met the criteria of the convergent validity test.
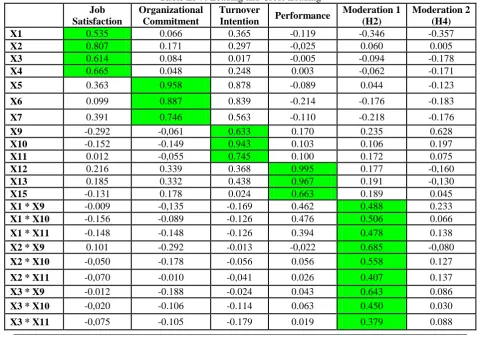
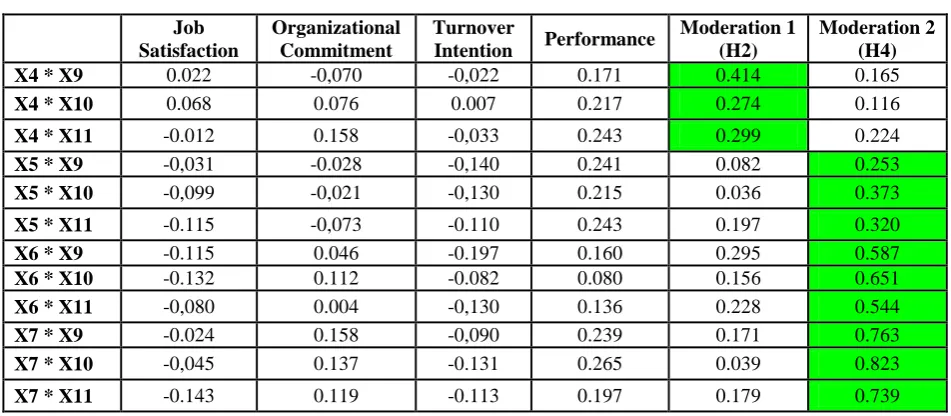
The discriminant validity test is then performed , to test whether the indicators of a construct are not highly correlated with indicators of other constructs. Discriminant validity of the measurement model with reflective indicators is judged on the basis of cross loading measurements with constructs. If the construct correlation with the measurement item is greater than the size of the other construct, then it shows the latent construct predict the size of the block better than the others. The results of loading and cross loading values from the results of PLS-SEM stage 2 data can be seen in Table no 7.
Table no 7: Loading and Cross Loading
Job Satisfaction
Organizational Commitment
Turnover
Intention Performance
Moderation 1 (H2)
Moderation 2 (H4) X1 0.535 0.066 0.365 -0.119 -0.346 -0.357
X2 0.807 0.171 0.297 -0,025 0.060 0.005
X3 0.614 0.084 0.017 -0.005 -0.094 -0.178
X4 0.665 0.048 0.248 0.003 -0,062 -0.171
X5 0.363 0.958 0.878 -0.089 0.044 -0.123
X6 0.099 0.887 0.839 -0.214 -0.176 -0.183
X7 0.391 0.746 0.563 -0.110 -0.218 -0.176
X9 -0.292 -0,061 0.633 0.170 0.235 0.628
X10 -0.152 -0.149 0.943 0.103 0.106 0.197
X11 0.012 -0,055 0.745 0.100 0.172 0.075
X12 0.216 0.339 0.368 0.995 0.177 -0,160
X13 0.185 0.332 0.438 0.967 0.191 -0,130
X15 -0.131 0.178 0.024 0.663 0.189 0.045
X1 * X9 -0.009 -0,135 -0.169 0.462 0.488 0.233
X1 * X10 -0.156 -0.089 -0.126 0.476 0.506 0.066
X1 * X11 -0.148 -0.148 -0.126 0.394 0.478 0.138
X2 * X9 0.101 -0.292 -0.013 -0,022 0.685 -0,080
X2 * X10 -0,050 -0.178 -0.056 0.056 0.558 0.127
X2 * X11 -0,070 -0.010 -0,041 0.026 0.407 0.137
X3 * X9 -0.012 -0.188 -0.024 0.043 0.643 0.086
X3 * X10 -0,020 -0.106 -0.114 0.063 0.450 0.030
Job Satisfaction
Organizational Commitment
Turnover
Intention Performance
Moderation 1 (H2)
Moderation 2 (H4)
X4 * X9 0.022 -0,070 -0,022 0.171 0.414 0.165
X4 * X10 0.068 0.076 0.007 0.217 0.274 0.116
X4 * X11 -0.012 0.158 -0,033 0.243 0.299 0.224
X5 * X9 -0,031 -0.028 -0,140 0.241 0.082 0.253
X5 * X10 -0,099 -0,021 -0,130 0.215 0.036 0.373
X5 * X11 -0.115 -0,073 -0.110 0.243 0.197 0.320
X6 * X9 -0.115 0.046 -0.197 0.160 0.295 0.587
X6 * X10 -0.132 0.112 -0.082 0.080 0.156 0.651
X6 * X11 -0,080 0.004 -0,130 0.136 0.228 0.544
X7 * X9 -0.024 0.158 -0,090 0.239 0.171 0.763
X7 * X10 -0,045 0.137 -0.131 0.265 0.039 0.823
X7 * X11 -0.143 0.119 -0.113 0.197 0.179 0.739
An indicator can also be declared valid if it has a higher loading factor than its cross-loading value . From Table no 7 shows that the correlation of variables of all grades cross-loading having a greater value than their cross loading .Another method of finding discriminant validity is to compare the square root values of AVE ( √AVE) . The model has sufficient discriminant validity value if the AVE root for each variable is greater than the correlation between the variables and other variables as seen in Table no 8.
Table no 8: Value Discriminant Validity
Job
Satisfaction Performance
Organizational Commitment
Moderation 1 (H2)
Moderation 2 (H4)
Turnover Intention Job
satisfaction 0.734
Performance 0.168 0.858
Organizational
Commitment 0.344 0.387 0.860
Moderation 1
(H2) -0,048 -0,388 -0.154 0.724 Moderation 2
(H4) -0.091 0.206 -0.129 0.223 0.783 Turnover
Intention -0.179 -0,130 -0.184 0.140 0.177 0.803
Table no 8 above shows that all AVE root values of each variable are greater than the correlation between variables and other variables. So from Table no 7 and Table no 8 it can be concluded that all variables in the estimated model have met the criteria of discriminant validity test.
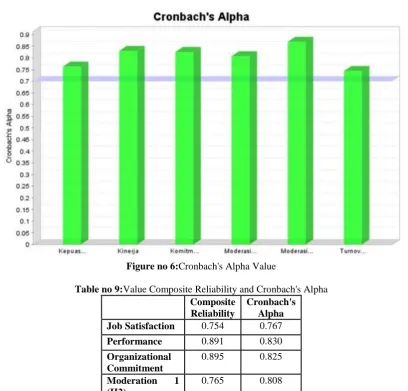
Figure no 5:Composite Reliability Value
Figure no 6:Cronbach's Alpha Value
Table no 9:Value Composite Reliability and Cronbach's Alpha
Composite Reliability
Cronbach's Alpha Job Satisfaction 0.754 0.767
Performance 0.891 0.830
Organizational Commitment
0.895 0.825
Moderation 1 (H2)
Composite Reliability
Cronbach's Alpha Moderation 2
(H4)
0.814 0.869
Turnover Intention
0.842 0.744
From Figure no 5, Figure no 6, and Table no 9 it can be seen that the research model is considered reliable because the value of composite reliability and cronbach's alpha of all variables have been above 0.7. Thus, it can be concluded that the four variables have reliable reliability because it meets the criteria of composite reliability test.
Evaluation result of structural model (inner model)
The next step to evaluate R 2, which aims to find out how much the magnitude of endogenous variables that can be explained by exogenous variables . From the results of PLS-SEM data processing stage 2 the R2 values obtained is the value of R2 obtained from the performance of 0.379. Based on these results, the indication is that the performance constructs can be explained by job satisfaction variable, organizational commitment, and turnover intention with the magnitude of 0.379 or 37.9%, while the remaining 62.1% is explained by other variables outside the research model.
Hypothesis testing
In the evaluation phase the structural model will be analyzed by looking at the significance of the relationship between constructs shown by the T value of statistic. The amount of influence between constructs and interaction effects (moderation) is measured by the value of the coefficient path ( path coefficient ). A path coefficient that has a T Statistic ≥ 1.96 or has P-Value ≤ 0.05 is considered significant.There are 4 (four) hypotheses that will be answered in this research and from result of hypothesis test are;
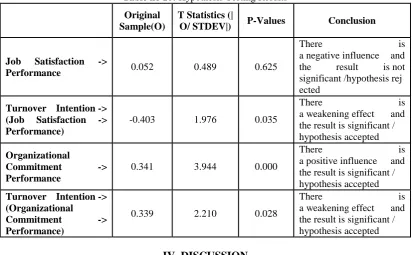
Table no 10: Hypothesis Testing Results
Original Sample(O)
T Statistics (|
O/ STDEV|) P-Values Conclusion
Job Satisfaction ->
Performance 0.052 0.489 0.625
There is a negative influence and the result is not significant /hypothesis rej ected
Turnover Intention -> (Job Satisfaction -> Performance)
-0.403 1.976 0.035
There is a weakening effect and the result is significant / hypothesis accepted
Organizational
Commitment -> Performance
0.341 3.944 0.000
There is a positive influence and the result is significant / hypothesis accepted
Turnover Intention -> (Organizational
Commitment -> Performance)
0.339 2.210 0.028
There is a weakening effect and the result is significant / hypothesis accepted
IV.
DISCUSSION
Discussion of research results conducted to obtain a scientific argument on the results of hypothesis testing. Here is a discussion of research results;
1. Hypothesis 1 (Job satisfaction has a positive effect on performance)
2. Hypothesis 2 ( Turnover intention as a moderating variable weakens the effect of job satisfaction on performance)
Based on Table no 10 The significance value is indicated by T Statistic (1.976 ≥ 1.96) or P-Value (0.035 ≤ 0.05). Thus, it can be concluded that the turnover intention as a moderating variable significantly weaken the relationship of job satisfaction on employee’s performance.
3. Hypothesis 3 (Organizational commitment has a positive effect on performance)
Based on Table no 10 the value of significance is indicated by T Statistic (3.944> 1.96) or P-Value (0.000 ≤ 0.05), so it can be interpreted the higher organizational commitment has a significant effect on improving employee’s performance or low organizational commitment will have a significant effect on decreasing employee’s performance.
4. Hypothesis 4 ( Turnover intention as a moderating variable weakens the influence of organizational commitment to performance)
Based on Table no 10 the value of significance is shown by T Statistic (2.210 ≥ 1.96) or Value (0.028 ≤ 0.05). Thus, it can be concluded that the presence of turnover intention as a moderating variable has an effect that significantly weaken the relationship of organizational commitment to employee’s performance.
Focus Group Discussion (FGD)
From the Focus Group Discussion (FGD) that has been implemented, the following are the order of priority of the proposed new policy;
1. It should be emphasized clearly the specific tasks and responsibilities are according to position/status of work. A review should be done on the role of Non-Permanent Employees in order for them not to become more dominant than Civil Servants in the important parts so it won’t affect the operational process of the Division/Unit in the future.
2. There should be more attention to the welfare of employees who have a good track record evaluation by extending the contract period of at least per 1 (year).
3. It is necessary to set certainly and clearly the distribution of bonuses every 3 (three) months, holiday, and start/end of year allowance in each Division/Unit in order to decrease gap or avoid jealousy among employees.
Managerial Implications
Several recommendations that can be given to the institutions related to this research are as follows:
1. Job satisfaction factor is a very important thing to consider, therefore the Office of Culture and Tourism of Surabaya City should improve it. The several ways that can be used to improve job satisfaction are:
a. Consider an increase in the salary of employees in accordance with the hours and workload and bonuses/allowances every 3 (three) months, Holiday, and the beginning/end of the year allowance are given evenly among the Divisions/Units without exception.
b. The existence of objective support or appreciation given by the boss to the employees with a good job record or achievement at least in the form of praise so that employees will feel their presence and hard work have contributed to the work achievement of Division/Unit.
By increasing job satisfaction the positive effects will be gotten from it, such as: employees can avoid the stress of work, become more passionate at work, low levels of resignation and increased employee productivity so that the target of the Agency as a whole can be achieved.
2. Organizational commitment factors that are also important factors to be considered can be improved in several ways including:
a. Performing extension of employee contract that has a good Working Orders completion record at least per 1 (one) year.
b.A review should be conducted regarding workload or employee’s responsibilities in order for them not to dominate the important works more than Civil Servants.
c.Implanting goals, vision, and mission to employees regularly in routine meetings, forums or gatherings with superiors. By explaining in detail the purpose, vision, and mission then the employees will know the big picture of the targets, the main tasks and functions of the Division/Unit. Employees will perceive, live, and seek compatibility between their and the Units’ vision-missions. That way, they will understand that when they pursue their personal goals, at the same time they pursue the goals of the Unit and vice versa.
3. The next important factor is turnover intention. Turnover intention is strongly influenced by previous factors, namely job satisfaction and organizational commitment. If the agency has increased the job satisfaction factor and organizational commitment to its employees, the turnover intention rate will be low so that the turnover rate becomes relatively small. However, there are several other ways to suppress turnover intention factors include:
a.Giving disciplinary sanctions to employees who have a record of lateness to come to work. With a minimumof 3x records in a month. They are only allowed to return home after 19.00 pm on Monday-Friday and can be utilized to complete a 2-weeks work deadline.
b.Giving of disciplinary sanctions to employees who have a record of absenteeism without early notice at least 2x in a month, that is only allowed to go home after 19:00 pm on Saturday-Sunday picket day and can be utilized to complete work deadline for 1 (one) month.
By lowering the employee turnover rate, the institution gets positive results, one of them is the General Sub Division and Personnel does not continuously focus on the recruitment and selection process.
4. The last factor that also needs to be considered is performance. Performance is the accumulated impact of the previous factors, namely job satisfaction, organizational commitment, and turnover intention. We recommend the Department of Culture and Tourism of Surabaya City to pay attention and improve the three previous factors in order to impact on improving employee’s performance. Besides increasing job satisfaction, organizational commitments and considering turnover intention to improve performance, other ways are:
a. The existence of the routine review of the concerned employees’ performance so that employees have better understanding about the assessment of each Division/Unit on the work of employees for the time being.
b.Establishing meeting forum or gathering regularly between boss and employees in each Division or Unit as one of the means to directly communicate to the supervisor on work progress or obstacles encountered, so that there will be a discussion together on solutions to these obstacles.
V.
CONCLUSION
Based on the results of the analysis and discussion that has been done, the following conclusions are obtained: 1. Job satisfaction on employee performance has a negative effect with the original sample value of 0.052 and
the influence of those two variables is considered insignificant indicated by T Statistic (0.489 ≤ 1.96) or P-Value (0.625 ≥ 0.05) or concluded that hypothesis is rejected.
2. Turnover intention to the relationship of job satisfaction and employee’s performance has a weakening role with the original sample value of -0.403 and the influence of moderation variable is considered significant indicated by T Statistic (1.976 ≥ 1.96) or P-Value (0.035 ≤ 0.05) or concluded that the hypothesis is accepted.
3. Organizational commitment to employee’s performance has a positive influence with the original sample value of 0.341 and the influence of both variables is considered significant indicated by T Statistic (3.944 ≥ 1.96) or P-Value (0.000 ≤ 0.05) or concluded that the hypothesis is accepted.
4. Turnover intention on organizational commitment relationships and employee’s performance has a weakening role, with the original sample value of 0.339 and the influence of moderating variables is considered to be significant indicated by T Statistic (2.210 ≥ 1.96) or P-Value (0.028 ≤ 0.05) or concluded that the hypothesis is accepted.
REFERENCES
[1]. Brahmasari, I. A. & Suprayetno, A. (2008). Pengaruh Motivasi Kerja, Kepemimpinan dan Budaya Organisasi Terhadap Kepuasan Kerja Karyawan Serta Dampaknya pada Kinerja Perusahaan (Studi kasus pada PT. Pei Hai International Wiratama Indonesia. Jurnal Manajemen dan Kewirausahaan, Vol. 10, No. 2, pp 124-135.
[2]. Burton, James P; Lee, Thomas W; Holtom, Brooks C, 2002, “The Influence of Motivation to Attend, Ability to Attend, and Organizational Commitment of Different Types of Absences Behaviors”. Journal of Managerial Issues, Summer, p. 181-197.
[3]. Cetin, Munevver Olcum, 2006, “The Relationship Between Job Satisfaction Occupational and Organizational Commitment of Academics”, Journal of American Academy of Business, 8(1), p.78-88 [4]. Chen et al, 2006, “Organization Communication, Job Stress, Organizational Commitment, and job
Performance of Accounting Professionals in Taiwan and America”, Leaderahip and Organizational Journal, 27 (4), p. 242-249.
[6]. Ghozali, I. (2012). Partial Least Square: Konsep, teknik dan Aplikasi SMART PLS 2.0M3. Semarang: Badan Penerbit Universitas Diponegoro.
[7]. Johson, M.W., Vandaranjan, P.R., Futrell, C.M., Sager, J., 1987. The Relationship Between Organizational Commitment, Job satisfaction, and Turnover Among New sales People. Journal of Personal Selling & Sales Management, Vol 7: 29-38
[8]. Irwanto. (2006). Focus Group Discussion: Sebuah Pegantar Praktis. Jakarta: Yayasan Obor Indonesia [9]. Mangkunegara, A. P. (2014). Manajemen Sumber Daya Manusia Perusahaan. Bandung: Remaja
Rosdakarya.
[10]. Rohadi, W. (2010). Analisis Pengaruh Kemanan Kerja dan Komitmen Organisasional Terhadap Turnover Intention Serta Dampaknya Pada Kinerja. Semarang: Universitas Diponegoro.
[11]. Wirawan. (2009). Evaluasi Kinerja Sumber Daya Manusia: Teori, Aplikasi, dan Penelitian. Jakarta: Salemba Empat.