Research Article
CODEN: IJPNL6
SIMULTANEOUS ESTIMATION OF ATORVASTATIN AND TELMISARTAN IN
TABLET DOSAGE FORM BY LIQUID CHROMATOGRAPHY
*Vineetha Vykuntum, Gajja Vijaykumar and Kudipudi Harinadha baba
NOVA College of Pharmacy, Vegavaram, Jangareddigudem, West Godavari, A.P, India
*Corresponding author e-mail:
[email protected]
ABSTRACT
A simple, rapid and accurate reverse phase-high performance liquid chromatographic method for the simultaneous determination of Atorvastatin and Telmisartan in tablet dosage form is developed and validated. The chromatographic analysis was performed on a kromasil C18 column (150×4.6 mm, 3.5 µm) in isocratic mode, the
mobile phase consisted of acetonitrile and phosphate buffer (adjusted to pH 3.8 with ortho-phosphoric acid) at a ratio of 70:30 v/v, and a flow rate of 1.0 mL/min. The eluents were monitored at 278 nm. The retention time of Atorvastatin and Telmisartan were found to be 2.804 min and 3.875 min, respectively. The linear ranges were found to be 50-90 µg/mL (r2=0.9992) for Atorvastatin and 12.5-22.5 µg/mL (r2=0.999) for Telmisartan. The proposed method is also found to be accurate, precise and robust. The method could be applied to routine quality control of pharmaceutical formulations containing Atorvastatin and Telmisartan.
Keywords:Atorvastatin, Telmisartan, RP-HPLC
INTRODUCTION
Telmisartan (TEL), 4-{[2-n-propyl-4-methyl-6-(1-methylbenzimidazol-2-yl)-benzimidazol-1-yl] methyl}-biphenyl-2-carboxylic acid is a new highly selective, nonpeptide angiotensin II type 1 (AT1)-receptor antagonist [1]. TEL lowers blood pressure through blockade of the renninangiotensin-aldosterone system (RAAS) and is widely used in the treatment of hypertension [2]. Determination of TEL in human plasma by liquid chromatography-tandem mass spectrometry has been reported [3].
HPTLC [4, 5], Spectrophotometry and RP-HPLC method for determination of TEL in combination with other anti-hypertensive agents has been reported
[6-8]. Atorvastatin (ATO) chemically is,
(βR,αR)-2-(4- fluorophenyl)-β,δ-dihydroxy-5-(methylethyl)-3-phenyl-4-[(phenylamino) carbonyl]-1H-pyrrole- 1-heptanoic acid as the calcium salt belongs to the group of statins. All statins, including atorvastatin reduce the production of cholesterol in the liver by the competitive inhibition of hydroxy- 3-methylglutaryl coenzyme A (HMGCoA) reductase,
the rate limiting enzyme in the biosynthesis of cholesterol [9]. Analytical methods for atorvastatin calcium usually combine reversed phase chromatographic methods and UV detection at characteristic absorption maxima or different modes of MS detection. Several methods have been reported for quantitative determination of atorvastatin in biological samples [10-11], aqueous samples [12-13] and tablets [14-17]. Present study involves the efficient RP-HPLC method forthe estimation of ATO and TEL in combined dosage form.
MATERIALS AND METHODS
Materials: ATO and TEL were generous gift samples from Aurobindo Pharma Limited (Hyderabad, India). A commercial Telsartan-AVR containing TEL (40mg) and ATO (10mg) were purchased from local market and used within their shelf-life period. The HPLC grade acetonitrile, methanol and water were purchased from Rankem (New Delhi, India). All other chemicals used were of pharmaceutical or analytical grade from Rankem (New Delhi, India).
International Journal of Pharmacy
Instrumentation:A Waters HPLC system consisting of a Water 2695 binary gradient pump, an inbuilt auto sampler, a column oven and Water 2487 dual wavelength absorbance detector (DAD) was employed throughout the analysis. The data was acquired using Empower 2 software. The column used was Kromasil C18 (150×4.6mm, 3.5µm). A
Bandline sonerex sonicator was used for enhancing dissolution of the compounds. A Digisum DI 707 digital pH meter was used for pH adjustment.
Preparation of standard stock solution: The standard stock solutions were prepared by transferring 10 mg of TEL and 10 mg ATO working standards into 10 mL volumetric flasks. To that about 7 mL diluent was added, and the solution was sonicated to dissolve and the volume made up to mark with diluent. The standard solutions were filtered through a 0.45 µm membrane filter. Aliquots of these solutions were transferred using A-grade bulb pipettes into 10 mL volumetric flasks and volume make up to the mark with mobile phase to give the final concentration 100 µg/mL of each analyte.
Method validation
To determine linearity, aliquots of primary standard TEL and ATO stock solutions were taken into 10 mL volumetric flask and diluted up to the mark with the mobile phase such that the final concentrations of TEL and ATO were in the range of 12.5-22.5 µg/mL and 50-90 µg/mL respectively. The solutions (20 µL) were injected three times into the column according to the optimized chromatographic conditions, and the peak areas and retention times were recorded. The calibration curve was constructed by plotting the analyte to internal standard peak area ratio (Response factor) against the concentration (µg/mL).
The accuracy was carried out by recovery studies using standard addition method; known amounts of standard drugs were added to pre-analyzed sample of TEL and ATO in according to 50, 100 and 150% of labeled claim, and then subjected to the proposed HPLC method. The experiment was performed in triplicate. The percentage recovery, RSD (%) and standard error mean (SEM) were calculated for each concentration level.
Precision was determined as repeatability, intermediate precision and reproducibility in accordance with ICH recommendations [18]. Repeatability was determined as intra- day variation and intermediate precision was determined by measurement of inter day variation. The
reproducibility was checked by measuring the precision of the method in same laboratory on a same instrumentation with analysis being performed by another person. For both intra-day and inter-day variation, standard solutions of TEL and ATO at single concentration were determined in five times. Limit of detection (LOD) and Limit of quantification (LOQ) were calculated based on the ICH guidelines
[18]. Robustness was done by deliberately changing
the chromatographic conditions like ± 0.2 in pH of the buffer and ±0.1mL in flow rate. To ensure the validity of the analytical procedure, a system suitability test was established. The following parameters like asymmetry factor, theoretical plate number (N), resolution (Rs) and retention time (tR)
were analyzed by using 20 µL of the working standard solution containing TEL (15 µg/mL) and ATO (60 µg/mL) injecting five times into HPLC system.
For analysis of marketed samples, twenty tablets of Telsartan-AVR each containing TEL (40 mg) and ATO (10mg) were weighed and finely powdered. A quantity of the powder equivalent to one tablet content was accurately weighed, transferred into 100 mL volumetric flask containing 70 mL of diluent, sonicated for about 15 min and the volume make up to the mark with methanol. This solution was filtered through a 0.45 µm membrane filter paper and filtrate was again diluted with mobile phase. The standard and sample solutions (20 µL) were separately injected into HPLC system. The possibility of interference from the excipients in the analysis was studied.
RESULTS AND DISCUSSION
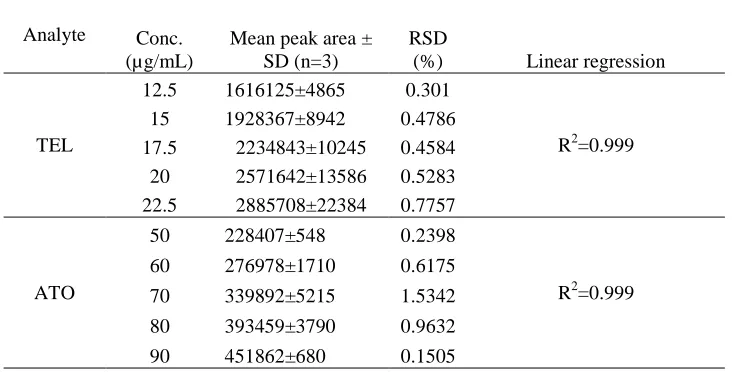
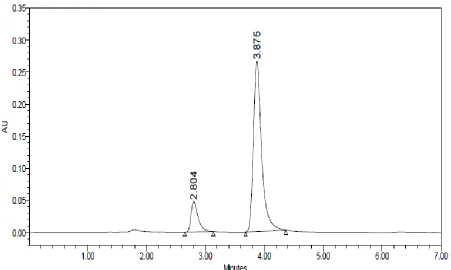
as the optimum mobile phase and a flow rate of 1.0 mL/min. Under these conditions, the analyte peaks were well resolved and were free from tailing. The tailing factor was <1.5 for both the analytes. The retention times of ATO and TEL were found to be 2.804 min and 3.875 min, respectively. The resolution (Rs) between ATO and TEL was found to be 2.35, indicating good separation of both analytes from each other. The theoretical plate number for TEL and ATO were found to be 4140 and 2665, respectively, thus indicating good column efficiency. A typical chromatogram was recorded at 278 nm, shown in Figure 1. The calibration plot was constructed by plotting peak area versus concentration (µg/mL) of TEL and ATO which were found to be linear in the range of 12.5-22.5 µg/mL (r2=0.999) and 50-90 µg/mL (r2=0.999), respectively (Table 1). Limit of detection (LOD) values of TEL and ATO were experimentally verified to be 0.042µg/mL and 0.063µg/mL, respectively. Limit of quantitation (LOQ) values of TEL and ATO were found to be 0.14µg/mL and 0.21µg/mL, respectively, which indicated that the method can be used for analysis of TEL and ATO over a very wide range of concentrations.
The percentage recoveries of TEL and ATO were found to be in the range of 99.81-100.62% and 99.65-100.68%, respectively. The results were shown in Table 2, which indicates that the method is accurate. The precision of an analytical method is the degree of agreement among the individual test results when the method is applied repeatedly to multiple sampling of homologous sample. Results from determination of repeatability and intermediate precision, expressed as RSD (%). The low values of %RSD indicated that the
method is precise. The reproducibility results were shown that, there were no significant differences between %RSD values for intra-day and inter-day precision, which indicated that the method, is reproducible. Robustness was done by small deliberate changes in the chromatographic conditions. There were no significant changes in the peak areas and retention times of TEL and ATO when the pH and flow rate of the mobile phase were changed. The results were indicating that the proposed method is robust.
The proposed method was applied to the simultaneous estimation of TEL and ATO in tablets. The assay results show that the proposed method was selective for the simultaneous determination of TEL and ATO without interference from the excipients used in the tablet dosage form. The values were shown in Table 3. The assay results and low %RSD values indicated that the developed method can be used for routine analysis of TEL and ATO in pharmaceutical dosage forms.
CONCLUSION
The developed RP-HPLC method was accurate, precise, reproducible and robust. The developed method has been found to be better, because of its wide range of linearity, use of a readily available mobile phase, lack of extraction procedure and low retention times. All these factors make the proposed method suitable for the quantification of TEL and ATO in bulk drugs and in table dosage form. The method can be successfully used for the routine analysis of TEL and ATO in pharmaceutical dosage forms without interference.
Table 1: Linearity data of TEL and ATO
Analyte Conc. (µg/mL)
Mean peak area ± SD (n=3)
RSD
(%) Linear regression
TEL
12.5 1616125±4865 0.301
R2=0.999 15 1928367±8942 0.4786
17.5 2234843±10245 0.4584 20 2571642±13586 0.5283 22.5 2885708±22384 0.7757
ATO
50 228407±548 0.2398
R2=0.999 60 276978±1710 0.6175
` Table 2: Results of recovery studies by standard addition method
Analyte
%Concentration (at specification
Level)
Amount Added
(mg)
Amount Found
(mg)
% Recovery
ATO
50 15 15.02 100.13 100 20 19.93 99.65 150 25 25.17 100.68
TEL
50 60 60.21 100.35 100 80 79.85 99.81 150 100 100.62 100.62 Table 3: Estimation of amount present in tablet dosage form
Tablet Formulation
Label Claim per Tablet (mg)
% Drug found ± SD (n=6)
RSD (%) ATO 10 99.82±0.604 0.605 TEL 40 101.36±0.721 0.711
REFERENCES
1. Maryadele J, Neil O. The Merck index. 14th ed. White House Station, NJ, USA: Merck and Co; 2006. p. 83-1569.
2. Meredith PA. Am J Cardiovasc Drugs, 2005; 5: 171-83.
3. Li P, Wang Y, Wang Y, Tang Y, Fawcett JP, Cui Y. J Chromatogr B, 2005; 828: 126-9.
4. Patel VA, Patel PG, Chaudhary BG, Rajgor NB, Rathi SG. Int J Pharm Biol Res, 2010; 1: 18-24. 5. Chabukswar AR, et al. Arch Appl Sci Res 2010; 2: 94-100.
6. Mohite PB, Pandhare RB, Bhaskar VJ. Eurasian J Anal Chem, 2010; 5: 89-94. 7. Ilango K, Shiji KPS. Asian J Pharm Hea Sci, 2011; 1: 12-5.
8. Gangola R, Singh N, Gaurav A, Maithani M, Singh R. Pharmacie Globale (IJCP), 2011; 2: 1-3. 9. Lea AP, Mc Tavish D. Drugs, 1997; 53: 828-47.
10. William W. Bullen, Ronald A. Miller, Roger N. Hayes. J Ame Soc Mass Spectrom, 1999; 10: 55-66. 11. Mohammed Jemal, Zheng Ouyang, Bang-Chi Chen, Deborah Teitz. Rapid Commun Mass Spectrom, 1999;
13(11):1003-15.
12. Sidika Arturk, Arma an Onal, Sevil Muge Cetin. J Chromatogr B, 2003; 793: 193-205. 13. Xiu-Sheng Miao, Chris D. J Chromatogr A, 2003; 998: 133-41.
14. Xiu-Sheng Miao, Chris D. J Mass Spectrom, 2003; 38: 27-34.
15. A Mohammadi, N Rezanour, M Ansari Dogaheh, F. Ghorbani Bidkorbeh, M. Hashem, RB Walker. J Chromatogr B, 2007; 846: 215-22.
16. Sıdıka Ertürk, Esra Sevinç Akta , Lale Ersoy, Samiye Ficiolu. J Pharm Biomed Anal, 2003; 33: 1017-23. 17. AA Kadav, DN Vora. J Pharm Biomed Anal, 2008; 48:120-6.