www.ijres.org Volume 4 Issue 3 ǁ March. 2016 ǁ PP.35-49
Towards the Experimental Studies of a Web-based Platform for
Eco-Tourism
Dimitris Halvatzaras & Katerina Kabassi
*Department of Environmental Technology TEI of Ionian Islands Zakynthos, Greece
Abstract:- This paper aims at showing the necessity and importance of several experimental studies during the life-cycle of a website. As a case study a web based platform for ecotourism is used. For this purpose, a prototype system, called EcoZante, was developed and different experiments took place. In the early stages of the systems’ life-cycle, an empirical study was conducted with the participation of real users, in order to embrace the main interests of users in the domain. After the implementation of the prototype, two evaluation experiments took place. In the first experiment an expert-based usability evaluation was implemented using a specific framework. Then a summative evaluation with the participation of real users was implemented for almost a year. The results of this evaluation experiments resulted in re-designing the user interface and improving the system. Finally, a comparative evaluation experiment was implemented involving the new improved web-based platform.
Keywords:- Ecotourism, Web-based Platform, Evaluation experiments, Personalisation, Design of web-based system
I.
INTRODUCTION
The globalization of technologies, such as the Internet in the mid 1990s, and its subsequent reinvention as the Social Web or Web 2.0 (O’Reilly, 2005), have led to a scenario where the improvement of various e-Tourism aspects has been amplified (Garcia-Crespo et al. 2009). Therefore, different techniques have been used for providing tourism services over the Web. However, sometimes these approaches may be so static and unfriendly that makes it difficult for user to interact with them. Indeed, Maswera et al. (2009) in a review of the website for tourism in sub-Saharan Africa propose personalization of the services in order to evolve these sites into marketing tools.
Lately personalized recommendation systems have been gaining interest in tourism to assist users with their travel plans (Ricci 2002, Ricci & Werthner 2002, Wallace et al. 2003, Loh et al. 2003, Rabanser and Ricci 2005). As a result, recommender systems have been successfully used in travel and tourism (Adomavicius & Tuzhilin 2005). Most of the recommendation systems focus on selecting the destination except from a few exceptions (Ardissono et al. 2003, Niaraki & Kim 2009). Some recommender systems only focus on some aspect of the holidays. For example, PTA (Personal Travel Assistant) (Coyle & Cunningham, 2003) is used for reserving and selling flights. In a quite different domain, Huang & Bian (2009) have developed a recommendation system for suggesting specific tourist attractions over the Internet. Many researchers support that tourist attractions are often the reason driving travellers to visit destinations (Gunn 1980, Lew 1987, Jafari 2000, Richards 2002). CRUMPET proposes touristic sights’ and uses advertisements to promote shops, restaurants, entertainment places, events as well as information, reservation, booking and payment services that may be helpful to any tourist. However, CRUMEP may be considered intrusive in comparison to approaches, such as MastroCARonte (Console et al. 2003), which does not disturb the driven but only tailors the answers to his/her queries. As a result, recommendation systems should be used in a non-intrusive way.
Travellers search information relative to their trip, make online air-ticket bookings, online room reservations, plan trips and make other online purchases themselves instead of relying on travel agencies to undertake this process for them (Morrison et al. 2001). Additionally, as Gretzel and Yoo (2008) point out, three-quarters of travelers, in general, have considered online consumer reviews as an information source when planning their trips. In view of the above, many different web sites have been developed for eco-travelers around the world (e.g. {} 2009, Dorsey et al. 2004).
This paper focuses on the experimental studies of ECOZANTE. Tsai et al. (2010) point out that there is no universally accepted method or technique for website evaluation. Indeed, several methods and techniques have been proposed for the web site evaluation that are specialised to touristic websites (Albadvi & Saddad 2012, Tsai et al. 2010, Hernandez et al. 2009). However, as Hernandez et al. (2009) point out most of these methods have been theoretically proposed without empirically being tested on any website. Therefore, there is a need for evaluation experiments implementation to test the proposed methods.
In view of the above, we describe the four different experiments and the analysis of the results. The first experimental study involves an empirical study that aimed at capturing the users’ interests about the island of Zakynthos. The second experiment aimed at evaluating the usability of the system. After the implementation of the user
II.
RELATED WORK
In tourism industry there are several studies evaluating massively touristic websites (Albadvi & Saddad 2012, Tsai et al. 2010, Hernandez et al. 2009, Ip et al. 2011)). However, not many evaluation experiments have been reported for analysing the design of single touristic websites for ecotourism.
Nielsen (1993) proposed that usability has five attributes: learnability, efficiency, memorability, low error rate or easy error recovery, and satisfaction. Nielsen (2000) extended information system design principles for Web and suggested four parameters for usability: (1) navigation, (2) response time, (3) credibility, and (4) content. Tsai et al. (2010), after making a review of several papers with evaluation methods, concluded that the following criteria are the most commonly used for website evaluation
Navigability: Ease of navigation, Ease of return to the home page of the site, Ease of locating relevant information (Miranda-Gonzalez & Banegil-Palacios, 2004), Search tools (Smith, 2001).
Speed: Quick connection and delivery, minimal use of large graphics and bright colours, ease of access to links (Bilsel et al., 2006), and website loading speed (Smith, 2001).
Links: Availability of links and correctness.
Relevancy: Relevance depth, scope and completeness of information (Lee & Kozar, 2006). Existence of different parts of the website for different group of visitors (Cao et al., 2005), such as travellers, researchers, students, and local citizens.
Richness: Level and scope of information content (Bilsel et al., 2006).
Currency: Last update/review dates are a critical way of notifying users of the currency of content (Lee & Kozar, 2006; Smith, 2001).
Attractiveness: (Cao et al., 2005; Huizingh, 2000; Miranda-Gonzalez & Banegil-Palacios, 2004).
Security: How trustworthy the website is for customers (Ho & Lee, 2007).
Personalization: Efficient individualized interface, effective one-to-one information, and customized service (Lee & Kozar, 2006). Customized content of the website can provide a user with the relevant and up-to-date information that will address his specific needs (Ho & Lee, 2007).
Responsiveness: FAQs and prompts assistance for solving problems (Ahn et al, 2007; Ho & Lee, 2007).
The UsabAIPO heuristic method is based on the based on Heuristic Evaluation techniques (Nielsen 2004). The particular model contains twenty-five questions, five of which correspond to the Content Category, seven correspond to the Design Category, seven correspond to the Navigation Category and six correspond to the Search Category.
Cat
Usab-AIPO-HM Heuristic
Related questions
D Graphic Design Friendly Interface: Does the website have a friendly interface, with uniform colors in most pages?
Clean Interface: Does the website offer a clean interface, without visual noise and with a correct usage of space?
Text Design: Does the text have a simple design, with enough contrast between background and text, limiting the font type and other text att.? Liquid Design: Is a liquid design being used?
Images Labeled Images: Are images labeled? Does their title appear when the mouse is moved over them?
Animated elements: Do animated elements exist?
visualization?
N Navigation Area Number of elements in menus: Has the number of elements and terms per element been checked in order not to produce memory overload? Visibility: Is the totality of the elements in the navigation area visible without requiring any interaction from the user?
Existence of site map: Is there a site map on the website?
Affordance from links to applications: If a link leads to an application, is that clearly indicated?
Orientation Access to homepage: Can the homepage always be reached from any navigation level?
Orientation elements: Are there elements that allow the user to know exactly where he/she is in the website and how to move back? (breadcrumbs)
Identifiable links: Do links clearly indicate where they lead to, using an appropriate title so that the user can predict the system response to his/her action?
C Information News update: Are news properly updated? Do they have publication
date?
Contact data: Is it easy to access information? Is there clear information about the data needed to contact a hotel or a restaurant (phone, email, etc)?
News clarity: Are news items published on a salient place on the website, with a link to the news item associated with the news headline, and with a clear abstract of the contents of the news?
Internatio-nalization Language: Does the website offer a multi-language option?
Scope: The information available for the different languages is one page or is it the most part of the website?
B Search Area Visibility and Simplicity: Is it easy to start a search? Is the textbox used to search terms on the website to be found on the homepage? Is it easily accessible from any place of the website?
Size: Is the text entry box for search wide enough? (it must contain between 15 and 30 visible characters)
Complexity: Is there an advanced search option? Are there enough options to carry out a properly bounded search?
Engines: Are links to Internet search engines included?
Search Result Comprensibility: Are search results shown in a clear form which is comprehensible enough for the user?
Result Assistance: Is the user assisted when no results can be found?
Table 1: Heuristics of the UsabAIPO-HM framework
II.
EMPIRICAL STUDY
Figure 1: Analysis of users’ interests in ECOZANTE
The results of the empirical study were further used to improve the recommendation process of the system. More specifically, these results have been used for obtaining initial information about the user before the recommendation agent manages to obtain information about the user interacting with system. In the above case, the recommendation agent will use the results from the empirical study, e.g. it will propose first accommodation and then restaurants as alternative suggestions.
III.
GENERAL DESCRIPTION OF THE SYSTEM
Figure 2: Navigation aids of the system
Business 9%
Local Products 7%
Nature 10%
Activities 12%
SightSeeing: 16%
Restaurant 19% Accommodation 28%
Figure 3: Interactive Map
The aim of the project is to present information to the ecotravellers in a user friendly way specific to their needs. At the same time the platform must be able to promote and support the principals of ecotourism. In the web platform six main services were implemented that aim to deliver valuable content to the user by different interaction methods. In many cases the services overlap in terms of goal. The variety of the services was decided due to the fact that ecotravelers have a wide variety of ideas and motivations for ecotouristic experiences (Chirgwin & Hughes 1997). In this paper we focus mainly in different navigation and presentation services that are provided to users during their interaction with the system. These services are:
1. Interactive Keyword Tags: Each record of information is related to someclassification keywords (eg. Trekking, mountain activity etc.). These types of keywords are presented as interactive links next to the information which are related with.
2. Menu and SubMenus: Users can navigate to different sections of information by using a main menu which offers seven basic options: Nature, Activities, Places of Interest, Restaurants, Trade business, Accommodation. Each information section offers an extensive submenu which has been implemented as a form of tag cloud (Baterman et al. 2008). Users can limit down their search results by clicking on the options offered by the submenu.
3. Search wizard: Thesearch wizard can be perceived as a recommendation system, where users declare their goals explicitly and search results are sorted based on the satisfaction of the user's search criteria. At the current implementation the search wizard follows a sequence of steps similar to the DTR-C prototype model (Zins et al. 2004). The search wizard tries to simulate a human like conversation by presenting (one by one) a set of multiple-choice questions to the user, in a dialogue like format. The search results of a queryare displayed as a list or on an interactive map. The information stored in the user model is further used by the system to refine the search results. For example, if the user model has stored the information that the particular user usually searches accommodation near the coast line, then when this user searches for restaurant it will propose restaurants near the coast.
4. Interactive Map: The interactive map (Figure 3) enables users to explore virtually a geographic area. More specifically, users can browse information on a map (based on the google maps api) where records of information are presented as click-able land markers. By clicking the landmark, users are able to view a short description, keywords and an image concerning the landmark. The system can display specific sets of information which have been queried either by using the menu or the search wizard.
5. Recommendation agent: The recommendation agent uses information about the users as well as plausible logic rules to make recommendations of hotels, restaurants, sights or activities. For example, in a web page (created dynamically by the ECOZANTE) that presents an eco farm, an instance of the agent can create a list of other similar ecofarms, while another instance of the agent presents a list of plants at the area that surrounds the farm, and a third version presents activities that can be followed during the visit. Finally these lists of results are further filtered by the recommendation agent and are proposed to the user as suggestions that match best his/her interests and goals.
query with the use of the search wizard.
7. Content generator: Different users have different needs and require different presentation. The content generator is the main component of the web platform that is able to customize views of content taking into account the type or the conceptual category of the information that must be presented. The content generator also invokes the recommendation agent that is able to handle users’ requests and in response to deliver the desired content accompanied with recommendations. To achieve this, the system uses a set of web-layouts which are dedicated to different categories of information. So, for instance the presentation of an activity uses a web layout that emphasizes on presented pictures and an activity map together with other textual information. At the same time information that is related to blog article is presented holding more emphasis to the textual information whereas pictures are presented at the bottom of the page.
IV.
RECOMMENDATION AGENT
In this project the Recommendation Agent (R.A.) has been used as a key element for supporting the principals of eco tourism and at the same time to assist the visitors of the website to plan their journey. The R.A. implements and supports all the following conceptual goals:
Promotion of sustainable business groups
Promotion of ecolearning
Presentation of posts related to users search context
The main functionality of the R.A. is to observe what the user is looking for, capture his/her interests and make personalized recommendations. To achieve this, the R.A. uses a plausible algorithm which is able to utilize rules for mining information related to the user’s search context.
The R.A. tries to promote information related to the nature-culture, activities and local businesses. In order to support the process of whole travel planning another set of rules has been used which mines supplementary information in an effort to recreate a broader picture of the place that the user is browsing. As well defined by several studies (Decrop 2006) on the field of travel planning, when a person tries to evaluate a potential destination (or activity) he/she tries to build an imaginary story of how would it be when he/she riches that place. At that point the R.A. tries to fill gaps of information helping the user to recreate the fantasy of been there.
In every case that a user makes a specific search, the R.A. takes into account factors such as the location of interest, the characteristics of the area (eg. remote), the nature (eg. near to the sea) and the information about the user that is stored in the user model. By processing these facts it is able to infer information about the nature (eg. integinues animals), the local business (eg. restaurants, trade shops etc.), activities and places of interest. This information is further filtered using a user model. Kass and Finin (1989) define the user model as the knowledge source of a system that contains hypotheses concerning the user that may be important in terms of the interactive behaviour of the system. The user model holds a representation of short-term features of each user’s interaction with the system. This information may have been acquired explicitly by asking the user or implicitly by watching the user while s/he interacts with the system. We use both these ways. The user declares explicitly in the search wizard some of his/her goals and the R.A. watches the user constantly to implicitly gather information about his/her interests in order to personalize the information the system provides. However, until the system acquired adequate information about the user the method of stereotypes is used to initialize the user model and provide better results. Stereotypes (Rich 1989; Rich 1999) are used in user modeling in order to provide default assumptions about users belonging to the same category. However, these assumptions are overridden by the assumptions that are made by the R.A. for the specific user while watching him/her implicitly. The user model that has implemented in this project takes into account the following factors:
Activity interests (eg. water sports)
Preferences related to nature (eg. near to the beach)
Location preferences (eg. near to night life)
The recommended information is presented enriched with pictures and short texts so that the user will be able to easily process this supplementary information without getting frustrated by extra information that s/he did not ask for.
The next two screenshots demonstrate two different layouts where information is presented differently and the R.A. follows a different strategy for proposing relevant information.
following a model for the sporty type of user (this type of user is seeking for activities regardless the area he/she is staying).
On the other hand when a user is searching for accommodation, a completely different set of proposals is offered. The R.A. proposes information taking into account the area around the lodge. Visitors that are trying to decide where to stay they surely want to know related information about the area. So the R.A. also makes proposals of where to eat, how the nature around, attractions and even another lodge nearby is.
Figure 4: Screenshots of EcoZante
V.
EVALUATION
After the system has been fully implemented, it was evaluated by two human experts in usability. The evaluation experiment is conducted into two phases and combines three different evaluation methods. More specifically, we use the UsabAIPO heuristic method and a summative evaluation. The two phases of the evaluation are the following:
Phase 1: 2 human experts were asked to conduct heuristic evaluation of the website and identifying the main usability problems.
Phase 2: a summative evaluation took place and 2 human experts performed usability evaluation by analysing the information collected during the real users’ interaction with the system.
Phase 1 – Heuristic evaluation
2 human experts worked with the website and used the UsabAIPO-HM heuristics (Gonzalez et al. 2008) to evaluate the usability of the system. The human experts had a PhD in Software Engineering, teaching experience in higher education, experience in developing website and experience related to the touristic domain. The results of the evaluation of the system with respect of the heuristics of UsabAIPO-HM are presented in table
Cat Usab-
AIPO-HM Heuristic
Related questions
D Graphic
Design
Clean Interface: The experts agreed that the website did not have visual noise as the space was correctly used.
Text Design: The experts proposed in the new interface to improve the contrast between background and text.
Liquid Design: This was not considered rather important by the experts.
Images Labelled Images: The images were not labeled and in some cases it was not clear to which property they belonged. Therefore, it was proposed to be better labelled.
Animated elements: No animated elements existed. Some animated elements were proposed to be added.
Image Resolution: The images resolution had no problem.
N Navigation
Area
Number of elements in menus: The number of elements produced memory overload and proposed to be reduced in the new interface. Visibility: Some of the elements of the user interface was not visible in the first page and was proposed by both experts to be added in the first page so that the navigation area had all the required elements visible without requiring any interaction from the user.
Existence of site map: A site map existed.
Affordance from links to applications: No application links existed.
Orientation Access to homepage: Adequate access to homepage.
Orientation elements: The human experts did not identify an orientation problems but waited to check the orientation problems identified by real users’ interaction in phase 2.
Identifiable links: Do links clearly indicate where they lead to, using an appropriate title so that the user can predict the system response to his/her action?
C Information News update: There was no news section
Contact data: All hotels, restaurants etc had contact information. News clarity: There was no news section
Internatio-nalization
Language: The website was in English and therefore international. Scope: The scope of the website was to promote ecotourism and was clear in the website.
B Search Area Visibility and Simplicity: The search had to be further improved and it was one of the main issued tested in Phase 2.
Size: The text box for search could manipulate 30 visible characters and considered adequate.
Complexity: The search had to be further improved and it was one of the main issued tested in Phase 2.
Engines: This was not considered essential by the experts.
Search Result Comprensibility: The search had to be further improved and it was one of the main issued tested in Phase 2.
Result Assistance: The search had to be further improved and it was one of the main issued tested in Phase 2.
Table 2: Results of the evaluation of the USABAIPO-HM heuristics
Phase 2 – Summative evaluation
A summative evaluation refers to evaluating activity in a website for a year or even longer periods of time. The particular experiment’s duration was 14 months and the evaluation data were collected using a web service provided by Google (Google Analytics). This evaluation tried to analyse Website traffic such as hits, page view, unique visits by week or month as well as the effectiveness of the system. By effectiveness we mean the number of times that the users really found what they were looking for.
A main problem that many times occurs when analyzing network traffic is that network data, in many cases, contain “noise”, e.g. interactions recorded that do not correspond to potential ecotravelers. For this purpose, first, the data collected, were filtered by subtracting the interactions that has our labs’ IP and those interactions that were less than a half a minute long. The latter kind of interaction possible indicated users that visited the website but were not interested on the content of the site at all.
protocols was performed in terms of some specific criteria. The evaluation criteria that have been used for the evaluation of the website were proposed by Tsai et al. (2010) after a review in several research papers about website evaluation and were presented in section 2.
Thisevaluation experiment focused on revealing how successful the R.A. was in capturing the users’ real interests and goals. Furthermore, special emphasis was given to the evaluation of navigation aids the system uses.
Navigability & Links
Regarding the first evaluation criterion which refers to navigability, the evaluation experiment revealed the users’ preferences in terms of navigation. Classic and alternative methods were included in the home page of the website and users were free to choose any of the available navigation methods.
Figure 2: Usage of main navigation Tools
In order to capture users’ preferences, the system monitored the clicks on each navigation tool. The only problem that occurred in capturing user preferences was that the classic menu navigation system offered 6 different options whereas the rest of the navigation tools where viewed as one option each. Therefore, the click stream of the menu was normalized by taking into account the average click stream of each menu option.
The majority of users (35% of previews) used the classic menu to access the content of the website. However, useers very often the tag cloud and the navigation map (29% and 24% of clicks, respectively). The search wizard was not used as much probably because the users felt that they were left out from the exploration process.
The effectiveness of these different methods is evaluated by two factors:
1. The percentage of the displayed links that were actually clicked and followed by the users. This factor indicates the case of finding interesting content.
2. Time spent viewing the selected content. Time indicates accuracy of selecting information of personal interest.
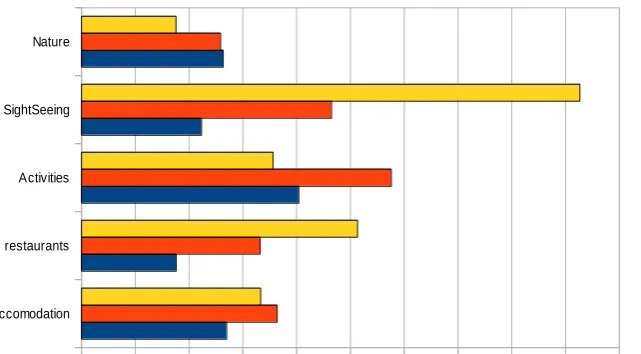
The experiment also aimed at revealing which one of the navigation aids was more successful in every one of the different categories of information included in the website. Looking at the diagram of figure 3, one can see that the users behaved differently in different categories of information. For example, there is a significant difference in the behavior of the users that followed the subject of sightseeing in comparison to other subjects such as nature and activities. More specifically, users that were interested in sightseeing used the next button twice as much as tag menu. This probably means that they wanted to see everything and not only those proposed by the system or it meant that they did not know exactly what they were looking for. At the same time they did use the tag menu more often in the field of activities. This may indicate that the tag menu helped users
Navigation Map 24%
Search Wizard 12%
Tag cloud 29%
Menu Average usage 35%
to find more individualized information about their personal activity interests. The same behavior had the users searching for information about the environment of Zakynthos. Users in this subject focused on some areas and keyword tags and tag menu seemed more appropriate.
Figure 3: Performance of navigation aids
Speed
The time of the users spent in the website and the number of the web pages visited showed that the website was easily loaded and the interaction was very good as the users had the opportunity to visit several pages in a short time session.
Richness:
The results presented in Figure 3, shows that the web page offers rich information content that interests the users that want to visit more and more information. The level of the information content is high as they usually found what they were looking for and visited the
Currency:
The content is updated in a annual basis in order to ensure the currency of content. This was also verified by the currency of the links offered to the users.
Attractiveness
The colors of the system could be improved as the expert users evaluating the system thought that the colors used made the system tiring in the eye. Therefore, we decided to use warmer colors to make the user interface more attractive.
Security:
No problem was tracked down related with the data of the customers.
Relevancy and Personalisation
In order to check the personalisation process of the web page and the relevancy of the results proposed, an analysis was made on the monitored interaction logs. First we analyzed the percentage of the links that the user followed out of the total links that were presented from every mean. This percentage has been calculated in comparison to the search list that was created after the user explicitly declaring his/her search goals. And secondly we analyzed the time that the user spent on reading the selected information (this is presented in the diagram with the red line). The main outcomes of this analysis were the following:
In more than 60% of the cases the R.A. was able to propose content to the user that was clicked as it was considered interesting. What strengthens this conclusion is the time spent in the pages selected after R.A. proposals. The diagram shows that the users spent more time in what the R.A proposed compared to all the other means of navigation.
In more than 20% of the cases the users were also interested in related content that was proposed by the system. This content concerns nature but the method used for selecting proposed content should be accomodation
restaurants Activities SightSeeing Nature
0,00% 5,00% 10,00% 15,00% 20,00% 25,00% 30,00% 35,00% 40,00% 45,00% 50,00%
improved because users did not spent much time to it, which means that probably they were looking for something different.
The R.A. functioned also much better than promoted proposals. This means that the mechanism of R.A. should be incorporated also to promoted proposals and this would improve the mechanism of advertisement and the system would be more competitive.
The map was purely used as a navigation mean but whenever it was selected the users spent much time in interacting with it and therefore seems to have some interest for specific kind of users.
Figure 6: Figure for percentage of users following the links proposed and time spent on each link
Responsiveness:
The time that system needed to respond to users’ queries was very short. This is verified also verified by the fact that the users had the opportunity to visit several pages in a short time session.
VI.
RE-DESIGNING THE SYSTEM
The results of the evaluation revealed that the system was quite successful in capturing the users’ interests and goals but in some cases it could be improved.
Figure 8: Screenshot of the final system
Change 2: The interactive map was considered very interesting by some users that spent much time to it and, therefore, was considered more appropriate not to remove it completely but keep it embedded as part of the search result list. As the map was proven during the evaluation experiment to be a very accurate mean for exploration, in the new design of the system it was decided to present multiple results in a map as well as in a list.
Change 3: Another change that was made involved the improvement of submenus for better human-computer interaction.
Change 4: Re-design of the user interface making it more attractive.
ECOZANTE was re-designed and implemented embedding all the changes that were considered crucial during the first evaluation experiments. The final system is presented in Figure 8.
VII.
EVALUATION EXPERIMENT
After the system was fully implemented, a new evaluation experiment was performed. Now, a comparative evaluation experiment was implemented focusing on the overall performance of ECOZANTE. For this evaluation, a scenario was designed and a questionnaire was given to peers. More specifically, they were asked to perform the following task:
"Search in the internet (using the search engine google) for information concerning trekking in Zakynthos. Evaluate three of the websites that appear in the 10 first results of your search." For the evaluation a questionnaire was given to them as a mean to help them focus on the right evaluation variables. The group was allowed to interact with each other, even help each other. The experiment lasted it for 1 hour.
Figure 9: Evaluation Review of the system
The main conclusions of this evaluation experiment were:
Users located much easier the content that they were looking for in ECOZANTE compared to other websites.
Users interacting with ECOZANTE found relevant information to what they were looking in more cases than in the other sites and, therefore, followed the proposed links in more cases.
The map was used much more extensively than in the first prototype and the kind of map used in ECOZANTE was twice as good as in other sites.
The users found ECOZANTE much better than the other websites. This involved the design of the interface, menus, the way information is presented etc.
Furthermore, ECOZANTE proved to be more effecting when evaluating the content of the system as well as the system’s success in locating what the users are looking for.
Users visited more web pages while being in ECOZANTE than in other platforms.
VIII. CONCLUSIONS
The advances of Information Technology have affected remarkably the way that touristic services are performed. Tourists have access to a wide range of information and can undertake many tasks on their own, such as making reservations or plans. A common tool for advancing these tasks is Internet. Especially, tourists of special categories of tourism such as eco-tourism that tend to search not only accommodation, restaurants and sights but also information about nature, activities etc. Taking into account the special needs of this kind of tourists we have developed a web-based platform for ecotouristic activities and touristic businesses in Zakynthos, an island of Greece. The web-based platform uses different navigation tools and aids to improve interaction as well as a recommendation agent, which incorporates user modelling techniques to personalise interaction.
This paper focuses on the necessity of existence of several experimental studies conducted during the life-cycle of the web-based platform. More specifically, during Requirement Analysis and before the implementation of the website, an empirical study was conducted in order to capture the potential tourists’ interests for Zakynthos. The results of the empirical study were used in order to design the platform and implement a prototype. The empirical study showed that the eco-tourists mainly interest in the following subjects given in priority order: Accommodation, Restaurants, sightseeing, activities, nature, local products, other businesses.
the preferences of users in menus, tag clouds and navigation maps during their interaction with the platform. Furthermore, the t-test conducted during the evaluation study showed that Recommendation Agent (R.A.) was successful in capturing the users’ interests and goals and its use could really improve the interaction with the system. The main advantage of R.A. was that it used different user modelling techniques to eliminate the search result list.
The findings during the evaluation experiment were used to re-design the system and a new version was fully implemented. Then we run a comparative evaluation of the new version of the system that incorporated all changes. During this evaluation experiment we asked some peers to evaluate the system in comparison to other with similar content using a questionnaire. In all questions, our system performed better. More specifically, the users were happy with the website’s interface and very satisfied with the information provided, as they seemed to be closer to what they were looking for compared to the search results in other sites. It is among our future plans to use this system commercially giving more emphasis in the R.A. and extend its operation to other features of the system.
REFERENCES
[1]. Adomavicius, G, Tuzhilin, A. (2005) Towards the next generation of recommender systems: a survey of the state-of-the-art and possible extensions. IEEE Transactions on Knowledge and Data Engineering, 17(6), 734-749. [2]. Albadvi A. & Saddad G.(2012) Web Site Evaluation of Iranian Tourism and Hospitality Organizations: An
E-Commerce Web Site Features Model Journal of Hospitality Marketing & Management, 21:155–183
[3]. Ardissono, L, Goy, A, Petrone, G, Signan, M, Torasso, P. (2003) Intrigue: Personalized recommendation of tourism attractions for desktop and handset devices. Applied Artificial Intelligence, 17(8–9), 687–714
[4]. S. Bateman, C. Gutwin, Nacenta M. (2008) Seeing things in the clouds: the effect of visual features on tag cloud selections. Proceedings of the nineteenth ACM conference on Hypertext and hypermedia, . 193-202, ACM New York, NY, USA.
[5]. Bilsel, R. U., Buyukozkan, G., & Ruan, D. (2006). A fuzzy preference-ranking model for a quality evaluation of hospital web sites. International Journal of Intelligent Systems, 21(11), 1181–1197.
[6]. Buyukozkan, G., & Ruan, D. (2007). Evaluating government websites based on a fuzzy multiple criteria decision-making approach. International Journal of Uncertainty, Fuzziness and Knowledge-Based Systems, 15(3), 321–343. [7]. Buyukozkan, G., Ruan, D., & Feyziog˜lu, O. (2007). Evaluating e-learning web site quality in fuzzy environment.
International Journal of Intelligent Systems, 22(5), 567–586.
[8]. Cao, M., Zhang, Q., & Seydel, J. (2005). B2C e-commerce web site quality: an empirical examination. Industrial Management & Data Systems, 105(5), 645–661.
[9]. Chirgwin, S. & Hughes, K. (1997) Ecotourism: The participants' perceptions. Journal of Tourism Studies, 8(2), 2-7 [10]. Chu, R. (2001). What online Hong Kong travelers look for on airline/travel websites? International Journal of
Hospitality Management, 20(1), 95–100.
[11]. Console, L, Lombardi, I, Gioria, S. (2003) Personalized and Adaptive Services on Board a Car: An Applicaation for Tourist Information. Journal of Intelligent Information Systems, 21(3), 249-284
[12]. Coyle, L, Cunningham, P. Exploiting re-ranking information in a case-based personal travel assistant. Proceedings of the 5th international conference on case-based reasoning, 2003.
[13]. Decrop, A. (2006) Vacation Decision Making. Cabi Publishing
[14]. Dorsey, E., Leslie H., Steeves, Luz Estella Porras (2004) Advertising ecotourism on the internet: commodifying environment and culture. New Media & Society, 6, 753-779.
[15]. Garcia Cerspo, A, Chamizo, J, Rivera, I, Mncke, M, Colomo Palacios, R, Gomez Berbis, JM. (2009) SPETA: Social pervasive e-Tourism advisor. Telematics and Informatics, 26(3), 306-315.
[16]. Gretzel, U, Yoo, K. (2008) Use and impact of online travel reviews. In: O’Connor, P., Hopken, W., Gretzel, U. (Eds.), Information and Communication Technologies in Tourism, 35-46, Springer-Verlag, Wien/New York. [17]. Gunn C. (1980) Amendment to Leiper: The framework of tourism. Annals of Tourism Research, 7, 253–255. [18]. {} (2009) Web-based Platform for Promoting Eco-Tourism. International Conference on Tourism Development
and Management.
[19]. Hernandez B., Jimenez J., Jose Martin M. (2009) Key website factors in e-business strategy. International Journal of Information Management 29 (2009) 362–371
[20]. Ho, C. I., & Lee, Y. L. (2007). The development of an e-travel service quality scale. Tourism Management, 28(6), 1434–1449.
[21]. Huang, Y, Bian, L. (2009) A Bayesian network and analytic hierarchy process based persoalized recommendations for tourist attractions over the Internet. Expert Systems with Applications, 36(1) 933-943.
[22]. Huizingh, E. K. R. E. (2000). The content and design of web sites: an empirical study. Information & Management, 37(3), 123–134.
[23]. Jafari, J. (Ed.) (2000) Encyclopedia of tourism. Routledge.
[24]. Kass R. and Finin, T. (1989) The role of User Models in Cooperative Interactive Systems, International Journal of Intelligent Systems, 4, 81-112.
[25]. Ip C., Law R., Lee H.A. (2011) A Review of Website Evaluation Studies in the Tourism and Hospitality Fields from 1996 to 2009, Int. J. Tourism Res. 13, 234–265 (2011)
[27]. Lew, A. (1987) A framework of tourist attraction research. Annals of Tourism Research, 14, 533–575.
[28]. Loh, S, Lorenzi, F, Saldana, R, Licthnow, D. (2003) A tourism recommendation system based on collaboration and text analysis. Information Technology & Tourism, 5, 157–165.
[29]. Maswera, T, Edwards, J, Dawson, R. (2009) Recommendations of e-commerce systems in the tourism industry of sub-Saharan Africa. Telematics and Informatics, 26, 12-19.
[30]. Miranda-Gonza´ lez, F. J., & Ban˜ egil-Palacios, T. M. (2004). Quantitative evaluation of commercial web sites: an empirical study of Spanish firms. International Journal of Information Management, 24(4), 313–328.
[31]. Morrison, A. M., Taylor, J. S., Morrison, A. J. & Morrison, A. D. (1999). Marketing small hotels on the World Wide Web. Information Technology & Tourism, 2 (2), 105.
[32]. Morrison, AM, Jing, S, O’Leary, JT, Lipping, AC. (2001) Predicting usage of the Internet for travel bookings: An exploratory study. Information Technology & Tourism, 4(1), 15–30.
[33]. Niaraki, A.S., Kim, K. (2009) Ontology based personalized route planning system using a multi-criteria decision making approach. Expert Systems with Applications, 36, 2250-2259.
[34]. Nielsen, J. (1993). Usability engineering. Cambridge: Academic Press.
[35]. Nielsen, J. (2000). Designing web usability: The practice of simplicity. Indianapolis: New Riders.
[36]. O’Reilly, T. (2005) What is web 2.0?. O’Reilly NetWork. <http://www.oreillynet.com/pub/a/oreilly/tim/news/2005/09/30/what-is-web-20.html>.
[37]. Rabanser, U, Ricci, F. (2005) Recommender systems: do they have a viable business model in e-tourism? Conference of the International Federation for IT & Travel and Tourism,160–171. Lausanne, Switzerland. [38]. Ricci, F. (2002) Travel recommendation systems. IEEE Intelligent Systems, 17(6), 55–57.
[39]. Ricci, F, Werthner H. (2002) Case-based querying for travel planning recommendation. Information Technology and Tourism, 4(3–4), 215–226.
[40]. Rich, E. (1989) Stereotypes and User Modeling. In: Kobsa, A., Wahlster, W., (Eds.) User Models in Dialog Systems, 199-214.
[41]. Rich, E. (1999) Users are individuals: individualizing user models. International Journal of Human-Computer Studies, 51, 323-338.
[42]. Richards, G. (2002) Tourism attraction systems-exploring cultural behavior. Annals of Tourism Research, 29(4), 1048–1064.
[43]. Smith, A. G. (2001). Applying evaluation criteria to New Zealand government websites. International Journal of Information Management, 21(2), 137–149.
[44]. Tsai WH, Chou WC, Lai CW (2010) An effective evaluation model and improvement analysis for national park websites: A case study of Taiwan. Tourism Management 31 (2010) 936–952
[45]. Wallace, M, Maglogiannis, I, Karpouzis, K, Kormentzas, G, Kollias, S. (2003) Intelligent one-stop-shop travel recommendations using an adaptive neural network and clustering of history. Information Technology & Tourism, 6, 181–193.