R E S E A R C H
Open Access
A data warehouse to support web site
automation
Marcos Aurélio Domingues
1*, Carlos Soares
2, Alípio Mário Jorge
3and Solange Oliveira Rezende
1Abstract
Background: Due to the constant demand for new information and timely updates of services and content in order to satisfy the user’s needs, web site automation has emerged as a solution to automate several personalization and management activities of a web site. One goal of automation is the reduction of the editor’s effort and consequently of the costs for the owner. The other goal is that the site can more timely adapt to the behavior of the user, improving the browsing experience and helping the user in achieving his/her own goals.
Methods: A database to store rich web data is an essential component for web site automation. In this paper, we propose a data warehouse that is developed to be a repository of information to support different web site
automation and monitoring activities. We implemented our data warehouse and used it as a repository of information in three different case studies related to the areas of e-commerce, e-learning, and e-news.
Result: The case studies showed that our data warehouse is appropriate for web site automation in different contexts. Conclusion: In all cases, the use of the data warehouse was quite simple and with a good response time, mainly because of the simplicity of its structure.
Keywords: Data warehouse; Web site automation; Web data; Web mining
Background
During the past few years, the World-Wide Web has become the largest and most popular medium of commu-nication and information dissemination, with web appli-cations being used in the most diverse contexts: electronic commerce (e.g., http://www.amazon.com/), distance ed-ucation/learning (e.g.,http://moodle.com/), digital encyclo-pedias (e.g., http://www.wikipedia.org/), social networks (e.g.,http://www.facebook.com/), and so forth.
The continuous growth in size and usage of the World-Wide Web poses a number of challenging research prob-lems that can be seen from three different points of view:
1. User - the person who browses the web or enters a web site.
2. Editor - the person in charge of creating, updating, and deleting content on a specific web sitea.
*Correspondence: mad@icmc.usp.br
1Institute of Mathematics and Computer Science, University of Sao Paulo, Sao Paulo 05508-070, Brazil
Full list of author information is available at the end of the article
3. Owner - the person or organization that owns the site and manages the editor’s activity. The site ultimately exists to achieve the owner’s objectives.
From the user’s point of view, the web is becoming too large, too dynamic, and increasingly unknown. From the point of view of the editor, who needs to produce and maintain the content of a web site, the web is a constant demand for new information and timely updates. More-over, the editor should not only maintain the content, but also permanently choose the services and the navigational structure of the site that best help achieving the aims of both the user and the owner of the site. From the point of view of the owner (the entity that materially supports the site), the need for such a constant labor-intensive effort implies very high financial and personnel costs.
All these problems can be addressed by automating a web site [1]. For example, a system that automatically rec-ommends pages to users, according to their interests, can help them to navigate through the Web. Another exam-ple is a system that automatically gathers content and organizes them in a web site, reducing the editor’s effort and, consequently, the costs for the owner. Additionally,
the owner can have his/her decisions supported by a sys-tem that monitors the site. However, the success of the automation can only be achieved if a complete record of activities on the web site is available. Thus, the design of a suitable infrastructure to collect and store information regarding the activities on a web site becomes an essential step for successful web site automation.
In this paper we propose a data warehouse architec-ture to serve as a repository of information concerning the usage, content, and structure of a web site. Additionally, we also propose an extraction, transformation, and load-ing (ETL) process for web data, which is implemented as a composition of different existing pre-processing tools. This work was first introduced in an earlier paper [2], where preliminary ideas were described. In this paper we present a consolidated version of the data warehouse, compare it against several data warehouses proposed in the literature, and test it in three different applications for web site automation. The first is a simple application that illustrates how the data warehouse can be used to com-pute a set of well-known metrics to assess the effectiveness of an e-commerce web site [3]. Next, we have a more com-plex application, where the data warehouse is used as a repository of information to feed recommender systems in an e-learning web site, as well as tools to evaluate and monitor their performance [2]. Finally, we have a much more complex application, which is concerned with a tool to monitor the quality of the metadata describing content in an e-news web portal [4].
The paper is organized as follows: In Section ‘Web site automation’, we describe web site automation and its applications. The web data which are used for web site automation are presented in Section ‘Web data’. In Section ‘A data warehouse for web site automation’, we present the proposed data warehouse in details. We also present the ETL process used to load data into the data warehouse (Section ‘Extraction, transformation, and loading process’). The three case studies that demonstrate how the data warehouse can be used to support web site automation and monitoring activities are presented in Section ‘Using the data warehouse for web site automation.’ Finally, we present related work (Section ‘Related work’) and conclusion (Section ‘Conclusions’).
Web site automation
Web site automation has emerged as a solution to auto-mate several personalization and management activities of a web site, such as content retrieval [5], monitoring and management of existing content and structure [6], recommendation of content [7], and adaptive personaliza-tion [8]. One of the goals of automapersonaliza-tion is the reducpersonaliza-tion of the editor’s effort and, consequently, of the costs for the owner. An equally important goal is that the site can more timely adapt to the behavior of the user, improving
the browsing experience and helping the user in achieving his/her own goals, thus increasing the user’s loyalty.
In a web site, different aspects can be automated:
Structure: Paths can be suggested by the site according to common trails taken by users; products and pages can be recommended if the site recognizes the users and their preferences; the whole structure of the site can be person-alized so that a different sequence of pages and hyperlinks for each user is presented.
Layout: The number, the size, and the location of graph-ical elements can change automatgraph-ically. Words can be emphasized if the site perceives the user’s interest.
Content: New relevant content can be sought and gath-ered automatically according to user’s perceived or par-tially specified interests; new content can be automatically classified, summarized, and organized.
Performance: Web usage patterns can be used to optimize web caching systems in order to improve the performance of the accesses to web servers.
Web site automation can also be used to implement monitoring tools in order to support the editor in guaran-teeing the quality of the site. This is particularly important if personalization methods are used by the site, because the monitoring activities allow the editor to assess the performance of the site and the success of the personaliza-tion methods used to improve it. Examples of monitoring activities include the following:
Usage: The paths which the users take during their accesses, the efficiency of pages/hyperlinks in guiding the users to accomplish their goals.
Users: How users are grouped taking into account their browsing behavior, how groups change with time, and how groups of users relate with the success of the site.
Data quality: How adequate the content and metadata of a web site are.
Automation: The effect of personalization actions, for instance, whether the users are following the recommen-dations of products and pages or not.
At a glance, web site automation promotes the effec-tiveness of our relationship with a web site. Some appli-cations/methods which are commonly used for web site automation are the following:
Web personalization/recommendation: The user naviga-tion behavior can be used to personalize web pages by making dynamic recommendations (e.g., pages, services, etc.) for each web user [7].
Automatic summarization of content: The goal is to auto-matically construct summaries from the web page text content [10]. An example of such application is the pre-sentation of summaries (i.e., snippets) by search engines.
Extraction of keywords from web pages: A keyword is a word or a set of words which characterizes the content of a web page or site and is used by users in their search process. Using content and usage information from a web page/site, we can extract/identify keywords which attract and retain users [8].
Web page ranking: Hyperlinks can be used to rank web pages, in accordance with the interest of the user, such as in search engines [11].
Web caching improvement: The access patterns extracted from web logs can be used to extend caching policies in order to improve the performance of web accesses [12].
Clickstream and web log analysis: Logs can also be used to perform other types of analyses, from simple access statistics to user behavioral patterns, that help to improve the quality of web sites [13].
Analysis of web site topology: Web logs and hyperlinks are used to analyze the topology of a web site and improve its organization, possibly reducing the number of alterna-tive pages/hyperlinks that must be considered when we browse a web site [14].
Identifying hubs and authorities: Hyperlinks can also be used to identify hubs (directory pages) and authorities (popular pages) [15]. A hub is a page that points to many other pages. An authority is a page that is pointed to by many different hubs.
Identifying web communities: Hyperlinks can be used to identify web communities, which are groups of pages sharing the same subject [16].
OLAP analysis: The historical evolution of web data (e.g., usage, content, and structure data) is analyzed on several perspectives/dimensions [17].
Web data
In web mining, data can be collected at the server-side, client-side and proxy server, and/or obtained from an organization’s database (business or consolidated web data). Different types of data can be used in web mining and, consequently, in web site automation [18]:
Content - the actual data in web pages. These usually con-sist of structured and unstructured textual content as well as other multimedia content.
Structure - data that describe the organization of the pages. These include intra-page structure information (the layout of various HTML or XHTML tags within a given page) and interpage structure information (the hyperlinks connecting one page to another page).
Usage - data that describe the usage of web pages (accesses), such as IP addresses, page references, and date
User profile - data that provide information about the users of the web site. These include data from registration and customer/user profile.
In this work, we focus on usage, content, and structure data, given that they are used as inputs for the most com-mon web site automation applications [8,18]. However, there are other web data which can be collected and used to automate a web site. For example, Li et al. [19] designed a web browser that collects information about the user’s behavior regarding his/her time spent on a page, sequence of clicks, and scrollbar activities in a web page.
To prepare these data for web site automation, a signif-icant amount of pre-processing is necessary. Usage data can be obtained from web access logs and/or page tag-ging, which consist in pieces of code on a page to notify when the page is accessed [13,20,21]. Here, we focus on web access logs as usage data. The pre-processing of web logs is likely the most difficult task in the pre-processing of web data due to the quality (incompleteness, noise, etc.) of the available data [13,20].
To prepare content and structure data, the web pages must be downloaded and processed locally. Structure data are provided as hyperlinks connecting web pages. While textual content in static pages is typically easy to process, multimedia components as well as any type of content in dynamic web pages present a harder challenge. Later in this paper, we present an ETL tool for pre-processing usage, content, and structure data before loading them into the data warehouse.
A database to store rich web data is an essential compo-nent for a web site automation system [1]. Transactional databases are designed to maintain speed and efficiency for use in day-to-day business operations such as insert-ing, updatinsert-ing, and deleting of transactions. On the other hand, data warehouse systems essentially serve to support decision making and data analysis, which can be used to automate a web site. In the next section, we propose a data warehouse to be the repository of web data to support web site automation.
Methods
A data warehouse for web site automation
A data warehouse is more suitable than a traditional database system because web site automation is essen-tially an analytical task and the latter are more adequate for transactional data.
are site-independent web data and can be used to support several web site automation and monitoring activities.
The goal is to develop an architecture with the widest possible applicability. However, we recognize that many web sites may store data that are specific to their domain of application or to their implementation. For example, a content management system (CMS) stores metadata (data describing content) which vary significantly across sys-tems. Therefore, in this work, we focus on the part that is independent of the site.
The site-independent part of our data warehouse is rep-resented by usage, content, and structure data, which are extracted from two sources of data that are uni-versally available: web access logs and web pages. It is modeled based on a star schema that is represented by centralized fact tables which are connected to multi-ple dimension tables. Additionally, we have some auxil-iary tables attached to dimension tables. These auxilauxil-iary tables (i.e., Parameter Page andParameter Referrer) are neither fact nor dimension tables, but just normalized relational tables to make the usage of parameters of a uniform resource identifier (URI) easier. In our data ware-house, the relationship between a dimension table and an auxiliary table is 1 : N. This schema is simple and
has a good response time. It is modeled as shown in Figure 1.
To design the schema, we followed the four steps methodology proposed by Kimball and Ross [30]. The construction of a data warehouse is an iterative process, and the methodology was repeated several times to clar-ify the business problems and the information needs. In the following, we discuss our facts and dimensions, giving an overview of the tables and their data fields in our data warehouse:
Fact tablestructure: This table stores information for each hyperlink in the web site, keeping the history of the web site topology. Each record contains thehyperlink, its
label, and its typeas ‘interior’ (hyperlinks that point to an anchor in the same page), ‘local’ (hyperlinks that point to another page stored at the same web site), or ‘global’ (hyperlinks that point to a page on a remote server). Fact tableusage: This table is filled with data about accesses/requests to pages of the web site. These data can be used to analyze the navigation behavior of users. The table is designed to include themethodof the request (for example,GETorPOST), number ofbytesreturned in the request,statusthat indicates the action taken in response
of a request,protocolversion used by the browser during a request, andtime spenton the web access.
Fact tablecontent: Representation of web page content and its changes is registered in this fact table. It may con-sist, for example, of a copy of the content or a summary. Recording the changes in a content allows to analyze its evolution. Moreover, details about the content can be use-ful to classify or rank the pages in a web site [31]. This table stores thetitleand therepresentationof a page. Dimension tablesession: A session consists of a sequence of pages accessed during a single visit in a web site. This table is designed for including thesession length, thetime spent on the session, the client hostof the session, and theuser agentthat can indicate the operating system and browser software used by the user during the session. As we still do not have a satisfactory way to decompose the user agent, we store it as an atomic value.
Dimension tableuser: Identification of the user is very important to distinguish different types of visitors to the web site. This dimension should contain at least two pieces of information:identificationand locationof the users.
Dimension tablereferrer: The referrer dimension identi-fies the page containing the hyperlink that was followed to the current page. In our data warehouse, each refer-rer page contains some simple descriptors identifying location (uri),host, and typeofreferrer such as local or global.
Dimension tablestimeanddate: The time and date
dimensions are very important in all data warehouses because each fact table is a time series of observations of some kind. In this data warehouse, the time dimension stores thehour,minute, andsecondfor each observation,
and the date dimension stores theday,month,year, and
week dayof the observations.
Dimension tablepage: The page dimension stores all
pages/items which we want to analyze in terms of struc-ture, usage, and content. Here, we use the data fieldurito register the URI for each page/item.
Parameter pageandparameter referrer: These two tables store thenameandvalueof the different parameters of a URI in order to provide a more flexible way to query the fact tables. For example, in Section ‘Measuring the effectiveness of an e-commerce web site’, the description of a laptop is accessed in a web site by the URI ‘/product_ info.asp?product=laptop’. In this URI, the name and value of the parameter are obtained by parsing the ‘?’ and ‘=’ elements in the URI. The element?separates the parame-ter from the URI. The element=separates the parameter name ‘product’ and its value ‘laptop’. An example of query using the fields in the tableParameter Pageis presented.
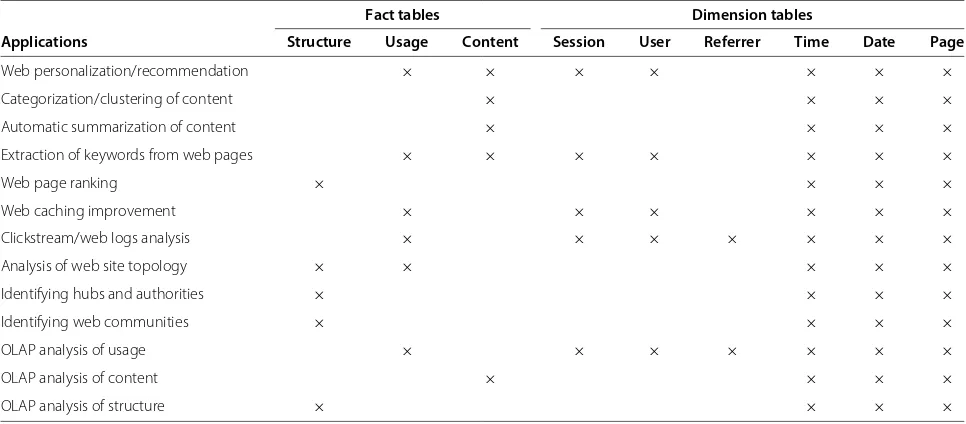
In Table 1, we indicate the parts of the data warehouse schema that can be used to support some of the most common applications for web site automation (presented in Section ‘Web site automation’). To build the table, we first identified which are the input data for the applica-tions. Then, we analyzed our schema in order to identify which tables of the data warehouse provide such data. Given that usage, content, and structure data are stored independently, we can use the data warehouse even if not all the different types of data are available. For instance, it can be used when it is only possible to access a web site as a regular user, without having access to the log files. In this case, we can store structure and content information and still be able to perform categorization/clustering of
Table 1 Relationship among the tables from the proposed data warehouse and some of the most common applications for web site automation
Fact tables Dimension tables
Applications Structure Usage Content Session User Referrer Time Date Page
Web personalization/recommendation × × × × × × ×
Categorization/clustering of content × × × ×
Automatic summarization of content × × × ×
Extraction of keywords from web pages × × × × × × ×
Web page ranking × × × ×
Web caching improvement × × × × × ×
Clickstream/web logs analysis × × × × × × ×
Analysis of web site topology × × × × ×
Identifying hubs and authorities × × × ×
Identifying web communities × × × ×
OLAP analysis of usage × × × × × × ×
OLAP analysis of content × × × ×
content, analysis of web site topology, web page ranking, and OLAP analysis of structure and content, among other automation activities.
In summary, we can say that our data warehouse is a more generic and complete option given that it stores usage, content, and structure, which are web site-independent data, and supports the development of dif-ferent types of application for web site automation. In the following section, we describe how web data are loaded into the data warehouse using an ETL process.
Extraction, transformation, and loading process
The data to be stored in the data warehouse are collected from multiple sources, including text files, transactional databases, and/or by crawling web sites. The ETL pro-cess is presented in Figure 2, and we have developed it as a composition of different existing tools. As the name indicates, it is done in three steps:extraction, pre-processing/transformation, andloading. In theextraction
step, the process creates a local version of (the possibly remote) the web site and access logs. This local version is stored in the data staging area (DSA), a simple direc-tory in the file system. For this task, we useWget[32] and
Scp [33].Wget is a free software for crawling/retrieving remote files using HTTP, HTTPS, and FTP, which are the most widely used Internet protocols. Scp is a software implementing the SCP protocol for secure copying of files between a local and a remote host or between two remote hosts.
In the following step, the local version of the site and logs are pre-processed and transformed to useful informa-tion ready to be loaded into the data warehouse. For web pages, the process reads the HTML files and writes clean and well-formed markup in XHTML format [34]. For this task, we useTidy [35]. This is an open source software
and library for checking and generating clean and well-formed XML/XHTML/HTML files. The pre-processing of the access logs consists of merging the log files, remov-ing irrelevant requests and/or data fields, removremov-ing robot requests, and identifying users and sessions for the local version of the access logs. We useWUMPrep[36], a col-lection of Perl programs supporting data preparation for data mining of web logs.
After being pre-processed, the data are transformed in order to fill in the data fields in the data warehouse. To illustrate the process, we present a summary of the operations carried out for some of the tables:
Fact tablestructure: The ETL process makes searches for hreftags in web pages and collects the URI (hyperlink) and its label.
Fact tableusage: For most of the data fields, a parse is performed to extract the data from the web access logs. The exception is the data fieldtime spent. For this one, a rough calculation is measured as the difference between two consecutive accesses registered in the web logs.
Fact tablecontent: Here, the web page (in XHTML
for-mat) is parsed, and the free-form text can be used as the representation of the content or it can be summarized to create a new representation for the content. Besides that, a search for thetitletag is carried out to extract the title of the page.
Dimension tablesession: Session identification is based on cookies, if present. Otherwise, a simple heuristic con-cerning the time between two accesses is used to divide sessions [13,20].
At this point, we are ready to load the web data into the data warehouse. For theloadingstep, we implemented
two components, etlHtml and etlLog, that use simple
SQL commands [37] to load data into the data warehouse. Additionally, to handle data collected from a transac-tional database, we developed a component, calledetlDb, to select data, pre-process, and load them into the data warehouse. This component, based on SQL commands, is especially used when a web site is managed by a content management system.
Results and discussion
Using the data warehouse for web site automation In this section, we present three case studies to demon-strate how the proposed data warehouse can be used to support web site automation and monitoring activities. Each case study addresses a different problem in a dif-ferent scenario. In the first case study, we use our data warehouse to store web data from an e-commerce web site. With the data stored in the data warehouse, Carneiro [3] was able to compute a set of well-known metrics to assess the effectiveness of the e-commerce web site. In the second case, we use our data warehouse as a repos-itory of information to feed recommender systems in an e-learning web site, as well as tools to evaluate and moni-tor their performance [2]. In the last case study, we present a more complex application, where the generic part of the data warehouse must be complemented with a more complex domain-specific part. This case study is con-cerned with a tool to monitor the quality of the metadata describing content in an e-news web portal [4]. For each case, we describe the functionalities implemented, show how the data warehouse supports them, and present some results.
Measuring the effectiveness of an e-commerce web site In this section, we demonstrate how our data warehouse is used to assess the success of a web site in terms of the ability of its pages to attract users and make them customers. For this proposal, we store web data (i.e., usage, content, and structure data) from an e-commerce web site. Then, Carneiro [3] uses the data stored in our data warehouse to calculate three metrics proposed by Spiliopoulou and Pohle [38] for measuring the success of a web site:contact efficiency,relative contact efficiency, and
conversion efficiency. These metrics are defined as follows [38]:
Contact efficiency: The contact efficiency of an action pageiais the ratio of sessions containingiato all sessions
Sin the web access data. Anaction pageis a page whose access indicates that the user is pursuing the goal of the site. For example, an e-commerce web site, which has as goal to sell products, can have the pages with information about the products as action pages. By computing the con-tact efficiency value for each action page, we can identify the impact of each page on the overall success of a site in
engaging visitors. The contact efficiency for a pageia is given by
Contacteffia=|{s∈S|i a∈s}|
|S| . (1)
Relative contact efficiency: The relative contact efficiency of an action pageia is the proportion of active sessions containing this page within the set Sa that contains all active sessions. An active sessionsa ∈ Sa is defined as a session containing at least one action page. This met-ric expresses the relative importance of each action page within a site. The metric is given by
Rcontacteffia=|{s
a∈Sa|ia∈sa}|
|Sa| . (2)
Conversion efficiency: The conversion efficiency of an arbitrary page i to a target page it over a set G of all sessions containing accesses from i to it is defined as the ratio of the cardinality of G to the cardinality of all active sessions containing i. A target page is a page whose access indicates that the user achieved the goal of the site. For example, an e-commerce web site can have the page for ordering or paying for a product as target page. This metric estimates the success of an arbitrary page in helping/guiding the users toward a target page. With this metric, we can study the impact of each page in the success of the site and identify pages which have low conversion efficiency and require improvements. The conversion efficiency is given by
conveffi,it,G= |G|
|{sa∈Sa|i∈sa}|. (3)
To calculate these metrics, we need to determine which are the action and target pages. Typically, this can be done simply by analyzing the URLs (e.g., a URL containing ‘.../ product_info.asp?...’ is an action page and one containing ‘.../order.asp?...’ is a target page). Once we have determined the action and target pages, collecting data from the data warehouse to calculate the metrics is quite simple. For example, we can compute the contact efficiency metric by using the values obtained with the SQL queries presented in Figures 3 and 4.
The data for the three metrics are in the fieldssession_id
from the tableSession,urifrom the tablePage, andname
and valuefrom table Parameter Page that additionally use the tableUsageto establish a relationship among them (see Figure 1).
Figure 3Query to count all different sessions containing action pages about laptops.This value is the numerator in the equation of the contact efficiency metric.
are action pages and the page for ordering products is the target page. We computed the three metrics for each page in the 81 families of products and aggregated the results by the types of products pages (accessories, com-ponents, computers, consumables, images, peripherals, networks/communications and software). The values for the three metrics are presented in Table 2.
A positive surprise in Table 2 is that the type of product page Software with low values for the metrics contact effi-ciency and relative contact effieffi-ciency, turns up with a good value for the conversion efficiency. Another surprise, but with negative impact, is the product pages for Comput-ers with a not so good value for the convComput-ersion efficiency metric: 0.99%. Moreover, the type Computers has the low-est conversion efficiency although it has a high value for contact efficiency (the fourth highest).
Generating and monitoring recommendations in an e-learning web site
In this case study, we show how the proposed data ware-house supports the building and monitoring of mender systems for web sites. Here, we use two
recom-mendation models (we called themrecommender_1and
recommender_2) based on the item-based collaborative filtering technique [39], where an item is an accessed web page.
To build the similarity matrix (recommendation mo-del) between all pairs of items,recommender_1uses the cosine angle as similarity metric, which is defined as
sim(i1,i2)=cos −→
i1,−→i2
= − →
i1.−→i2
−→i1∗−→i2
, (4)
where −→i1 and−→i2 are binary vectors with as many posi-tions as existing users. The value 1 means that the users
accessed the respective item/page. The value 0 is the opposite. The ‘.’ denotes the dot product of the two vectors. For _2, we introduce an adjustment to the similarity metric, as defined below:
sim(i1,i2)=cos −→
i1,−→i2
∗depth_weight(i1,i2), (5) depth_weight(i1,i2)=log2(min(depth(i1), depth(i2))), (6)
where depth(i1) and depth(i2) are the current depth of the items i1 andi2 on the site navigation tree and min is a function which returns the minimum value. The adjustment introduced by depth_weight favors the rec-ommendation of items which are placed deeper in the navigation tree. This increases the probability that more specific items are recommended.
The data used by the algorithms to compute the cosine angle are in the fieldsidentificationandurifrom the tables
User andPage that additionally use the table Usage to establish a relationship between them. Theuriand hyper-link of the tablesPageandStructureuse the data fields
day, month, and year from the table Date to indicate which version of the site’s structure must be retrieved to compute the adjustment factor (see Figure 1).
To monitor and evaluate the models online, we define two metrics: adhesion and efficacy. The adhesion is calcu-lated as the percentage of accesses to the web site which are recommendations followed by the users:
Adhesion= |R|
|A|×100, (7)
whereAis the set of all accesses in the web site andRis the set of accesses representing recommendations/hyperlinks that were followed by the users.
Efficacy is calculated as the percentage of followed rec-ommended hyperlinks that lead to page visits longer than
Table 2 Efficiency results per type of product page
Type of product page Contact efficiency (%)
Relative contact efficiency (%)
Conversion efficiency (%)
Accessories 9.21 14.41 5.10
Components 20.97 32.82 4.56
Computers 8.26 12.92 0.99
Consumables 2.26 3.53 4.52
Images 2.55 3.99 3.11
Peripherals 16.83 26.33 4.36
Networks/ communications
6.57 10.28 3.58
Software 1.35 2.11 3.89
10 s, but which are not the last in the session. The time spent on a page visit is measured as the difference between two consecutive page visits. This is obviously a proxy for the real time spent on the page, which is not available. However, it is impossible to calculate the time spent on the last access because there is no subsequent access. In this case, we exclude the last access from the calculation [21]. The definition thus is
Efficacy= |R10|
|R| ×100, (8)
whereRis the set of all recommended hyperlinks which were followed andR10is the set of followed recommended hyperlinks that lead to page visits longer than 10 s and that are not the last in the session.
The information of which system (_1or_2) generates the recommendation is associated to the URI of a web access. Therefore, the data to calculate the adhesion met-ric, for a given period of time, are in the fieldsurifrom the tablePage, andday,month, andyear from the table
Datethat additionally use the tableUsageto establish a relationship among them (Figure 1). To calculate the effi-cacy metric, we collect data from the fieldsuriin the table
Page;time_spent from the tableUsage; andday,month, andyearfrom the tableDate.
Using our data warehouse as a repository of informa-tion, we implemented recommendation and monitoring in the web site of a computer science course [2]. The site has a simple structure including a search engine and a tree view menu with hyperlinks to 289 pages. These contain notes and exercises related to graphical user interfaces. The site receives about 315 accesses daily.
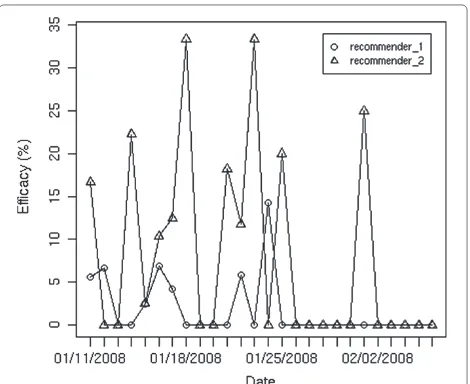
We collected data for 21 days and built the initial mod-els using these data. Then, we monitored the following 26 days. In Figures 5 and 6, we present some results. Comparing the values in both figures, we see that the
recommendations produced by _2 are more frequently
followed than the ones produced by _1and that a user
Figure 5Evolution of the recommendation adhesion rate.
spends more time on recommendations of_2. This possi-bly means that the recommendations generated by_2are shortcuts to the deeper parts of the site, which actually contain the information that the user is looking for.
Monitoring the quality of metadata in an e-news web portal The goal of many web portals is to select, organize, and distribute content (e.g., information, services, and/or products) in order to satisfy their users/customers. The methods which support such a goal are to a large extent based on metadata (e.g., keyword, category, author, and other descriptors) that describe content and its properties. For instance, search engines often take into account key-words that are associated with a content to compute its
relevance for a query. Likewise, the accessibility of a con-tent by navigation depends on its position in the structure of the portal, which is usually defined by a specific meta-data descriptor (e.g., category). Nevertheless, if the set of keywords or categories assigned to a content is inappro-priate, a user may fail to find such content. Therefore, it is essential to monitor the quality of metadata describing the content to ensure that the collection of content is made available in a structured, interrelated, and easily accessible way to the users.
In this section, we show how our data warehouse sup-ports EdMate, a system to monitor the quality of metadata in web portals/sites [4]. As mentioned above, it is very important to ensure that the metadata are of good quality. Our implementation of the EdMate incorporates 31 met-rics for measuring the quality of content metadata, which we designed based on data quality principles [38,40,41]. Table 3 presents a few examples for illustration purposes. The complete list of metrics for measuring the quality of content metadata is presented in Domingues et al. [4].
The functions used to compute the metrics can be based on very simple statistics or more complex meth-ods. For instance, the metric Length of metadata II is computed simply by counting the number of words in a metadata field. Metrics based on simple frequencies, such as theFrequency in search(Table 3), are quite common. Alternatively, metrics can be based on probabilities. The
Redundancy of metadata values metric is based on the conditional probability of having a valuex, in the descrip-tion of content, given that an another value y is used (Table 3). An example of a more complex method is given by association rules [42], which are used to compute the
Association between metadata values metric (Table 3). The computation of the metrics is usually based on the metadata. However, in some cases the information about usage, content, and structure can also be used. For exam-ple, the usage data are used in the Frequency in search
metric.
As already stated, in this case study, the generic part of the data warehouse is complemented with a more
complex domain-specific part. The added tables are rep-resented by the dashed tables in Figure 7. Here, we illus-trate the use of our data warehouse by explaining the data that are used in the computation of the metricLength of metadata II. This metric uses data that are in the fields
type and value from the table Metadata, uri from the tablePage, andday,month, andyearfrom the tableDate
that additionally use the tableContentto establish a rela-tionship among them. The data in the fieldsday,month, andyearare used to indicate which version of the page and its metadata must be retrieved. This is necessary because the data warehouse stores periodically the content of the web site to make possible the analysis of its evolution. The tableMetadata, which stores thetypeandvaluefor all metadata of a content, belongs to the domain-specific part of the data warehouse.
The metric is stored in the fact table Metric Length of Metadata II. Each metric is stored with information related to it (e.g., type of metadata assessed by the metric, page which the metadata are associated to, etc.). However, as the information may vary depending on the metric, we decided to design one particular table for each met-ric. The fact tableMetric Length of Metadata II, which belongs to the domain-specific part of the data warehouse, was designed to store the metricLength of metadata II. It stores the type of metadata that is assessed (foreign key
metadata_type_id), when the metric is calculated (for-eign keydate_id), the web page which the metadata are associated to (foreign keypage_id), and thevalueof the metric.
Once we have the metric Length of metadata II
cal-culated, we can compute its statistical indicators and graphics. First, we retrieve all values from the fact table
Metric Length of Metadata II. Then, we use the retrieved values to compute the statistical indicators (for this met-ric, minimum, and maximum values) and plot graphics showing the evolution in time of the values. The statis-tics and graphics are stored in the fact tablesStatistics
andGraphics, which are very close each other in terms of structure (see Figure 7).
Table 3 Name and description of a few metrics
Name Description
Length of metadata II Number of words in a metadata field. Extremely large or small values may indicate an inadequate choice of metadata to represent the content
Association between metadata values The confidence level of an association ruleX→Yis an indicator of whether the set of valuesXmakes the set of valuesYredundant or not. The higher the value, the more redundantYis expected to be. This may indicate that implicit practices in the description of content have been developed
Frequency in search Number of metadata values in the web access logs. For instance, the frequency of a search using a given keyword. If such a keyword is often searched, probably it will have a high interpretability
Figure 7Star schema of the data warehouse emphasizing the tables used in the computation and storage of the metricLength of metadata II.The characters ‘#’ and ‘*’ indicate that the field is a primary or a foreign key in the table, respectively.
The tableStatisticsstores the type of statistical indi-cator (foreign keystatistic_type_id) and thevaluefor the statistic. The table Graphics stores the type of graphi-cal representation (foreign keygraphic_type_id) and the
file name for the graphic. Additionally, both tables also store the metric used by the statistics or graphics (foreign keymetric_type_id), the type of metadata assessed by the metric (foreign key metadata_type_id), and the date of computation (foreign keydate_id). The types of statisti-cal indicators, metrics, metadata, and graphics are stored, respectively, in the dimension tables Statistic Type,
Metric Type,Metadata Type, andGraphic Type. With the metrics, statistical indicators, and graphics computed, the EdMate system generates a report, which is accessed using a web browser. In Figure 8, we present a screen of the EdMate system showing the metricLength of metadata II. At the top, we have some information about the data which we are analyzing, such as number of con-tent items, accesses and users, range of the logs, and so forth. In the middle, we can see the statistical indicators of the metric: minimum and maximum values. Finally, at the bottom, we can see the evolution of the metric in graphical representations.
We can explore the metrics from different angles using OLAP analysis [43]. For instance, if the global value of the metric Length of metadata II is very large, we may
have a more detailed view, e.g., by analyzing its values aggregated by day (drill down operation). Furthermore, graphical representations of the values are used to detect interesting events. For instance, they may be used to pro-vide information of context, which helps the detection of unusual values. The evolution of minimum values may show, for instance, that although the current values are acceptable, they have been decreasing. This could mean that the content is being described less carefully.
With respect to the performance of the EdMate system and its accesses to the data warehouse, our tests showed that EdMate has a good performance, enough to allow the computation of the metrics, statistics, and graphics in which the web reports are based during the night and the analysis of them during the day.
Figure 8EdMate screen showing a kind of content metadata analysis.
filling in a rich set of metadata fields, including keywords, categories, relevant companies, source, and authors. Thus, monitoring the metadata fields and detecting unusual val-ues and correcting them, are very important to PE because it can guarantee the quality of the metadata and, conse-quently, add value to the content.
Figure 9Evolution of the number of keywords with frequency 1 (Metric: Singleton metadata values).
An example of a particularly important metadata is key-words, which characterize the content of a web page or site and are used by users in their search process. Since the access to a content (e.g., using a search engine) is affected by the quality of the keywords describing the content, we applied the EdMate system to monitor the quality of this
Figure 11Relationships between keywords obtained using association rules (Metric: Association between metadata values).
metadata in the PE. The keywords monitored are rela-tive to the period April/September 2004b. In this period, we have 17,196 content items and 124,287 web accesses recorded.
Figure 9 presents a simple example that illustrates the type of analysis that can be carried out with EdMate. The metric represented in the figure is the number of keywords which are used only once. Higher values of key-words with frequency equal to 1 may indicate that the potential of the keywords to interrelate content from dif-ferent sources is not being adequately exploited or that these keywords with frequency equal to 1 are typographi-cal errors.
The results obtained with EdMate are not only useful to detect data quality problems but also to trigger corrective actions and monitor them. Figure 10 shows that in April more than 50% of the content did not have any keyword filled in. This reduces the probability that these contents will be returned by the search engine of the web portal. To address this problem, the PE decided to implement a semi-automatic procedure to support the process of filling in keywords. The same figure shows that this caused a steady reduction in the number of contents without keywords, thus improving the quality of the metadata.
The two metrics described above are quite simple. More complex metrics may be interesting and can be imple-mented based on the data warehouse. For instance, the
Association between metadata valuesmetric uses the con-fidence of association rules to determine keywords more frequently used together. The EdMate system collects from the data warehouse the keywords of each content as baskets of items. Then, it runs an association rules algo-rithm on the baskets to generate the associations among the keywords. In Figure 11, we see a graphical represen-tation of the associations showing that often a general keyword (e.g., fiscality -fiscalidade) is associated with a more specific one (e.g., international taxation -tributação internacional). This implicit structure of the keywords, unveiled by the discovered association rules, enables the detection of incorrect descriptions.
Related work
In this paper, we also analyze our data warehouse against the other alternative ones presented in the literature. In Table 4 we compare the data warehouses in terms of archi-tecture (i.e., star schema or snowflake schema), number of fact tables, and number of dimension tables. In the table, we see that most data warehouses, including our
Table 4 Comparison of data warehouses
Data warehouse Architecture Number of fact tables Number of dimension tables
Zaïane et al. 1998 [29] Star schema 1 9
Buchner and Mulvenna 1998 [23] Snowflake schema 1 5
Bonchi et al. 2001 [22] Star schema 1 2
Joshi et al. 2003 [25] Star schema 1 5
Hu and Cercone 2004 [24] Star schema 2 8
Wu et al. 2004 [28] Star schema 1 3
Thor et al. 2005 [27] Star schema 2 9
Velasquez and Palade 2008 [8] Star schema 1 7
Moya et al. 2011 [26] Snowflake schema 3 4
et
al.
Journal
o
ft
he
Brazilian
C
omputer
Society
2014,
20
:11
Page
14
of
16
Table 5 Relationship among data warehouses, web data, and some of the most common applications for web site automation
Data warehouses
Zaïane et al. Buchner and Bonchi et al. Joshi et al. Hu and Wu et al. Thor et al. Velasquez and Moya et al. Our
1998 [29] Mulvenna 2001 [22] 2003 [25] Cercone 2004 [28] 2005 [27] Palade 2008 [8] 2011 [26] proposal
1998 [23] 2004 [24]
Web data
Usage × × × × × × × × ×
Content × × × × ×
Structure × ×
Applications
Web personalization/recommendation ⊗ ⊗ ⊗ ⊗ × × × × ×
Categorization/clustering of content ⊗ ⊗ ⊗ ⊗ ×
Automatic summarization of content ⊗ ⊗ ⊗ ×
Extraction of keywords from web pages ⊗ ⊗ × ×
Web page ranking ⊗ ×
Web caching improvement ⊗ ⊗ × ⊗ ⊗ ⊗ ⊗ ⊗ ×
Clickstream/web logs analysis × × ⊗ × × × × × ×
Analysis of web site topology ⊗ ×
Identifying hubs and authorities ⊗ ×
Identifying web communities ⊗ ×
OLAP analysis of usage × × ⊗ × × × × × ×
OLAP analysis of content × ×
OLAP analysis of structure ×
proposal, are based on the star schema and that they vary in numbers of fact and dimension tables.
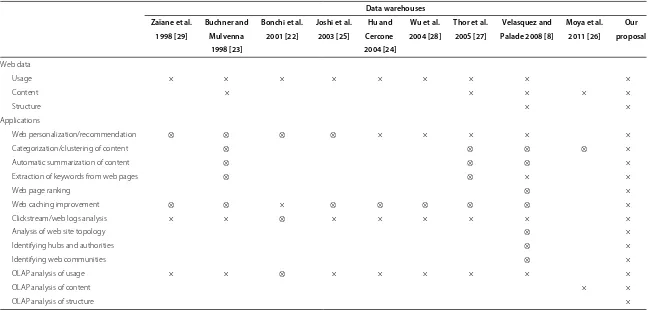
Table 5 summarizes the capabilities of the data ware-houses that were proposed for web sites, in terms of the type of data they can store and the applications they support.
Although most of the data warehouses are developed to support some applications in particular, we see in Table 5 that they can also be used to support other web site automation applications.
The analysis also reveals that several data warehouses are designed to store only usage data. However, there are some proposals that besides usage also store content and/or structure data. This is the case of Velasquez and Palade [8] that despite focusing their data warehouse on usage data, they also store content and structure data. The data warehouse proposed in Velasquez and Palade [8] stores the usage data in a fact table and the content and structure data in one of the dimension tables. Imple-mented in a Relational Data Base Management System (RDBMS), their data warehouse is mainly used to sup-port offline and online recommendations in order to build adaptive web sites. Offline recommendations consist of hyperlinks to be added to or eliminated from the current site, and (key)words to be used as ‘words to write’ in the current and future pages. Online recommendations con-sist in suggesting pages that can be of interest for each user. Both types of recommendations are created by apply-ing clusterapply-ing algorithms on web data stored in the data warehouse.
Additionally, Table 5 shows that the data warehouses, proposed in the literature, are not designed to perform OLAP analysis of the content and structure of a web site. The exception is the data warehouse proposed in Moya et al. [26], which integrates sentiment/opinion data extracted from web feeds into the data warehouse and allows OLAP analyses of the enriched content.
Finally, we can compare our data warehouse against the others in Table 5 and see that our proposal is capable of storing the three types of web data (usage, content, and structure) and supporting several applications for web site automation, including OLAP analysis of content and structure, which is not supported by the previous data warehouses. We can also see that our data warehouse is closely related, in terms of web data and applications, to the one proposed by Velasquez and Palade [8]. However, our proposal takes the advantage of having fact tables to register the changes of content and structure. This fact is very important because it allows us to analyze the evolu-tion of these data on several perspectives/dimensions.
Conclusions
The goal of web site automation is to exploit usage, content, and structure data to automate several of the
personalization and management activities of a web site. This can hardly be achieved without a complete record of activities on a web site. Designing a suitable infrastruc-ture for this purpose thus becomes an essential step for successful web site automation.
In this paper, we presented a consolidated version of a data warehouse for web site automation. Our proposal has two main objectives: to be the primary source of data for the monitoring activities of a web site (typically carried out by the editor and the owner) and also for the differ-ent web site automation activities. Here, we also compared our data warehouse against several data warehouses pro-posed in the literature and tested it in three different case studies.
In all case studies, the use of the data warehouse was quite simple and with a good response time, mainly because of the simplicity of its structure. Additionally and although different architectures might also be suitable for similar purposes, we believe that our data warehouse is a more generic and complete option and has potential for many other web site automation applications.
As future work, we will study the behavior of the data warehouse in supporting other applications for web site automation. Additionally, we will study a way to design a schema that includes more closely the part of the data warehouse that is dependent of the site.
Endnotes
aFor our purposes, the editor role includes the author
role (i.e., production of content).
bWe only have the authorization to publish results for
this period of time.
Competing interests
The authors declare that they have no competing interests.
Authors’ contributions
MAD conducted the research. CS and AMJ supervised this research. CS, AMJ, and SOR contributed to the case studies. All authors read and approved the final manuscript.
Acknowledgements
This work was supported by FCT - Science and Technology Foundation (SFRH/BD/22516/2005); project Site-O-Matic (POSC/EIA/58367/2004); and grants 2011/19850-9, 2012/13830-9, and São Paulo Research Foundation (FAPESP).
Author details
1Institute of Mathematics and Computer Science, University of Sao Paulo,
Sao Paulo 05508-070, Brazil.2INESC TEC and FEUP, University of Porto, Porto 4099-002, Portugal.3LIAAD/INESC TEC and FCUP, University of Porto, Porto 4099-002, Portugal.
Received: 4 April 2013 Accepted: 20 February 2014 Published: 10 April 2014
References
1. Domingues MA (2010) Exploiting multidimensional data for web site automation. PhD thesis, University of Porto, Faculty of Science, Portugal 2. Domingues MA, Jorge AM, Soares C, Leal JP, Machado P (2007) A data
Portuguese conference on artificial intelligence. Springer-Verlag, Berlin Heidelberg, pp 487–499
3. Carneiro A (2008) Using web data for measuring the effectiveness of an e-commerce site. Master’s thesis, University of Porto, Faculty of Economics, Portugal
4. Domingues MA, Soares C, Jorge AM (2012) Using statistics, visualization and data mining for monitoring the quality of meta-data in web portals. Inf Syst e-Business Manag 11(4): 1–27
5. Escudeiro NF, Jorge AM (2006) Semi-automatic creation and maintenance of web resources with webtopic. In: Semantics, web and mining, joint international workshops, EWMF 2005 and KDO 2005, Porto, Portugal, revised selected papers, volume 4289 ofLNCS. Springer, pp 82–102 6. Escudeiro N, Escudeiro P (2010) Adaptive quality control of web
resources. In: 2010 Seventh international conference on the quality of information and communications technology (QUATIC’10). IEEE Computer Society, pp 487–492
7. Ricci F, Rokach L, Shapira B, Kantor PB (eds) (2011) Recommender systems handbook. Springer
8. Velasquez JD, Palade V (2008) Adaptive web sites: a knowledge extraction from web data approach. In: Frontiers in artificial intelligence and applications. IOS Press
9. Marcacini RM, Rezende SO (2010) Incremental construction of topic hierarchies using hierarchical term clustering. In: Proceedings of the twenty-second international conference on software engineering and knowledge engineering (SEKE’10). Knowledge Systems Institute 10. Wenerstrom B, Kantardzic M (2011) ReClose: web page summarization
combining summary techniques. Int J Web Inf Syst 7(4): 333–359 11. Liu X, Lin H, Zhang C (2012) An improved hits algorithm based on
page-query similarity and page popularity. J Comput 7(1): 130–134 12. Sathiyamoorthi V, Bhaskaran V (2012) Web caching through modified
cache replacement algorithm. In: 2012 International conference on recent trends in information technology (ICRTIT’12). IEEE Computer Society, pp 483–487
13. Das R, Turkoglu I (2009) Creating meaningful data from web logs for improving the impressiveness of a website by using path analysis method. Expert Syst Appl 36(3, Part 2): 6635–6644
14. Hongwei W, Xie L (2009) Adaptive site design based on web mining and topology. In: 2009 WRI World Congress on Computer Science and Information Engineering. Institute of Electrical and Electronics Engineers (IEEE), pp 184–189
15. Benzi M, Estrada E, Klymko C (2013) Ranking hubs and authorities using matrix functions. Linear Algebra Appl 438(5): 2447–2474
16. Sharan A, Gupta S (2009) Identification of web communities through link based approaches. In: International conference on information management and engineering (ICIME’09). IEEE Computer Society, pp 703–708
17. Quafafou M, Naouali S, Nachouki G (2005) Knowledge datawarehouse: web usage OLAP application. In: Proceedings of the 2005 IEEE/WIC/ACM international conference on web intelligence. IEEE Computer Society, pp 334–337
18. Liu B (2011) Web data mining: exploring hyperlinks, contents, and usage data (second edition). Springer, New York
19. Li F, Li Y, Wu Y, Zhou K, Li F, Wang X, Liu B (2008) Combining browsing behaviors and page contents for finding user interests. In: Autonomous systems – self-organization, management, and control. Springer Science+Business Media, pp 149–156
20. Pabarskaite Z, Raudys A (2007) A process of knowledge discovery from web log data: systematization and critical review. J Intell Inf Syst 28(1): 79–104
21. Peterson ET (2004) Web analytics demystified: a marketer’s guide to understanding how your web site affects your business. Celilo Group Media
22. Bonchi F, Giannotti F, Gozzi C, Manco G, Nanni M, Pedreschi D, Renso C, Ruggieri S (2001) Web log data warehousing and mining for intelligent web caching. Data Knowl Eng 39(2): 165–189
23. Buchner AG, Mulvenna MD (1998) Discovering internet marketing intelligence through online analytical web usage mining. ACM SIGMOD Record 27(4): 54–61
24. Hu X, Cercone N (2004) A data warehouse/online analytic processing framework for web usage mining and business intelligence reporting. Int J Intell Syst 19(7): 585–606
25. Joshi KP, Joshi A, Yesha Y (2003) On using a warehouse to analyze web logs. Distributed Parallel Databases 13(2): 161–180
26. Moya LG, Kudama S, Cabo MJA, Llavori RB (2011) Integrating web feed opinions into a corporate data warehouse. In: Proceedings of the second international workshop on business intelligence and the web (BEWEB’11). ACM, New York, NY, USA, pp 20–27
27. Thor A, Golovin N, Rahm E (2005) Adaptive website recommendations with awesome. VLDB J 14(4): 357–372
28. Wu EH, Ng MK, Huang JZ (2004) A data warehousing and data mining framework for web usage management. Commun Inf Syst 4(4): 301–324 29. Zaïane OR, Xin M, Han J (1998) Discovering web access patterns and
trends by applying OLAP and data mining technology on web logs. In: Proceedings of the advances in digital libraries conference (ADL’98). IEEE Computer Society, pp 19–29
30. Kimball R, Ross M (2002) The data warehouse toolkit: the complete guide to dimensional modeling. Wiley, New York
31. Qi X, Davison BD (2009) Web page classification: features and algorithms. ACM Comput Surv 41(2): 1–31
32. Niksic H GNU Wget. Available on http://www.gnu.org/software/wget/. Accessed 09 December 2012
33. OpenBSD Project OpenSSH. Available on http://www.openssh.org/. Accessed 09 December 2012
34. Pemberton S, Austin D, Axelsson J, Celik T, Dominiak D, Elenbaas H, Epperson B, Ishikawa M, Matsui S, McCarron S, Navarro A, Peruvemba S, Relyea R, Schnitzenbaumer S, Stark P (2002) XHTML 1.0 the extensible hypertext markup language (second edition). Specification, world wide web consortium. http://www.w3.org/tr/xhtml1/. Accessed 01 May 2007 35. Raggett D HTML Tidy Library Project. Available on http://tidy.sourceforge.
net/. Accessed 09 December 2012
36. hypKNOWsys WUMprep. Available on http://sourceforge.net/projects/ hypknowsys/. Accessed 09 December 2012
37. Kriegel A, Trukhnov BM (2003) SQL bible. Wiley
38. Spiliopoulou M, Pohle C (2001) Data mining for measuring and improving the success of web sites. Data Mining Knowl Discov 5(1-2): 85–114 39. Deshpande M, Karypis G (2004) Item-based top-n recommendation
algorithms. ACM Trans Inf Syst 22(1): 143–177
40. Moorsel AV (2001) Metrics for the internet age: quality of experience and quality of business, fifth performability workshop. Technical report, Software Technology Laboratory – HP Laboratories Palo Alto. http:// www.hpl.hp.com/techreports/2001/HPL-2001-179.pdf. Accessed 20 November 2007
41. Pipino YW, Leem LL, Wang RY (2002) Data quality assessment. Commun ACM 45(4): 211–218
42. Agrawal R, Srikant R (1994) Fast algorithms for mining association rules. In: Proceedings of the twentieth international conference on very large data bases. Morgan Kaufmann Publishers Inc., San Francisco, CA, USA, pp 487–499
43. Malinowski E, Zimnyi E (2008) Advanced data warehouse design: from conventional to spatial and temporal applications. In: Data-centric systems and applications. Springer
doi:10.1186/1678-4804-20-11