R E S E A R C H
Open Access
A hybrid particle swarm optimization and
harmony search algorithm approach for
multi-objective test case selection
Luciano Soares de Souza
1,2*, Ricardo Bastos Cavalcante Prudêncio
2and Flávia A. de Barros
2Abstract
Background: Test case (TC) selection is considered a hard problem, due to the high number of possible
combinations to consider.Search-based optimization strategiesarise as a promising way to treat this problem, as they explore the space of possible solutions (subsets of TCs), seeking the solution that best satisfies the given test
adequacy criterion. The TC subsets are evaluated by an objective function, which must be optimized. In particular, we focus onmulti-objective optimization(MOO) search-based strategies, which are able to properly treat TC selection problems with more than one test adequacy criterion.
Methods: In this paper, we proposed two MOO algorithms (BMOPSO-CDR and BMOPSO-CDRHS) and present
experimental results comparing both with two baseline algorithms: NSGA-II and MBHS. The experiments covered both structural and functional testing scenarios.
Results: The results show better performance of the BMOPSO-CDRHS algorithm for almost of all experiments. Furthermore, the performance of the algorithms was not impacted by the type of testing being used.
Conclusions: The hybridization indeed improved the performance of the MOO PSO used as baseline and the proposed hybrid algorithm demonstrated to be competitive compared with other MOO algorithms.
Keywords: Multi-objective test case selection; Software testing; Particle swarm optimization; Harmony search; Multi-objective optimization
Background
This work addresses a currently very relevant issue in our industrialized society: the quality of the software embed-ded in products being offered to customers, ranging from a simple cell phone or a microwave oven to cars. Clearly, in competitive markets, companies which develop poor-quality products may quickly lose their customers. Yet, there are several situations in which software failure may cost lives, such as in the aircraft industry. Hence, software companies and organizations which embed software-controlled elements in their products must undergo every effort to drastically reduce and preferably eliminate any defects [1].
*Correspondence: [email protected]
1Federal Institute of Education Science and Technology of the North of Minas Gerais (IFNMG), Humberto Mallard Avenue, Pirapora - MG, Brazil
2Center of Informatics (CIn), Federal University of Pernambuco (UFPE), Recife -PE, Brazil
In order to increase the quality of products, companies perform software testing activities, aiming to detect faults in the software through its execution [2]. The related lit-erature presents two main approaches for software (SW) testing: structural (white box) and functional (black box) testing. Structural testing investigates the behavior of the software through directly accessing its code. Functional testing, in turn, investigates whether the software func-tionalities of the final product are responding/behaving as expected without using knowledge about the code [3].
In both approaches, the testing process relies on the (manual or automatic) generation and execution of one or more test suites (TSs). Each TS consists of a set of (related) test cases and has a different goal. A test case (TC), in turn, consists of “a set of inputs, execution conditions, and a set pass/fail conditions” [3].
The testing process usually deploys some SW metrics to help determining the state of the SW or the adequacy of
the testing itself. Each testing approach deploys different
metrics(quantitative measures) to evaluate the quality of a test suite (or of the testing process as a whole) [4].
For structural testing, the most commonly used met-ric is code coverage, which reveals the amount of source code that is exercised by a particular test suite. Examples of code coverage metrics are statement, branch, condition, path, and function coverage. It is possible to deploy more than one coverage criteria to measure the percentage of code executed by the test suite.
Within the functional approach, the metrics vary
according to the adopted testing method (e.g.,
specification-based testing, use case testing, model-based testing, among others) [1]. In the functional specification-based testing, test cases are created specification-based on the SW requirements and (formal) specifications. This metric is known as requirement coverage. Similarly, for use case testing, the used metric is use case coverage.
As already mentioned, the above cited metrics can be used to evaluate the adequacy of a test suite to exercise a particular SW, with respect to the chosen coverage cri-terion. As such, they are usually named astest adequacy criteria or even more preciselycoverage-based test ade-quacy criterion[5]. A test suite is considered adequate to exercise a given SW when it provides the desired cover-age of the chosen test adequacy criterion. In fact, we seek TSs which fully satisfy the adequacy criterion, with the idea that they would assure a satisfactory level of fault detection.1
It is worth mentioning that the same test suite may be considered adequate to test a SW regarding a particular criterion and not adequate to test the same SW under a different criterion. For instance, consider a white box test-ing scenario which uses statement coverage as adequacy criterion. In this case, an adequate TS would be expected to exercise 100 % of the code statements at least once. However, if the adopted metric is path coverage, an ade-quate TS would be expected to exercise all possible paths in the SW at least once.
Note that, in real testing sets, it is not always possible (due to any testing environment constraints) to test 100 % of the code. In such cases, testers tend to establish less ambitious adequacy criteria, such as testing 90 or 80 % of the code.
Now looking at the testing process as a whole, we note that some of its activities may be very time consuming when manually performed. First of all, the manual cre-ation of test cases can be very complex, due to the number of TC combinations to be considered. Yet, in order to pro-vide test suites which fully attend the adopted adequacy criterion, testers usually produce very large TSs, which also impacts on the time needed to fully execute them. Finally, the results obtained with the execution of each TC must be analyzed.
Clearly, this is an expensive and time-consuming pro-cess, which may reach about 40 % of total costs involved in software development [6]. As such, automation emerges as the key solution for improving the efficiency and effec-tiveness of the testing process, as well as to reduce its costs.
We can cite here strategies and tools for the automatic generation of test suite from some given software speci-fication (e.g., Autolink [7], TaRGeT [8], and LTSBT [9]). Although they speed up the test generation process, these tools/strategies tend to generate very large TSs (regard-less the adopted TC generation approach), in order to fully satisfy the adopted test adequacy criterion. However, as mentioned above, the execution of large TSs is a very expensive task, demanding a great deal of the company’s available resources (time and execution team) [10].
Fortunately, it is possible to identify in large TSs redun-dant TCs concerning a requirement or piece of code (i.e., two or more TCs covering the same requirement or piece of code). Thus, we can envision ways to reduce the TSs in order to fit the available resources without seriously com-promising the coverage of the adequacy criterion and thus the quality of the testing process.
The task of reducing a test suite based on aselection cri-terionis known astest case selection. Given an input TS, TC selection aims to find a relevant TC subset regard-ing the adopted test adequacy criterion, such that the test cases that do not improve the reduced TS coverage can be eliminated. Clearly, the selection criterion relies upon the coverage of the adopted adequacy criterion.
Test case selection
TC selection can be manually or automatically performed. Nevertheless, manual selection is very time consuming, as a huge number of TC combinations must be consid-ered when searching for an adequate TC subset. Besides, it depends upon a human expert’s previous knowledge (the test engineer). As such, it does not always preserve the coverage of the test adequacy criterion [11].
Thus, we investigate here strategies to automate this task. We can identify in the related literature several techniques/strategies for automatic TC selection. On one side, we count on deterministic approaches, among which we cite: data flow analysis [12], symbolic execution [13], dynamic partitioning [14], control flow graphs [15], tex-tual differences in the code [16], model-based testing [17], and TC selection based on a similarity functions [11]. The main problem with these approaches is that they may be inappropriate when dealing with large TSs, since the computational cost may be prohibitive [18, 19].
seeking the solution (reduced TS) that best attends the given test adequacy criterion.
Unlike the deterministic strategies, these search-based techniques are able to deal with large TSs at a feasible cost, delivering very good TC subsets regarding test adequacy criterion coverage. We will detail this approach in what follows, since the present work developed search-based solutions for the TC selection problem.
Search-based test case selection
When analyzing the available search-based strategies, we initially disregard random search since, when dealing with large and complex search spaces, random choices sel-dom deliver a good TC subset regarding the adopted test adequacy criterion.
On the other extreme, we have the exhaustive (brute-force) search strategies, aiming to determine the best reduced TS by enumerating all possible solutions. How-ever, they may be unfeasible for large TSs, due to the high computational cost to evaluate all possible TC combina-tions [19].
We then focus our attention on more sophisticated optimization techniques [21], such as simulated anneal-ing, genetic algorithms, and particle swarm optimization (PSO). These techniques deal with problems in which there is usually a large set of possible solutions (i.e., a large search space). The quality of a solution in a search space is evaluated by an application-specific objective function, which has to be optimized. Optimization techniques aim to find, in a reasonable time, good solutions in terms of the objective function.
In our context, solutions in the search space are TC subsets. The objective function to be optimized measures the coverage of adopted test adequacy criterion offered by each solution. The optimization technique iteratively explores the search space of TC subsets, looking for a solution with highest coverage of the given test adequacy criterion [22, 23].
Note that when the TC selection problem involves more than one test adequacy criterion, the search strat-egy should deploy one objective function to each different adequacy criterion. These cases are properly treated by multi-objective optimization techniques.2
It is worth mentioning here the test environments which must deal with restrictions, such as the available time to execute the TS (see [20]). In such cases, the above cited techniques can also be successfully deployed; however they may reflect the search restriction in some way. Our previous work using PSO falls within this case [23, 24]. In those works, we formulated the TC selection problem as a constrained optimization task in which the objec-tive function to be optimized concerns the functional requirements coverage, and the execution effort is used as a constraint in the search process.
Multi-objective optimization TC selection
So far, few works have investigated the use of multiple selection criteria. Some approaches to this problem com-bine the existing selection criteria into a unique objective function using weights or some other heuristics [25–27].
The main drawbacks of these works are the following: (1) they demand a human expert or previous knowledge in order to set a priori appropriate weights to the multiple criteria or to create heuristics to combine them; and (2) they do not offer to the tester a set of (optional) solutions in terms of the search objective functions, so that tester would have the flexibility to choose the solution that best fits the current testing context.
Considering the above scenario, recent studies have investigated the use of multi-objective optimization (MOO) strategies by mapping each existing selection cri-terion into a different search objective function.
These works use concepts ofPareto optimization[21], returning to the tester a set of solutions which are non-dominated considering the objective functions. This way, the tester/final user is able to verify the relations among the varied objectives and choose the solution that best fits the available resources for test execution. Examples of works within this approach are [28–36], which in its majority adopted evolutionary techniques.
Overview of the developed work
Following this new and promising trend, our current work proposed two MOO algorithms for multi-objective TC selection: (1) the Binary Multi-Objective Particle Swarm Optimization with Crowding Distance and Roul-lete Wheel (BMOPSO-CDR) and (2) a hybrid version (BMOPSO-CDRHS) which combines the BMOPSO-CDR with the Harmony Search (HS) algorithm. Each algorithm provides to the user a set of solutions (test suites) with different combinations of the objective’s values. The user may then choose the solution that best fits the available resources. It is important to highlight that, although the focus of our research is the TC selection problem, the pro-posed algorithms can also be applied to MOO in other contexts.
problem as well, by combining two competitive optimiza-tion approaches. Therefore, this is a promising study area that we will explore further.
In [38], we presented the preliminary experiments which evaluated the proposed algorithms. In the cur-rent work, we provide a more detailed description of the algorithms as well as a deeper experimental analysis. In order to consider a more diverse set of experiments, we addressed both structural and functional testing, differ-ent from [38] which addressed only structural testing. For structural testing, the experiments were performed here using five programs (flex,grep,gzip,sed, andspace) from the Software-artifact Infrastructure Repository (SIR) pro-grams [39]. For functional testing, in turn, two suites from the context of a Motorola mobile device were adopted. The proposed algorithms optimized two objectives simul-taneously: maximize branch coverage (structural testing) or functional requirement coverage (functional testing) while minimizing execution cost (time). We point out that it is not the purpose of this work to discuss which objec-tives are more important for the TC selection problem. Branch coverage and functional requirement coverage are likely good candidates for assessing the quality of a TS, and execution time is one realistic measure of cost.
In the experiments, we initially investigated the influ-ence of the HS parameters on the performance of the proposed algorithms. Following, the proposed algorithms were compared to two baselines: (1) the Non-dominated Sorting Genetic Algorithm (NSGA-II) [40]; (2) the Multi-Objective Binary Harmony Search Algorithm (MBHS) [41]. The proposed hybrid algorithm achieved a statis-tically significant gain in performance compared to the baselines.
The following section (“Methods”) will introduce a formalization of the problem being tackled here. The proposed algorithms will be described in detail. The subsequent section (“Results and discussion”) will present the experiments performed to evaluate the proposed algorithms, discussing the obtained results. Finally, we have the conclusions and future directions of research.
Methods
In the current work, we proposed new MOO algorithms for the problem of TC selection with multiple criteria. An MOO problem considers a set of k objective functions
f1(x),f2(x),. . .,fk(x)wherexis an individual solution for
the problem being solved. The output of an MOO algo-rithm is usually a population ofnon-dominatedsolutions considering the objective functions. Formally, let x and
x be two different solutions. We say thatxdominatesx
(denoted by x ≺ x) if x is better than x for at least one objective function andxis not worse thanxfor any
objective function.xis said to benot dominatedif there is no other solutionxiin the current population, such that
xi ≺ x. The set of non-dominated solutions in the
objec-tive space returned by an MOO algorithm is known as Pareto frontier [21].
As said, we proposed to solve the problem of TC selec-tion with multiple criteria by the hybridizaselec-tion of PSO and HS techniques. The PSO algorithm is a population-based search approach, inspired by the behavior of birds’ flocks [42] and has shown to be a simple and efficient algorithm compared to other search techniques, includ-ing for instance the widespread genetic algorithms [43]. The basic PSO algorithm starts its search process with a random population (also called swarm) ofparticles. Each particle represents a candidate solution for the problem being solved and it has four main attributes:
1. the position (t) in the search space (each position represents an individual solution for the optimization problem);
2. the current velocity (v), indicating a direction of movement in the search space;
3. the best position (ˆt) found by the particle (the memory of the particle);
4. the best position (gˆ) found by the particle’s neighborhood (the social guide of the particle).
For a number of iterations, the particles fly through the search space, being influenced by their own experi-ence ˆt and by the experience of their neighborsg. Par-ˆ ticles change position and velocity continuously, aiming to reach better positions and to improve the considered objective functions.
Problem formulation
In this work, the particle’s positions were defined as binary vectors representing candidate subsets of TCs to
be applied in the software testing process. Let T =
{T1,. . .,Tn}be a test suite withntest cases. A particle’s
position is defined ast= (t1,. . .,tn), in whichtj ∈ {0, 1}
indicates the presence (1) or absence (0) of the test caseTj
within the subset of selected TCs.
As said, two objective functions were adopted: cover-age (branch or functional requirements) and execution cost. The coverage (function to be maximized) consists of the ratio (in percentage) between the amount of code branches or functional requirements covered by a solu-tion t in comparison to the amount of covered by T. Formally, let C = {C1,. . .,Ck} be a given set of k
branches/functional requirements covered by the original suite T. Let F(Tj) be a function that returns the subset of branches/functional requirements inCcovered by the individual test case Tj. The coverage of a solution t is
C_Coverage(t)=100× tj=1
FTj
k (1)
In Eq. (1),t
j=1{F(Tj)}is the union of branches/ func-tional requirement subsets covered by the selected test cases (i.e.,Tjfor whichtj=1).
The execution cost (function to be minimized) repre-sents the amount of time required to execute the selected suite. Formally, each test caseTj ∈ T has acost score cj.
The total cost of a solutiontis given by:
Cost(t)=
tj=1
cj (2)
Finally, the proposed algorithms are used to deliver a good Pareto frontier regarding the objective functions
C_Coverage and Cost.
The BMOPSO-CDR algorithm
The BMOPSO-CDR was firstly presented in [44]. It uses an External Archive (EA) to store the non-dominated solutions found by the particles during the search process. See [44] for more details of BMOPSO-CDR algorithm.
The following summarizes the BMOPSO-CDR:
1. Randomly initialize the swarm, evaluate each particle according to the considered objective functions, and then store in the EA the particles’ positions that are non-dominated solutions;
2. WHILE stop criterion is not verified DO
(a) Compute the velocityvof each particle as:
v←ωv+C1r1(ˆt−t)+C2r2(gˆ−t) (3)
whereωrepresents the inertia factor;r1and
r2are random values in the interval [0,1];C1
andC2are constants. The social guide (gˆ) is
defined as one of the non-dominated solutions stored in the current EA and it is selected by using the Roulette Wheel. (b) Compute the new positiontof each particle
for each dimensiontjas:
tj= 1,0,ifotherwiser3≤sig(vj) (4) wherer3is a random number sampled in the
interval [0,1] and sig(vj) is defined as:
sig(vj)= 1
1+e−vj (5)
(c) Use the mutation operator as proposed by [45];
(d) Evaluate each particle of the swarm and update the solutions stored in the EA; (e) Update the particle’s memorytˆ;
3. END WHILE and return the current EA as the Pareto frontier.
The BCMOPSO-CDRHS algorithm
The Harmony Search algorithm (see [37]) is inspired by the musical process of searching for a perfect harmony. It imitates the musician seeking to find pleasing har-mony determined by an aesthetic standard, just as the optimization process seeks to find a global optimal solu-tion determined by an objective funcsolu-tion [46]. The har-monies in music are analogous to the points in a search space, and the musician’s improvisations are analogous to search operators in optimization techniques [47]. HS has been successfully applied to several discrete optimization problems [41, 46, 47].
The HS algorithm starts by creating random harmonies (solutions) and storing them into a set called harmony memory (HM). The HM is used, during all the optimiza-tion process, to store the best harmonies found by the algorithm. After the initialization of the HM, the improvi-sation begins and it is controlled by three operators3:
1. Harmony memory considering operator (HMCO): it creates a new harmony from a current one by exchanging components (dimensions) from the other HM members. The HMCO is adopted with a probability defined by the parameter harmony memory considering rate (HMCR). This operator controls the balance between the exploration and exploitation when performing the improvisation; 2. Random selection operator (RSO): it randomly
changes a component of a harmony to generate a new one. It is also controlled by the HMCR, in such a way that the probability of randomly changing a harmony component is 1 - HMCR;
3. Pitch adjustment operator (PAO): controls when a harmony will suffer a pitch adjustment (analogous to a local search mechanism) after HMCO. The PAO is always performed after HMCO with a probability defined by the pitch adjustment rate (PAR).
At the end of the improvisation, if the new harmony obtained after applying the operators is better than the worst harmony in the HM, it will be stored into the HM and the worst harmony is removed. This process contin-ues until a stop criterion is reached. As an alternative to the sequential update of the HM, one could also apply the parallel update strategy (see [46] for more details). In this strategy, a number of NGC new harmonies are gener-ated before updating the HM. The sequential strategy is a special case (i.e., when NGC=1).
particle is treated as a harmony) and, hence there is no need to initialize the HM. The HS operators will be applied to the particles produced in the end of each PSO iteration, i.e., we introduced the HS improvisation process after the step (e) of the main loop (2) of BMOPSO-CDR. For each PSO particle, we create NGC new solutionstby applying the improvisation operator as follows:
1. For each dimension of a harmony DO
tj= t k
j,ifr1≤HMCR
RSO,otherwise (6)
RSO= 1,ifr2≤0.5
0,otherwise (7)
wheretjisj th component to update in the harmony;
r1andr2are random values in the interval [0,1]; and
tjkis thej th component of a harmonytkrandomly chosen from the HM;
(a) If the element of the new harmony came from HM (i.e., ifr1≤HMCR) then
tj= Gt j,ifr3≤PAR
j,otherwise (8)
wherer3is a random value in the interval
[0,1];Gjis thej th element of the best solution stored in HM.
Since we deal with multiple objective functions, there is no best single solution in the HM. Hence, we used the Roulette Wheel with Crowding Distance4(from BMOPSO-CDR) in order to selectGthat will be the same used for all new candidate harmonies.
2. Update the HM (EA) by adding the non-dominated created harmonies and by removing the dominated solutions from HM. The improvisation process is repeated for 205iterations.
Results and discussion
This section presents the experiments performed in order to evaluate the search algorithms implemented in this work. In addition to the aforementioned algorithms, we also implemented the well-known NSGA-II algorithm [40], and the only (to the best of our knowledge) pro-posed Multi-Objective Binary Harmony Search (MBHS) algorithm [41]. These algorithms were implemented in order to compare whether our proposed algorithms are competitive as multi-objective optimization techniques.
As said, the developed methods were evaluated in two different scenarios: for structural testing and for func-tional testing, which will be described as follows.
Structural testing
For the structural testing scenario the experiments were performed using five programs (flex, grep, gzip, sed,
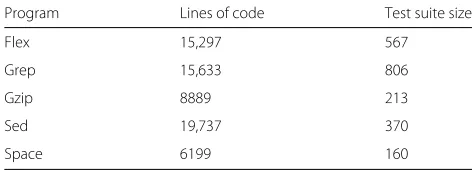
space) from the Software-Artifact Infrastructure Reposi-tory (SIR) [39], which are commonly adopted as bench-marks for experiments.Flex,grep,gzip, andsedare unix utilities obtained from the Gnu site. Thespaceprogram, from the European Space Agency, is an interpreter for an array definition language (ADL). The spaceprogram has several test suites, hence we choose one of the suites with most code coverage. For the other SIR programs, we choose the largest available suite. Details about these programs can be observed on Table 1.
Since there is no cost information for these suites, we estimated the execution cost of each TC by using the Valgrind profiling tool [48], as proposed in [30]. TC exe-cution time is hard to measure accurately since it involves many external parameters that can affect the execution time, such as a different hardware, application software, and operating system. In order to circumvent these issues, we used Valgrind, which executes the program binary code in an emulated, virtual CPU [30]. The computa-tional cost of each test case was measured by counting the number of virtual instruction codes executed by the emulated environment. These counts allow to argue that they are directly proportional to the cost of the TC execu-tion. Additionally, for the same reasons, we computed the branch coverage information by using the profiling tool
gcovfrom the GNU compilergcc(also proposed in [30]).
Functional testing
For the functional testing scenario, we used two test suites (integration and regression) from the context of mobile devices6. For the functional testing selection, we selected two test suites related to mobile devices: an integration suite (IS), which is focused on testing whether the various features of a mobile device can work together, i.e., whether the integration of the features behaves as expected; and a regression suite (RS), which is aimed at testing whether updates to a specific main feature (e.g., the message fea-ture) have not introduced faults into the already developed (and previously tested) feature functionalities. Both suites have 80 TCs, each one representing a functional testing scenario. Contrarily to the structural suites, where each
Table 1Details about the SIR programs
Program Lines of code Test suite size
Flex 15,297 567
Grep 15,633 806
Gzip 8889 213
Sed 19,737 370
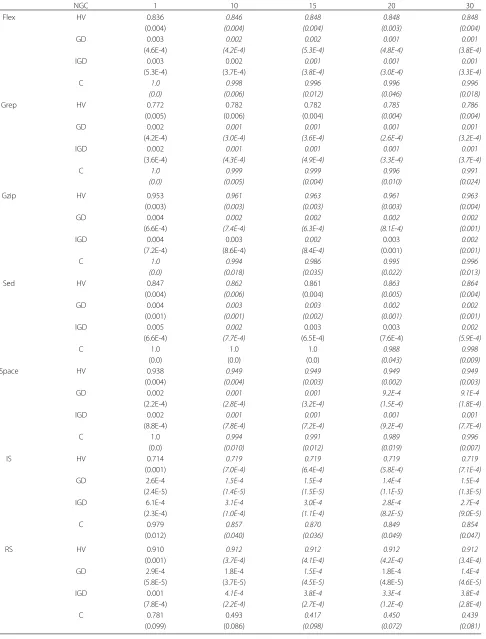
Table 2Mean value and standard deviation of NGC - BMOPSO-CDRHS
NGC 1 10 15 20 30
Flex HV 0.836 0.846 0.848 0.848 0.848
(0.004) (0.004) (0.004) (0.003) (0.004)
GD 0.003 0.002 0.002 0.001 0.001
(4.6E-4) (4.2E-4) (5.3E-4) (4.8E-4) (3.8E-4)
IGD 0.003 0.002 0.001 0.001 0.001
(5.3E-4) (3.7E-4) (3.8E-4) (3.0E-4) (3.3E-4)
C 1.0 0.998 0.996 0.996 0.996
(0.0) (0.006) (0.012) (0.046) (0.018)
Grep HV 0.772 0.782 0.782 0.785 0.786
(0.005) (0.006) (0.004) (0.004) (0.004)
GD 0.002 0.001 0.001 0.001 0.001
(4.2E-4) (3.0E-4) (3.6E-4) (2.6E-4) (3.2E-4)
IGD 0.002 0.001 0.001 0.001 0.001
(3.6E-4) (4.3E-4) (4.9E-4) (3.3E-4) (3.7E-4)
C 1.0 0.999 0.999 0.996 0.991
(0.0) (0.005) (0.004) (0.010) (0.024)
Gzip HV 0.953 0.961 0.963 0.961 0.963
(0.003) (0.003) (0.003) (0.003) (0.004)
GD 0.004 0.002 0.002 0.002 0.002
(6.6E-4) (7.4E-4) (6.3E-4) (8.1E-4) (0.001)
IGD 0.004 0.003 0.002 0.003 0.002
(7.2E-4) (8.6E-4) (8.4E-4) (0.001) (0.001)
C 1.0 0.994 0.986 0.995 0.996
(0.0) (0.018) (0.035) (0.022) (0.013)
Sed HV 0.847 0.862 0.861 0.863 0.864
(0.004) (0.006) (0.004) (0.005) (0.004)
GD 0.004 0.003 0.003 0.002 0.002
(0.001) (0.001) (0.002) (0.001) (0.001)
IGD 0.005 0.002 0.003 0.003 0.002
(6.6E-4) (7.7E-4) (6.5E-4) (7.6E-4) (5.9E-4)
C 1.0 1.0 1.0 0.988 0.998
(0.0) (0.0) (0.0) (0.043) (0.009)
Space HV 0.938 0.949 0.949 0.949 0.949
(0.004) (0.004) (0.003) (0.002) (0.003)
GD 0.002 0.001 0.001 9.2E-4 9.1E-4
(2.2E-4) (2.8E-4) (3.2E-4) (1.5E-4) (1.8E-4)
IGD 0.002 0.001 0.001 0.001 0.001
(8.8E-4) (7.8E-4) (7.2E-4) (9.2E-4) (7.7E-4)
C 1.0 0.994 0.991 0.989 0.996
(0.0) (0.010) (0.012) (0.019) (0.007)
IS HV 0.714 0.719 0.719 0.719 0.719
(0.001) (7.0E-4) (6.4E-4) (5.8E-4) (7.1E-4)
GD 2.6E-4 1.5E-4 1.5E-4 1.4E-4 1.5E-4
(2.4E-5) (1.4E-5) (1.5E-5) (1.1E-5) (1.3E-5)
IGD 6.1E-4 3.1E-4 3.0E-4 2.8E-4 2.7E-4
(2.3E-4) (1.0E-4) (1.1E-4) (8.2E-5) (9.0E-5)
C 0.979 0.857 0.870 0.849 0.854
(0.012) (0.040) (0.036) (0.049) (0.047)
RS HV 0.910 0.912 0.912 0.912 0.912
(0.001) (3.7E-4) (4.1E-4) (4.2E-4) (3.4E-4)
GD 2.9E-4 1.8E-4 1.5E-4 1.8E-4 1.4E-4
(5.8E-5) (3.7E-5) (4.5E-5) (4.8E-5) (4.6E-5)
IGD 0.001 4.1E-4 3.8E-4 3.3E-4 3.8E-4
(7.8E-4) (2.2E-4) (2.7E-4) (1.2E-4) (2.8E-4)
C 0.781 0.493 0.417 0.450 0.439
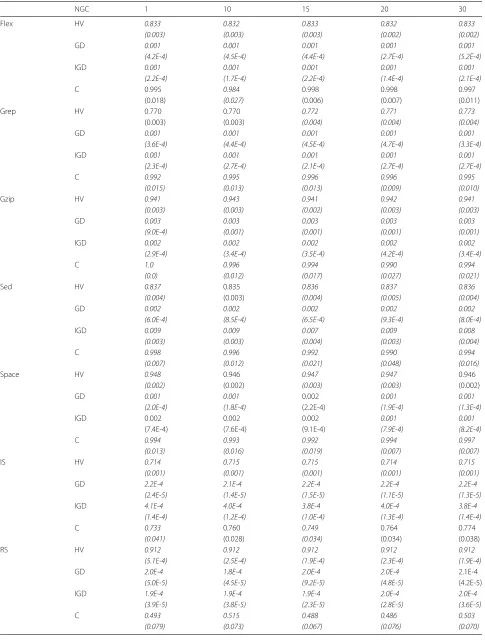
Table 3Mean value and standard deviation of NGC - MBHS
NGC 1 10 15 20 30
Flex HV 0.833 0.832 0.833 0.832 0.833
(0.003) (0.003) (0.003) (0.002) (0.002)
GD 0.001 0.001 0.001 0.001 0.001
(4.2E-4) (4.5E-4) (4.4E-4) (2.7E-4) (5.2E-4)
IGD 0.001 0.001 0.001 0.001 0.001
(2.2E-4) (1.7E-4) (2.2E-4) (1.4E-4) (2.1E-4)
C 0.995 0.984 0.998 0.998 0.997
(0.018) (0.027) (0.006) (0.007) (0.011)
Grep HV 0.770 0.770 0.772 0.771 0.773
(0.003) (0.003) (0.004) (0.004) (0.004)
GD 0.001 0.001 0.001 0.001 0.001
(3.6E-4) (4.4E-4) (4.5E-4) (4.7E-4) (3.3E-4)
IGD 0.001 0.001 0.001 0.001 0.001
(2.3E-4) (2.7E-4) (2.1E-4) (2.7E-4) (2.7E-4)
C 0.992 0.995 0.996 0.996 0.995
(0.015) (0.013) (0.013) (0.009) (0.010)
Gzip HV 0.941 0.943 0.941 0.942 0.941
(0.003) (0.003) (0.002) (0.003) (0.003)
GD 0.003 0.003 0.003 0.003 0.003
(9.0E-4) (0.001) (0.001) (0.001) (0.001)
IGD 0.002 0.002 0.002 0.002 0.002
(2.9E-4) (3.4E-4) (3.5E-4) (4.2E-4) (3.4E-4)
C 1.0 0.996 0.994 0.990 0.994
(0.0) (0.012) (0.017) (0.027) (0.021)
Sed HV 0.837 0.835 0.836 0.837 0.836
(0.004) (0.003) (0.004) (0.005) (0.004)
GD 0.002 0.002 0.002 0.002 0.002
(6.0E-4) (8.5E-4) (6.5E-4) (9.3E-4) (8.0E-4)
IGD 0.009 0.009 0.007 0.009 0.008
(0.003) (0.003) (0.004) (0.003) (0.004)
C 0.998 0.996 0.992 0.990 0.994
(0.007) (0.012) (0.021) (0.048) (0.016)
Space HV 0.948 0.946 0.947 0.947 0.946
(0.002) (0.002) (0.003) (0.003) (0.002)
GD 0.001 0.001 0.002 0.001 0.001
(2.0E-4) (1.8E-4) (2.2E-4) (1.9E-4) (1.3E-4)
IGD 0.002 0.002 0.002 0.001 0.001
(7.4E-4) (7.6E-4) (9.1E-4) (7.9E-4) (8.2E-4)
C 0.994 0.993 0.992 0.994 0.997
(0.013) (0.016) (0.019) (0.007) (0.007)
IS HV 0.714 0.715 0.715 0.714 0.715
(0.001) (0.001) (0.001) (0.001) (0.001)
GD 2.2E-4 2.1E-4 2.2E-4 2.2E-4 2.2E-4
(2.4E-5) (1.4E-5) (1.5E-5) (1.1E-5) (1.3E-5)
IGD 4.1E-4 4.0E-4 3.8E-4 4.0E-4 3.8E-4
(1.4E-4) (1.2E-4) (1.0E-4) (1.3E-4) (1.4E-4)
C 0.733 0.760 0.749 0.764 0.774
(0.041) (0.028) (0.034) (0.034) (0.038)
RS HV 0.912 0.912 0.912 0.912 0.912
(5.1E-4) (2.5E-4) (1.9E-4) (2.3E-4) (1.9E-4)
GD 2.0E-4 1.8E-4 2.0E-4 2.0E-4 2.1E-4
(5.0E-5) (4.5E-5) (9.2E-5) (4.8E-5) (4.2E-5)
IGD 1.9E-4 1.9E-4 1.9E-4 2.0E-4 2.0E-4
(3.9E-5) (3.8E-5) (2.3E-5) (2.8E-5) (3.6E-5)
C 0.493 0.515 0.488 0.486 0.503
suite is intended to test the related program almost as whole, the used functional suites are related to a much more complex environment. Hence, just a little portion of the mobile device operational system is tested.
The cost to execute each test case of the functional suite was measured by the Test Execution Effort Estimation Tool, developed by [49]. The effort represents the cost (in time) needed to manually execute each test case on a particular mobile device. Each TC has annotated which requirements it covers, thus we used this information in order to calculate the functional requirement coverage.
Metrics
In our experiments, we evaluated the results (i.e., the Pareto frontiers) obtained by the algorithms, for each test suite, according to four different quality metrics usu-ally adopted in the literature of multi-objective optimiza-tion. The following metrics were adopted in this paper, each one considering a different aspect of the Pareto frontier.
1. Hypervolume (HV) [50]: computes the size of the dominated space, which is also called thearea under
the curve. A high value of hypervolume is desired in MOO problems.
2. Generational distance (GD) [21]: The GD reports how far, on average, one Pareto set (calledPFknown) is
from the true Pareto set (called asPFtrue).
3. Inverted generational distance (IGD) [21]: is the inverse of GD by measuring the distance from the
PFtrueto thePFknown. This metric is complementary
to the GD and aims to reduce the problem when
PFknownhas very few points, but they all are clustered
together. So, this metric is affected by the distribution of the solutions ofPFknowncomparatively toPFtrue.
4. Coverage (C) [50]: The coverage metric indicates the amount of the solutions within the non-dominated set of the first algorithm which dominates the solutions within the non-dominated set of the second algorithm.
Both GD and IGD metrics requires that thePFtrue be known. Unfortunately, for more complex problems (with
bigger search spaces), as thespaceandflexprograms, it is impossible to knowPFtruea priori. In these cases, instead, a reference Pareto frontier (called herePFreference) can be constructed and used to compare algorithms regarding the Pareto frontiers they produce (as suggested in [30]). The reference frontier represents the union of all found Pareto frontiers, resulting in a set of non-dominated solu-tions found. Additionally, the C metric reported in this work refers to the coverage of the optimal setPFreference, over each algorithm, indicating the amount of solutions
of those algorithms that are dominated, e.g., that are not optimal.
The results of these metrics were statistically compared by using the Wilcoxon sum test. The Wilcoxon rank-sum test is a nonparametric hypothesis test that does not require any assumption on the parametric distribu-tion of the samples. In the context of this paper, the null hypothesis states that, regarding the observed metric, two different algorithms produce equivalent Pareto frontiers. Theαlevel was set to 0.95, and significantpvalues suggest
that the null hypothesis should be rejected in favor of the alternative hypothesis, which states that the Pareto frontiers are different.
Parameter study
Before comparing our proposed algorithms (BMOPSO-CDRHS and BMOPSO-CDR) with the baselines NSGA-II and MBHS (the main experiment), we performed a study focused on the HS parameters. Since the use of HS in multi-objective binary search spaces is new, we aimed to investigate how sensitive is the algorithm performance to
its parameters as well as to find suitable parameter values for the test case selection problem. This study was based on [46] with additional values suggested in [41].
For each of the following experiments, the algorithms were run 30 times with 200,000 objective function evaluations.
The NGC parameter
The sequential strategy in the standard HS improvises only one new candidate at each iteration and then updates the HM.
On the other hand, the parallel strategy generates mul-tiple candidates in order to update the HM at each iter-ation7. In a previous work, [38], we adopted the parallel strategy, without performing any experiment to verify whether it is actually better than the sequential strategy in our context. In the present work, we investigated the use of both the sequential and the parallel strategy as well as the effect of the number of NGC (new generating candidates) in the optimization performance.
In our experiments, both algorithms BMOPSO-CDRHS and MBHS were evaluated using different values of NGC:
1, 10, 15, 20, and 30. We highlight that NGC=1 corre-sponds to the sequential strategy. Furthermore, we fixed the values of the other HS parameters by using the same
values adopted in [38] (HMS =200, HMCR =0.9, and
PAR = 0.03). Tables 2 and 3 show the mean and
stan-dard deviation values for each metric. Additionally, we highlighted the best results in the aforementioned tables aiming to ease the reading. Furthermore, it is important to note that as we wanted to measure the effects of the num-ber of NGC in each algorithm, we formed thePFreference using only the frontiers of each algorithm separately.
Concerning the BMOPSO-CDRHS algorithm, it is pos-sible to observe from Table 2 that for almost all metrics, the sequential strategy is outperformed by the parallel strategy. Only in three situations the sequential strategy was equal to the parallel strategy. Hence, the use of parallel strategy indeed improved the BMOPSO-CDRHS algo-rithm. Furthermore, we can point out that the value of NGC=30 was always the best parameter settings in sta-tistical terms. Thus, NGC=30 is recommended and used as the default value in the next sections.
Differently, we can see in Table 3 that the parallel strat-egy had not the same impact on the MBHS as on the BMOPSO-CDRHS. The sequential strategy for most of the cases was as good as the parallel strategy. In fact, NGC = 1 (sequential strategy) in some situations was better than some values of parallel strategy (NGC > 1). Despite of that, we choose the value of NGC=20 as the default value to be used in the next sections because it was the one that most appeared among the best statistical results.
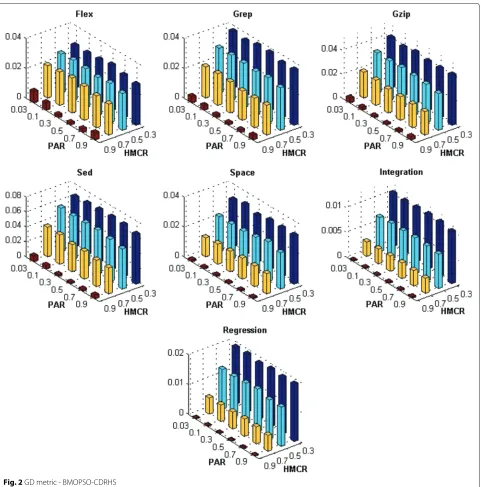
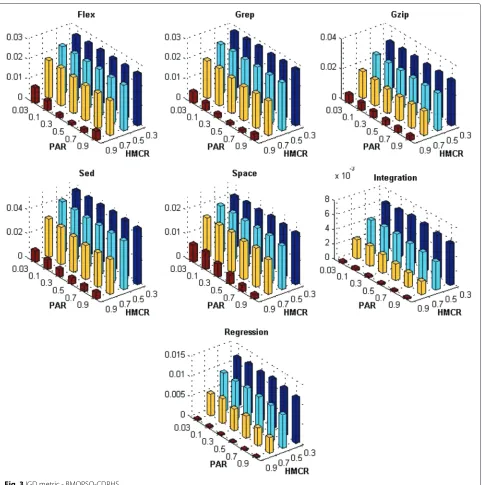
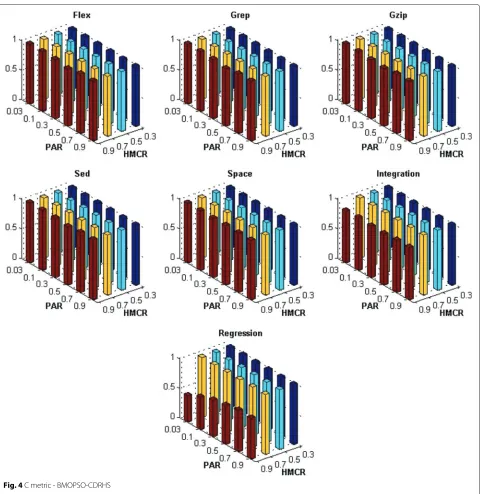
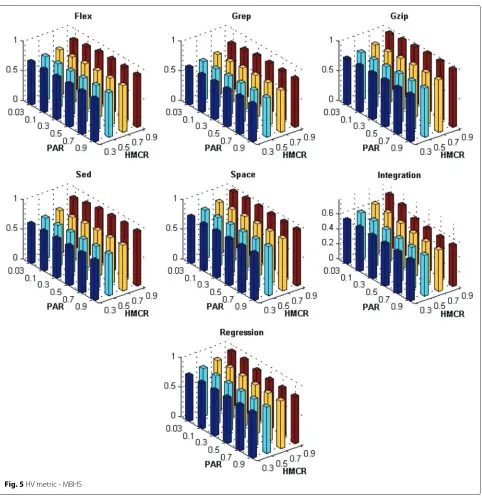
The HMCR and PAR parameters
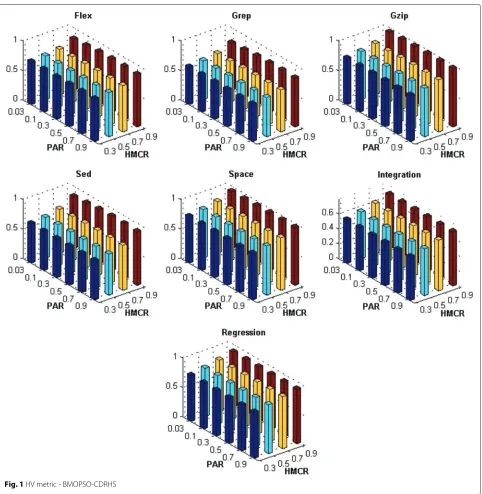
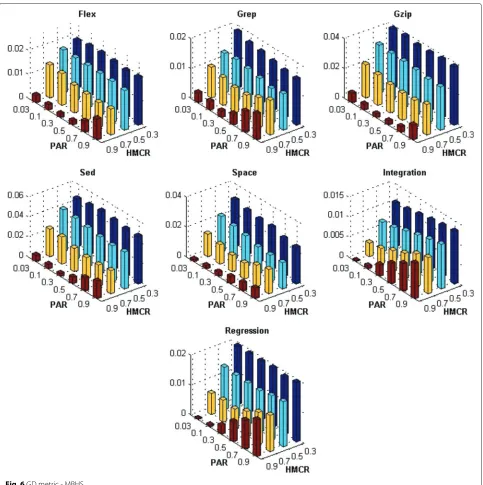
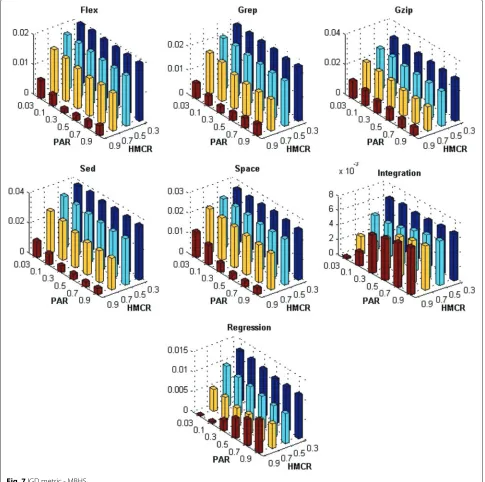
The HMCR and PAR parameters are important param-eters of the HS algorithm as they control the trade-off between finding globally and locally improved solutions. Ideally there is a combination of these values that improve the optimization ability of the HS algorithm. Because of that, we investigated the influence of these two parameters simultaneously. In our experiments, HMCR was tunned from 0.3 to 0.9 with increment 0.2 and PAR was set within {0.03 0.1 0.3 0.5 0.7 0.9}.
Figures 1, 2, 3, 4, 5, 6, 7 and 8 present the results obtained by the BMOPSO-CDRHS and the MBHS
con-sidering all evaluation metrics and benchmarks adopted and by varying the parameters HMCR and PAR. As it can be observed, the choice of HMCR had a bigger impact on the quality of the solutions than the choice of PAR. For all metrics, the best results were obtained when HMCR= 0.9 for both BMOPSO-CDRHS and MBHS algorithms. Concerning the PAR parameter, we point out that there was not a single value that was the best for all situations.
In the remaining experiments, we adopted PAR = 0.5
(for BMOPSO-CDRHS) and PAR=0.3 (for MBHS) since
they were observed more often among the best statistical results.
Fig. 8C metric - MBHS
It is important to highlight that the best parameter settings observed in our experiments were sometimes dif-ferent from the default parameter values suggested in previous work in the HS literature [38, 46] and [41]. The previous experiments supported finding parameter val-ues that are more suitable to the multi-objective test case selection problem.
Main experiment
In this section, we evaluated whether the proposed binary multi-objective algorithms were competitive against
base-line methods such as the well-known NSGA-II and other binary MBHS.
Table 4Mean value and standard deviation of the algorithms
BMOPSO-CDR BMOPSO-CDRHS MBHS NSGA-II
Flex HV 0.736 0.888 0.882 0.791
(0.004) (0.004) (0.004) (0.013)
GD 0.026 0.001 0.006 0.012
(0.003) (4.1E-4) (0.001) (0.003)
IGD 0.023 0.001 0.003 0.017
(7.8E-4) (4.5E-4) (7.3E-4) (0.002)
C 1.0 0.955 1.0 1.0
(0.0) (0.104) (0.0) (0.0)
Grep HV 0.657 0.821 0.823 0.712
(0.006) (0.004) (0.004) (0.016)
GD 0.028 0.001 0.003 0.004
(0.003) (4.1E-4) (5.7E-4) (0.001)
IGD 0.023 0.002 0.002 0.015
(0.001) (5.1E-4) (3.1E-4) (2.4E-4)
C 1.0 0.963 0.990 1.0
(0.0) (0.058) (0.027) (0.0)
Gzip HV 0.821 0.976 0.973 0.888
(0.008) (0.003) (0.002) (0.019)
GD 0.030 0.001 0.003 0.010
(0.004) (3.3E-4) (6.3E-4) (0.003)
IGD 0.026 0.005 0.004 0.016
(0.001) (0.002) (0.001) (0.002)
C 1.0 0.963 0.998 1.0
(0.0) (0.056) (0.006) (0.0)
Sed HV 0.698 0.908 0.905 0.769
(0.008) (0.005) (0.006) (0.023)
GD 0.050 0.002 0.007 0.017
(0.006) (0.002) (0.002) (0.006)
IGD 0.034 0.002 0.002 0.022
(0.001) (0.001) (4.5E-4) (0.003)
C 1.0 0.957 0.995 1.0
(0.0) (0.071) (0.015) (0.0)
Space HV 0.809 0.965 0.947 0.856
(0.008) (0.001) (0.002) (0.017)
GD 0.019 7.0E-4 0.003 0.002
(0.003) (7.7E-5) (0.001) (7.4E-4)
IGD 0.018 0.003 0.001 0.018
(0.001) (0.001) (3.9E-4) (0.001)
C 1.0 0.968 0.983 0.991
(0.0) (0.024) (0.018) (0.031)
IS HV 0.600 0.719 0.591 0.649
(0.005) (4.0E-4) (0.008) (0.012)
GD 0.007 2.0E-4 0.002 8.4E-4
(4.2E-4) (4.5E-4) (4.4E-4) (2.7E-4)
IGD 0.005 1.9E-4 0.005 0.005
(5.5E-4) (1.9E-5) (5.4E-4) (0.001)
C 1.0 0.835 0.655 0.972
(0.0) (0.030) (0.054) (0.058)
RS HV 0.802 0.912 0.846 0.843
(0.005) (3.7E-4) (0.009) (0.017)
GD 0.012 2.2E-4 0.002 0.001
(0.001) (5.0E-5) (7.0E-4) (7.6E-4)
IGD 0.010 2.4E-4 0.002 0.012
(0.001) (4.0E-5) (2.5E-4) (0.002)
C 1.0 0.667 0.661 0.982
parameter study: NGC=30, HMCR =0.9, and PAR =
0.5 for BMOPSO-CDRHS; NGC=20, HMCR=0.9, and
PAR=0.3 for MBHS.
The NSGA-II algorithm, in turn, used a mutation rate of 1/population size, crossover rate of 0.9, and popula-tion size of 200 individuals. As the NSGA-II and MBHS algorithms do not use an external archive to store solu-tions, we decided to use the population size and HMS of 200 solutions to permit a fair comparison. This way, all the algorithms are limited to a maximum of 200 non-dominated solutions.
Results
The results of the metrics for each algorithm are shown in Table 4 where the best results are highlighted in order to ease the reading. Differently from the parameter study, here we want to compare the algorithms with each other, so the PFreference (used to calculate the GD, IGD, and C metrics) was formed by the Pareto frontiers of all algorithms.
From Table 4, we can see that the BMOPSO-CDRHS outperformed the other algorithms for almost all the metrics and benchmarks (excepting three situations). It is possible to observe, from the HV metric, that the BMOPSO-CDRHS dominates bigger objective space areas when compared to the others. Furthermore, the GD values obtained by the algorithm show that its Pareto frontiers have better convergence to the optimal Pareto frontier (represented by thePFreference). Additionally, the results obtained by considering the IGD metric show that its Pareto frontiers are also well distributed com-paratively to optimal Pareto set (except on the gzip and space programs). Finally, the coverage metric indicates that the BMOPSO-CDRHS algorithm was the least dom-inated algorithm by the optimal Pareto set, hence several of its solutions are within the optimal frontier (except on the integration suite). Furthermore, we point out that the type of testing scenario does not impact in the results of the experiments.
In addition to aforementioned results, we also state that the hybrid mechanism indeed improved the BMOPSO-CDR algorithm, and that the BMOPSO-BMOPSO-CDRHS selection algorithm is a competitive multi-objective algorithm. It is also important to highlight that the MBHS algorithm outperformed, for almost all cases, the NSGA-II and the BMOPSO-CDR algorithms. Thus, the MBHS is also suit-able to the problem and further studies can be performed in order to improve its performance.
Conclusions
In this work, we propose a new hybrid algorithm by combining the Harmony Search algorithm into the binary multi-objective PSO for TC selection. The main contribution of the current work was to investigate
whether this hybridization can improve the multi-objective PSO both branch/functional requirements cov-erage and execution cost. Furthermore, we performed a parameter study in order to verify the appropriate parameter settings for the HS search operators. We high-light that the hybrid binary multi-objective PSO with Harmony Search was only investigated by [38] (our pre-vious work) in the context of TC selection. Besides, the developed selection algorithms can be adapted to other test selection criteria and are not limited to two objective functions. Furthermore, we expect that the good results can also be obtained in other application domains.
In the performed experiments, the hybrid algorithm (BMOPSO-CDRHS) was the best one when compared to the BMOPSO-CDR, MBHS, and NSGA-II algorithms for almost all metrics and benchmarks adopted for structural and functional test. Hence, we conclude that hybridization indeed improved the former BMOPSO-CDR algorithm and the hybrid algorithm is a competitive multi-objective search strategy.
As future work, we can point the investigation of other hybrid strategies and perform the same experiments on a higher number of programs in order to verify whether the obtained results are equivalent to those presented here, and also whether these results can be extrapolated to other testing scenarios. Also we will perform a more complete parameter study with more settings as well with more specific aspects of the PSO.
Endnotes
1However, note that 100 % of code coverage do not
ensure the total absence of faults, since the same code may correctly process a number of inputs and incorrectly process different inputs. Similarly, for functional testing, the total coverage of the requirements or use cases does not guarantee absence of faults in the SW.
2Note that the aforementioned deterministic strategies
do not address the multi-objective TC selection
problems; they only work with a single selection criterion.
3We followed in this paper the nomenclature of HS
presented in [41].
4See [44] for more details on the Roulette Wheel with
Crowding Distance mechanism.
5This value was found by trial and error and further
formal investigation will be performed in order to verify its influence.
6These suites were created by test engineers of the
Motorola CIn-BTC (Brazil Test Center) research project.
7For more details about the sequential and parallel
strategies, see [46].
Competing interests
Authors’ contributions
All authors have contributed to the methodological and experimental aspects of the research. All authors read and approved the final manuscript.
Acknowledgements
This work was partially supported by the National Institute of Science and Technology for Software Engineering (INES www.ines.org.br), CNPq, CAPES, FACEPE, and FAPEMIG.
Received: 23 March 2015 Accepted: 28 September 2015
References
1. Desikan S, Ramesh G. Software testing: principles and practices. Upper Saddle River, NJ, USA: Prentice Hall Press; 2007.
2. Jorgensen PC. Software testing: a craftsman’s approach. Boston, MA, USA: Auerbach Publications; 2008.
3. Young M, Pezze M. Software testing and analysis: process, principles and techniques. Hoboken, NJ, USA: John Wiley & Sons; 2005.
4. Van Vliet H. Software engineering: principles and practice vol. 3. Hoboken, NJ, USA: Wiley Publishing; 1993.
5. Hutchins M, Foster H, Goradia T, Ostrand T. Experiments of the effectiveness of dataflow-and controlflow-based test adequacy criteria. In: Proceedings of the 16th International Conference on Software
Engineering. IEEE Computer Society Press; 1994. p. 191–200. 6. Ramler R, Wolfmaier K. Economic perspectives in test automation—
balancing automated and manual testing with opportunity cost. In: Workshop on Automation of Software Test. New York, NY, USA: ACM; 2006. 7. Feijs LMG, Goga N, Mauw S, Tretmans J. Test selection, trace distance
and heuristics. In: Proceedings of the IFIP 14th International Conference on Testing Communicating Systems. Deventer, The Netherlands, The Netherlands: Kluwer, B.V.; 2002. p. 267–282.
8. Nogueira S, Cartaxo GE, Torres D, Aranha HSE, Marques R. Model based test generation: an industrial experience. In: First Brazilian Workshop on Systematic and Automated Software Testing. João Pessoa, PB, Brasil; 2007. Outubro.
9. Cartaxo GE, Andrade W, Oliveira Neto GF, Machado DLP. Ltsbt: A tool to generate and select functional test cases for embedded systems. In: 23rd Annual ACM Symposium on Applied Computing (SAC’2008). Brazil: Fortaleza; 2008.
10. Harold MJ, Gupta R, Soffa ML. A methodology for controlling the size of a test suite. ACM Trans Softw Eng Methodol. 1993;2(3):270–285.
11. Cartaxo GE, Machado DLP, Oliveira Neto GF. On the use of a similarity function for test case selection in the context of model-based testing. Software Testing, Verification and Reliability. 2009;21(2):270–285. 12. Harrold MJ, Soffa ML. Interprocedual data flow testing. SIGSOFT Softw
Eng Notes. 1989;14(8):158–167. doi:10.1145/75309.75327.
13. Yau SS, Kishimoto Z. A method for revalidating modified programs in the maintenance phase. In: Proceedings of International Computer Software and Applications Conference. Tokyo, Japan: IEEE Computer Society Press; 1987.
14. Agrawal H, Horgan JR, Krauser EW, London S. Incremental regression testing. In: Proceedings of the Conference on Software Maintenance. ICSM ’93. Washington: IEEE Computer Society; 1993. p. 348–357. 15. Rothermel G, Harrold MJ. A safe, efficient regression test selection
technique. ACM Trans Softw Eng Methodol. 1997;6(2):173–210. 16. Vokolos FI, Frankl PG. Empirical evaluation of the textual differencing
regression testing technique. In: Software Maintenance, 1998. Proceedings., International Conference On. Washington, DC, USA: IEEE Computer Society; 1998. p. 44–53.
17. Briand LC, Labiche Y, Soccar G. Automating impact analysis and regression test selection based on UML designs. In: Software Maintenance, 2002. Proceedings. International Conference On. Washington, DC, USA: IEEE Computer Society; 2002. p. 252–261. 18. Yoo S, Harman M. Regression testing minimization, selection and
prioritization: a survey. Software Testing, Verification and Reliability. 2010;22(2):67–120.
19. Lin JW, Huang CY. Analysis of test suite reduction with enhanced tie-breaking techniques. Inf Softw Technol. 2009;51(4):679–690. 20. Harman M. Making the case for MORTO: multi objective regression test
optimization. In: Fourth International IEEE Conference on Software
Testing, Verification and Validation. Washington, DC, USA: IEEE Computer Society; 2011. p. 111–114.
21. Coello CAC, Lamont GB, van Veldhuizen DA. Evolutionary algorithms for solving multi-objective problems. vol. 5. Secaucus, NJ, USA: Springer; 2007.
22. Barltrop K, Clement B, Horvath G, Lee CY. Automated test case selection for flight systems using genetic algorithms. In: Proceedings of the AIAA Infotech@Aerospace Conference (I@A 2010). Atlanta: International Thomson Computer Press; 2010.
23. de Souza LS, Prudêncio RBC, de Barros FA. A constrained particle swarm optimization approach for test case selection. In: Proceedings of the 22nd International Conference on Software Engineering and Knowledge Engineering (SEKE 2010). Redwood City, CA, USA: Knowledge Systems Institute Graduate School; 2010.
24. de Souza LS, Prudêncio RBC, de Barros FA, da S. Aranha EH. Search based constrained test case selection using execution effort. Expert Systems with Applications. 2013;40(12):4887–4896.
25. Black J, Melachrinoudis E, Kaeli D. Bi-criteria models for all-uses test suite reduction. In: Software Engineering, 2004. ICSE 2004. Proceedings. 26th International Conference On. Washington, DC, USA: IEEE Computer Society; 2004. p. 106–115.
26. Mirarab S, Akhlaghi Esfahani S, Tahvildari L. Size-constrained regression test case selection using multicriteria optimization. IEEE Trans Softw Eng. 2012;38(4):936–956.
27. Wang S, Ali S, Gotlieb A. Minimizing test suites in software product lines using weight-based genetic algorithms. In: Proceedings of the 15th Annual Conference on Genetic and Evolutionary Computation. GECCO ’13. New York: ACM; 2013. p. 1493–1500. doi:10.1145/2463372.2463545. http://doi.acm.org/10.1145/2463372.2463545.
28. Yoo S, Harman M. Pareto efficient multi-objective test case selection. In: Proceedings of the 2007 International Symposium on Software Testing and Analysis. New York, NY, USA: ACM; 2007. p. 140–150.
29. Maia CLB, do Carmo RAF, de Freitas FG, de Campos GAL, de Souza JT. A multi-objective approach for the regression test case selection problem. In: Proceedings of Anais do XLI Simposio Brasileiro de Pesquisa Operacional (SBPO 2009); 2009. p. 1824–1835.
30. Yoo S, Harman M. Using hybrid algorithm for pareto efficient multi-objective test suite minimisation. J Syst Softw. 2010;83:689–701. 31. Yoo S, Nilsson R, Harman M. Faster fault finding at Google using multi
objective regression test optimisation. In: 8th European Software Engineering Conference and the ACM SIGSOFT Symposium on the Foundations of Software Engineering (ESEC/FSE 11). Szeged, Hungary. New York, NY, USA: ACM; 2011.
32. Yoo S, Harman M, Ur S. Highly scalable multi objective test suite minimisation using graphics cards. In: Proceedings of the Third International Conference on Search Based Software Engineering. SSBSE’11. Heidelberg: Springer; 2011. p. 219–236.
33. Yoo S, Harman M, Ur S. GPGPU test suite minimisation: search based software engineering performance improvement using graphics cards. Empir Softw Eng. 2013;18(3):550–593.
34. De Lucia A, Di Penta M, Oliveto R, Panichella A. On the role of diversity measures for multi-objective test case selection. In: Automation of Software Test (AST), 2012 7th International Workshop On. Piscataway, NJ, USA: IEEE Press; 2012. p. 145–151.
35. Kumari AC, Srinivas K, Gupta MP. Multi-objective test suite minimisation using quantum-inspired multi-objective differential evolution algorithm. In: Computational Intelligence Computing Research (ICCIC), 2012 IEEE International Conference On. Piscataway, NJ, USA: IEEE Press; 2012. p. 1–7. 36. Bozkurt M. Cost-aware pareto optimal test suite minimisation for
service-centric systems. In: Proceeding of the Fifteenth Annual Conference on Genetic and Evolutionary Computation Conference. GECCO ’13. New York: ACM; 2013. p. 1429–1436.
37. Geem ZW, Kim JH, Loganathan G. A new heuristic optimization algorithm: harmony search. Simulation. 2001;76(2):60–68.
38. de Souza LS, Prudêncio RBC, de A. Barros F. Multi-objective test case selection: a hybrid particles warm optimization and harmony search algorithm. In: Proceedings of the V Workshop Workshop de Engenharia de Software Baseada em Busca (WESB 2014). Maceio; 2014.
40. Deb K, Agrawal S, Pratap A, Meyarivan T. A fast elitist non-dominated sorting genetic algorithm for multi-objective optimization: Nsga-ii. In: Parallel Problem Solving from Nature PPSN VI. Lecture Notes in Computer Science. Vol. 1917. Berlin, Heidelberg: Springer; 2000. p. 849–858. 41. Wang L, Mao Y, Niu Q, Fei M. A multi-objective binary harmony search
algorithm. In: Advances in Swarm Intelligence. Springer; 2011. p. 74–81. 42. Kennedy J, Eberhart RC. Particle swarm optimization. In: Proceedings of
the IEEE International Joint Conference on Neural Networks; 1995. p. 1942–1948.
43. Eberhart RC, Shi Y. Comparison between genetic algorithms and particle swarm optimization. LNCS. 1998;1447:611–616.
44. de Souza LS, de Miranda PBC, Prudêncio RBC, de Barros FA. A multi-objective particle swarm optimization for test case selection based on functional requirements coverage and execution effort. In: In Proceedings of the 23rd International Conference on Tools with Artificial Intelligence (ICTAI 2011). Boca Raton; 2011.
45. Coello C, Pulido G, Lechuga M. Handling multiple objectives with particle swarm optimization. IEEE Trans Evol Comput. 2004;8(3):256–279. 46. Wang L, Xu Y, Mao Y, Fei M. A discrete harmony search algorithm. In: Life
System Modeling and Intelligent Computing. Springer; 2010. p. 37–43. 47. Afkhami S, Ma’rouzi OR, Soleimani A. A binary harmony search algorithm
for solving the maximum clique problem. Int J Comput Appl. 2013;69:38–43.
48. Nethercote N, Seward J. Valgrind: A program supervision framework. In: In Third Workshop on Runtime Verification; 2003.
49. Aranha E, Borba P. Using process simulation to assess the test design effort reduction of a model-based testing approach. In: ICSP; 2008. p. 282–293.
50. Deb K, Kalyanmoy D. Multi-objective optimization using evolutionary algorithms, 1st edn. New York, NY, USA: Wiley; 2001.
Submit your manuscript to a
journal and benefi t from:
7Convenient online submission 7Rigorous peer review
7Immediate publication on acceptance 7Open access: articles freely available online 7High visibility within the fi eld
7Retaining the copyright to your article