R E S E A R C H P A P E R
Open Access
Multi-view large population gait dataset
and its performance evaluation for cross-view
gait recognition
Noriko Takemura
1*, Yasushi Makihara
1, Daigo Muramatsu
1, Tomio Echigo
2and Yasushi Yagi
1Abstract
This paper describes the world’s largest gait database with wide view variation, the “OU-ISIR gait database, multi-view large population dataset (OU-MVLP)”, and its application to a statistically reliable performance evaluation of
vision-based cross-view gait recognition. Specifically, we construct a gait dataset that includes 10,307 subjects (5114 males and 5193 females) from 14 view angles ranging 0°−90°, 180°−270°.
In addition, we evaluate various approaches to gait recognition which are robust against view angles. By using our dataset, we can fully exploit a state-of-the-art method requiring a large number of training samples, e.g., CNN-based cross-view gait recognition method, and we validate effectiveness of such a family of the methods.
Keywords: Gait database, Gait recognition, Multi-view large population performance evaluation
1 Introduction
Biometric-based human identification methods have been intensively studied for the purpose of various application: access control, surveillance, forensics, etc. As biometric traits, face, voice, fingerprint, hand veins, iris, handwrit-ing, and gait are available for such applications. Among them, gait is one of the most practical trait for video-based surveillance and forensics because it can be obtained from a CCTV footage captured at a distance, as well as applicable to an uncooperative subject. In fact, gait recog-nition has started to be used in practical cases in criminal investigation [1–3].
However, the availability of gait recognition for uncoop-erative subjects induces problematic covariates, including view angle, walking speed, clothing, surface, carrying sta-tus, shoe, and time elapse. Therefore, for further progress, it is essential that gait recognition is more robust against these covariates. In this paper, we focus on the view angle which is one of the most important covariates and hence deal with cross-view gait recognition.
Cross-view gait recognition has been intensively stud-ied in recent years. Robust approaches against the view
*Correspondence:[email protected]
1Osaka University, Ibaraki, Japan
Full list of author information is available at the end of the article
angle are categorized mainly into two families: generative and discriminative approaches. Given a matching pair of gait features under different views, generative approaches generate the gait features under the same view for bet-ter matching [4–7]. The generative approaches do not, however, guarantee the optimality in terms of discrim-ination capability because they essentially optimize not the discrimination capability itself but the accuracy of the generated gait features.
The discriminative approaches aim at optimizing the discrimination capability under view variations by learn-ing discriminant subspaces or metrics. This family usually applies machine learning-based approaches such as linear discriminant analysis (LDA) [8, 9], primal rank support vector machine (RankSVM) [10], and multi-view dis-criminant analysis (MvDA) [11]. Moreover, discriminative approaches using deep learning [12] has become flourish-ing recently. Deep learnflourish-ing has achieved great successes in many areas. An advantage of deep learning is that it simultaneously executes feature extraction and recogni-tion within a unified framework using a large amount of training samples. In particular, a convolutional neu-ral network (CNN), which considers spatial proximity using a convolution operation, significantly improves the accuracy of image recognition as demonstrated through a series of ImageNet Large Scale Visual Recognition
Challenges [13]. Moreover, the effectiveness of a CNN has been demonstrated in research fields that are more rele-vant with gait recognition, such as action recognition [14], video classification [15], and face recognition [16].
There are some gait recognition studies using a CNN framework [17–20], and they reported that the CNN-based method outperformed the benchmark without using CNN. Though CNN-based method requires a large number of samples for sufficient training or for statisti-cally reliable evaluation, there is no gait database including a large number of subjects with wide view angles at the same time. For example, though CASIA dataset B [21] used for evaluation in [17,18] contains gait images with a wide range of view angles (11 views, 0 − 180°), it is composed of only 124 subjects. On the other hand, OU-ISIR gait database, large population (OU-LP) [22] used in [17, 19, 20], contains gait images of a large population (4016 subjects) but its range of view angle is narrow (4 views, 55°, 65°, 75°, 85°). Therefore, the evaluation of cross-view gait recognition using such databases may not be statistically reliable.
In order to cope with such a problem, we built a gait database comprising the multi-view large popula-tion dataset. Specifically, our dataset named as “OU-ISIR Gait Database, Multi-View Large Population (OU-ISIR, MVLP)1” is the largest gait database in the world, com-prising 10,307 subjects and including wide range view (14 views, 0°–90°, 180°–270°). Thanks to the dataset, we can evaluate the performance of vairous approaches to cross-view gait recognition including generative approaches and discriminative approaches with or without a CNN frame-work, in a statistically reliable way. In particular, since the state-of-the-art CNN-based approaches require mas-sive training samples to get the high accuracy, our dataset can be exploited as the massive training samples in order to draw real state-of-the-art accuracy of the CNN-based approaches.
The outline of the paper is as follows: Section2 intro-duces existing gait databases, while Section 3addresses the construction of our dataset. The performance eval-uation for cross-view gait recognition is described in Section 4, and Section 5 presents our conclusions and discusses future work.
2 Existing gait databases for cross-view gait recognition
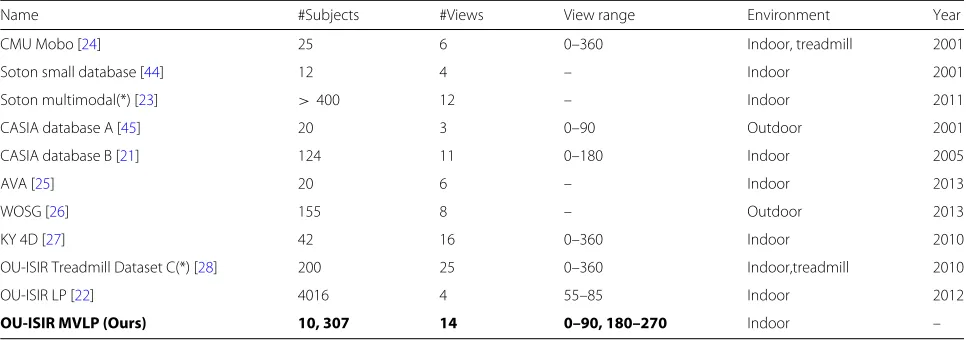
Existing major gait databases with multi-view images are summarized in Table1.
As the database with a wide range of view angle, there exist Soton multimodal [23] (not released to the pub-lic), CASIA database B [21], CMU Mobo [24], AVA [25], WOSG [26], KY 4D [27], and OU-ISIR Treadmill Dataset C [28] (not released to the public). The Soton Multimodal was collected at the biometric tunnel [29] and contains over 400 subjects multi-modal data (gait, face, and ear). The subject’s gait is recorded by 12 cameras and 1 camera records a front face view and 1 camera records a snapshot of the side view for ear recognition. The CASIA database B is frequently used for evaluation of cross-view gait recognition since it contains large view variations from front view (0°) to rear view (180°) with 18-degree inter-val. This database recorded ten sequences per subject: six normal sequences; two sequences with a long coat; two sequences with a backpack. The CMU Mobo contains 25 subjects walking on a treadmill with six view variation whose range is 0–360°. The subjects perform four differ-ent walk pattern; slow walk, fast walk, incline walk, and walking with a ball. The AVA contains videos of 20 walk-ing subjects with a large variety of body size, who walk along straight and curved paths. The database contains six view angles. The WOSG contains 155 subjects with eight view variations. The subjects were captured with the short-wave infrared spectrum (900–1700 nm) in an active, outdoor environment. KY 4D contains sequential
Table 1Existing major gait databases with multi-view images
Name #Subjects #Views View range Environment Year
CMU Mobo [24] 25 6 0–360 Indoor, treadmill 2001
Soton small database [44] 12 4 – Indoor 2001
Soton multimodal(*) [23] >400 12 – Indoor 2011
CASIA database A [45] 20 3 0–90 Outdoor 2001
CASIA database B [21] 124 11 0–180 Indoor 2005
AVA [25] 20 6 – Indoor 2013
WOSG [26] 155 8 – Outdoor 2013
KY 4D [27] 42 16 0–360 Indoor 2010
OU-ISIR Treadmill Dataset C(*) [28] 200 25 0–360 Indoor,treadmill 2010
OU-ISIR LP [22] 4016 4 55–85 Indoor 2012
OU-ISIR MVLP (Ours) 10, 307 14 0–90, 180–270 Indoor –
3D models and image sequences of 42 walking subjects. The sequential 3D models are generated from gait image sequences captured by 16 cameras. The OU-ISIR Tread-mill Dataset C contains 200 subjects with 25 views: a combination of 12 azimuth views with 30° interval and 2 tilt views; and 1 top view. Though these databases contain images with a wide view angle, the number of subjects is insufficient to evaluate of gait recognition in a statistically reliable way.
On the other hand, the OU-ISIR LP [22] is the largest dataset w.r.t. the number of subjects besides our dataset. The dataset contains 4,016 subjects with a wide age range from 1 to 94 years old also with an almost balanced gender ratio. Though a large number of subjects data are con-tained, its view variation is limited to only four view angles (55–85°) within 30° of angular difference.
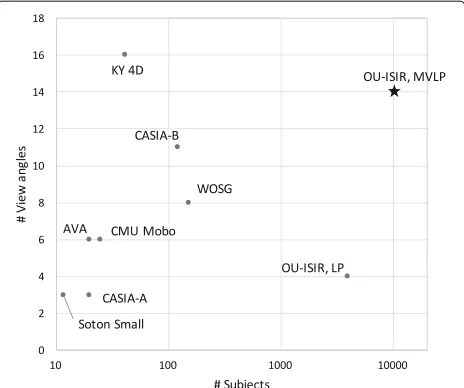
The relation between the number of subjects and the number of view angles is shown in Fig.1. In order to eval-uate cross-view gait recognition in a statistically reliable way, the database with a large number of subjects from a wide view angle is definitely required.
3 The OU-ISIR gait database, multi-view large population dataset
3.1 Capturing system
Our gait dataset, OU-ISIR MVLP, is constructed based on gait images collected in the gait collecting frame-work introduced in [30]. The gait data is collected in conjunction with long-run exhibition at a science museum (Miraikan) while informed consent is obtained through electrical procedures. Gait images of 1280 ×980 pixels at 25 fps are captured by seven network cameras (cam1–7) placed at intervals of 15° azimuth angles along a quarter
Fig. 1The relation between the number of subjects and the number of view angles in the existing publicly available gait databases and our OU-ISIR, MVLP
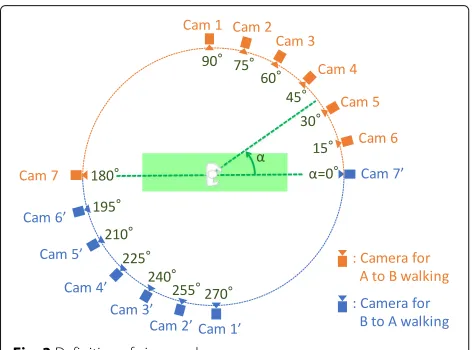
of a circle whose center coincides with the center of the walking course, where a green wall and a carpet are installed for chroma-key, as shown in Fig.2. Its radius is approximately 8 m and height is approximately 5 m for capturing images at depression angle to consider a surveil-lance view while the view angles of CASIA dataset B and OU-ISIR LP are almost horizontal. Each network camera continuously capture a video during the opening hours, photo-electronic sensors are built at the walking course to sense a passing time of a subject, which is used to clip a video of the target subject from the whole sequence. The subject repeat forward (A to B) and backward (B to A) walking twice of each, 28 gait image sequences (= 7 (cameras)×2 (forward and backward)×2 (twice)) can be captured per one subject. The view angle of our dataset is defined as shown in Fig.3.
Gait sequence is the same for each of camera view 1 to 7, and camera view 1’ to 7’ in Fig. 3. Multi-view images from the same gait sequence are preferable for training the generative approaches, because the generative approaches aims at transforming a gait feature of one view to that of another view with being free from intra-subject variations. Hence, they are useful for training the gener-ative approaches within camera view 1 to 7, and camera view 1’ to 7’, respectively, but not for training them across one of camera views 1 to 7 and another one of camera views 1’ to 7’.
On the other hand, such intra-subject variations of gait itself actually exist between probe and gallery gait sequences in a real situation, and hence we need to cope with them. Discriminative approaches aim at mitigating both view variations and intra-subject variations of gait itself at the same time, and hence the intra-subject vari-ations of gait itself included the training set are rather welcomed to train a better discriminative models. Our database contains intra-subject variations of gait itself for all the camera views because of two gait sequences cap-tured for each camera. Hence, they are also useful for training the discriminative approaches.
3.2 Procedure of gait feature extraction
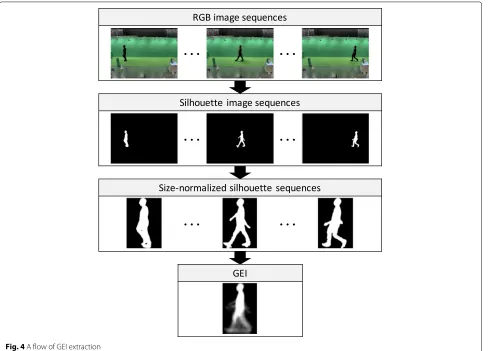
We extract Gait Energy Images (GEIs) [8], also known as averaged silhouette [31], as gait feature for performance evaluation. GEI is the most prevalent gait feature which is obtained by simply aggregating the silhouette sequence over one gait period. Thus, a GEI represents a mixture of static and dynamic parts.
This section briefly describes how to extract GEIs in our dataset (see Fig.4). The procedure is as follows:
Fig. 2Camera setup
2. Size-normalization. Silhouette extracted in step 1 is normalized by size based on the method used in [22]. First, the top, bottom, and horizontal center of the silhouette regions are obtained for each frame. Second, a moving-average filter is applied to these positions. Third, we normalized the size of the silhouette images such that the height is just 128 pixels according to the average positions, and the aspect ratio of each region is maintained. Finally, we produce an 88× 128 pixel image in which the average horizontal median corresponds to the horizontal center of the image.
3. Gait period detection. Gait period is detected based on size-normalized silhouette sequences from cam1 by using the method proposed in [22]. We adopt the normalized auto correlation (NAC) of the
size-normalized silhouette images for the temporal axis and determine the gait period as the frame shift
Fig. 3Definition of view angles
corresponding to the second peak of the NAC. Since, in our dataset, gait images captured by seven cameras simultaneously, the gait period detected based on silhouette sequences of cam1 is also used as the gait period for the other six cameras (cam2–7). 4. GEI extraction. GEI is extracted by averaging the
size-normalized silhouette sequences pixel-wise over one gait period. If several gait periods are detected from one walking sequence, the nearest one to the center of the walking course is used. Examples of generated GEIs for each view angles are shown in Fig.5.
3.3 Subject statistics
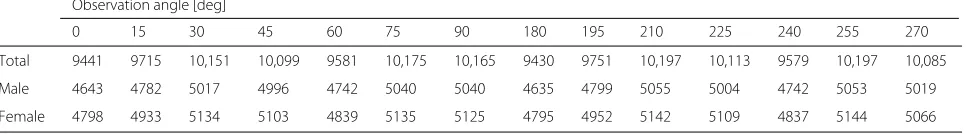
We captured gait images of 78,378 subjects by the frame-work mentioned above from 15 July 2015 to 27 June 2016 and defined a subset of gait images of 10,307 subjects (5114 males and 5193 females with vairous ages, ranging from 2 to 87 years) from 14 view angles, ranging 0°−90°, 180°−270°. Moreover, since they are captured from Octo-ber to February, subjects wear various clothes according to a season change. Detailed distributions of the subjects’ gender and age are shown in Fig.6. Almost all the sub-jects are of Asian descent. Over 100 subsub-jects are included for every 5 years from 5 to 69 years old for each gender. Therefore, the dataset is useful not only for cross-view gait recognition but also for age estimation or gender classi-fication. The number of subjects of each view angles is summarized in Table2. Note that the number of subjects are slightly different among view angles since low qual-ity GEIs with a large loss or blur are removed with visual confirmation.
4 Performance evaluation of cross-view gait recognition
Fig. 4A flow of GEI extraction
and discriminative approaches. In addition, we con-sidered two settings: recognition with a cooperative gallery subject (i.e., cooperative setting) and with an uncooperative gallery subject (i.e., uncooperative setting). View angles of the gallery GEIs are the same among enrolled subjects in cooperative setting, whereas
they may differ for each subject in uncooperative setting.
Second, we analyzed a sensitivity of the number of training subjects on the recognition accuracy when we adopt the state-of-the-art cross-view gait recognition, i.e., CNN-based method.
Fig. 6Distributions of the subjects’ gender and age. “Unknown” indicates the cases where declared ages are judged strange by visual confirmation
4.1 Benchmarks
We describe eight existing methods used for evaluation experiments. Two of them are generative approaches, five of them are discriminative approaches, which further fall into those with and without CNN respectively, and the other one is direct matching without any training, i.e., Euclidean distance between GEIs (call it DM ) as a baseline.
Generative approach
• View transformation model (VTM ) [5]:
As general approaches to cross-view gait recognition, a family of VTM [6,32,33] have been widely studied and a singular value decomposition-based VTM [5] is the most basic one among them. We then exploit it as a baseline for the generative approach.
The method obtains the VTM with training data of multiple subjects from multiple view angles. In a recognition phase, the VTM transforms gallery features into the same view angle as that of an input feature, and the features match under the same view. • Double quality-dependent VTM (wQVTM) [34]:
Among the family of VTMs, wQVTM is the most advanced one, and hence we exploited it as the state-of-the-art of the generative approaches. This VTM-based method incorporates a score
normalization framework with quality measures that encode the degree of the fitness of the trained VTM to gallery and test data.
Discriminative approach without CNN
• Linear discriminant analysis (LDA) [35]:
The method is based on linear discriminant analysis, which is the most conventional approach and hence widely exploited in many fields (e.g., Fisher face [36]). We therefore adopt this a a baseline for the
discriminative approach.
Specifically, we first apply principal component analysis (PCA) to an unfolded feature vector of GEI to reduce dimension and subsequently apply LDA to get discriminant features.
Discriminative approach with CNN
• 1in-GEINet [19](see Fig.7a):
The method is based on one of the simplest CNN where one input GEI is fed and the number of nodes in the final layer (fc4) is equal to the number of training subjects. Soft-Max value calculated from output of the final layer is regarded as a sort of probability of matching up to a corresponding subject.
Table 2The number of subjects in OU-ISIR MVLP
Observation angle [deg]
0 15 30 45 60 75 90 180 195 210 225 240 255 270
Total 9441 9715 10,151 10,099 9581 10,175 10,165 9430 9751 10,197 10,113 9579 10,197 10,085
Male 4643 4782 5017 4996 4742 5040 5040 4635 4799 5055 5004 4742 5053 5019
a
c
d
b
Fig. 7Network architectures of CNN-based methods. Numbers written on left side of conv, pool, fc indicate [(#kernel)×(kernel size, width×height) / (stride)], [(#kernel size, width×height) / (stride)], [(#output node)] respectively.Nswritten on 1in-GEINet indicates the number of training subjects.a1in-GEINet,bSiamese,cMT,dLB
• Siamese [20,37,38] (see Fig.7b):
The method is based on two parallel CNNs known as Siamese network with shared parameters. In the network, output of fc4 layer is regarded as a feature vector of each input GEI. A contrastive loss for each pair is defined asd2(squared L2 distance of the feature vectors of two input GEIs) if they are the same subject, or as so-called hinge loss, i.e., max(margin -d,0)2if they are different subjects.
• Mid-level at the top (MT) [17] (see Fig.7c): The method is based on two parallel CNNs with shared parameters where two non-linear projections are applied before computing the differences between pairs of images on conv3 layer. The pixel-wise summation of weighted entries by using pair-filter is calculated as output of conv3 layer. Soft-Max value indicates a probability of an event that they are the same subject.
• Local at the bottom (LB) [17](see Fig.7d): The method is based on CNN whose structure is similar to MT except for a layer where we compute the differences between pairs of images. A linear projection is applied before computing the differences between pairs of GEIs on conv1 layer.
Direct matching
• Direct matching (DM) [22]:
The method based on direct matching, i.e., L2 distance in the original feature space. We regard GEIs as feature vectors whose dimension is equal to the number of pixels in GEI and compute L2 distance of two GEIs as a dissimilarity.
4.2 Setup
We divided the 10,307 subjects into two disjoint groups of almost the same size, that is, 5153 training and 5154 test-ing subjects. Additionally, as mentioned previously, each subject had 28 GEIs (14 view angles× 2 sequences).
For the generative approaches, it was assumed that probe and gallery view angles are known and the VTM from a source view to a target view are trained using gait features with possible view angle. On the other hand, for the discriminative approaches, in order to roughly align walking direction in GEIs, GEIs with over 180° view angle, were flipped right-to-left based on perspec-tive projection assumption [39], and parameters of CNN or LDA model are trained for data including all view angle data simultaneously. Note that rough walking direc-tion estimadirec-tion (leftward vs. rightward) is relatively easily done compared with detailed pair-wise view estimation (30° vs. 45°) required in the generative approaches.
Hyper-parameters of CNN are determined in an ad hoc manner without applying parameter tuning. However, we confirmed that over-fitting was not occurred and learnt parameters were converged sufficiently.
4.3 Evaluation criteria
error rates (EERs) of the FAR and the FRR as a trade-off criterion of the verification capability. Moreover, we cal-culated rank 1 identification rate as a criterion of the identification capability.
4.4 Results for a cooperative setting
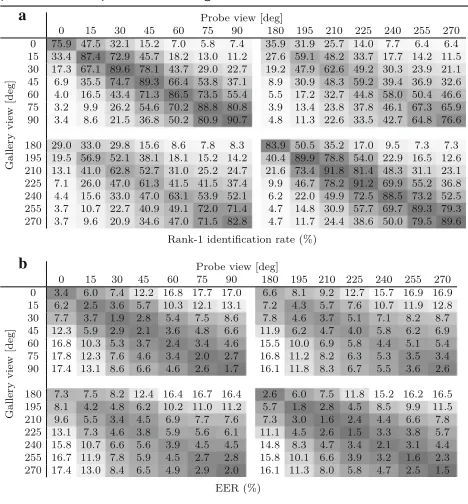
We first evaluated the recognition accuracy of 1in-GEINet, the discriminative approach with the simplest CNN, for all possible view angle paris (14 probe views vs. 14 gallery views) as shown in Table3. As a result, in the case of the same view angles (e.g., 0° vs. 0°), the accu-racy is the highest, and the larger the view differences is, the lower the accuracy become. Moreover, since two GEIs with 180◦view difference (one of them is flipped GEI) are virtually regarded as those from the same-view pair due to perspective projection assumption [39] as described in Section 4.2; the trends of 0–90° gallery vs. 0–90° probe (upper left sub-matrix in Table3) are similar to those of 0–90° gallery vs. 180–270° probe (upper-right sub-matrix in Table 3), 180–270° gallery vs. 0–90° probe (lower-left sub-matrix in Table3), and 180–270° gallery vs. 180–270° probe (lower-right sub-matrix in Table3). For the simplic-ity of the performance evaluation, we focus on four typical view angels (0°, 30°, 60°, 90°) hereafter.
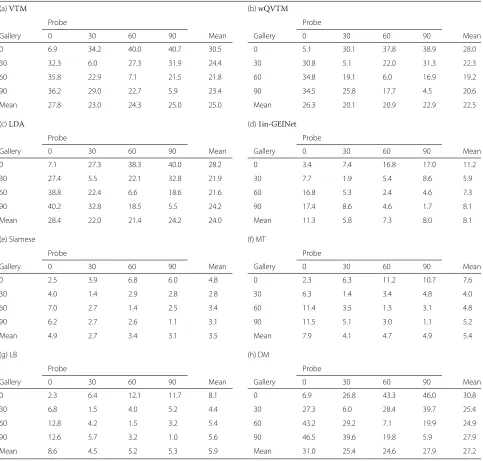
We then evaluated the recognition accuracy of all benchmarks mentioned to in Section4.1for all the pairs of the four typical view angles. The rank 1 identification rates and the EERs are shown in Tables4and5, respectively.
Table 3Recognition accuracy of 1in-GEINet for all view angle pairs for a cooperative setting
a
b
Darkness of cells in table indicates goodness of recognition accuracy
Naturally, DM only works for pairs of the same view angle and poorly perform for the pair of the different view angles, since it is directly affected by spatial dis-placement of the corresponding body parts in GEIs due to view angle difference (i.e., large intra-subject vari-ation). On the other hand, the accuracies of the dis-criminative approach without CNN, i.e., LDA, and the generative approach, i.e., VTM and wQVTM, are a lit-tle bit better than that of DM except for the case of the rank 1 identification rate of wQVTM. This is because the VTM-based method, mitigates spatial displacement of the corresponding body parts in GEIs by view transfor-mation process, while that the discriminative approaches mitigate the intra-subject differences due to view vari-ations. Thus, degree of decrease of accuracy depending on the view angle difference in these cases is limited compared with the case of DM. As for wQVTM, the dis-similarity of GEIs is corrected depending on the quality of generated GEI based on trained VTM. If a GEI for testing is much different from GEIs for training, qual-ity of the GEI for testing becomes low, the dissimilarqual-ity is modified based on its low quality so as to lessen the dissimilarity considerably, and hence it behaves as a so-called wolf in Doddington biometric zoo concept [40]. This is why the rank 1 identification rates of wQVTM is worse. This problem would not be revealed when using OU-ISIR LP database or CASIA dataset B. It is because that view angle difference of OU-ISIR LP dataset is small, CASIA dataset B has a small subject variation and both of them have a small walking variation due to captur-ing under operator’s control. By uscaptur-ing our dataset with a large number of subjects from a wide range of view angle, such problem can be evaluated in a statistically reliable way.
As for discriminative approaches with CNN, we can see their accuracies are relatively better than the other family of approaches. Taking a closer look at those approaches, we also noticed that 1in-GEINet yielded the best accuracy for the identification task (i.e., rank 1 identification rate), while the Siamese yielded the best performance for the verification task (i.e., EER). We will discuss these points in Subsection4.7.
Table 4Rank 1 identification rate (%) for thinned view angle pairs for a cooperative setting
(a)VTM (b)wQVTM
Probe Probe
Gallery 0 30 60 90 Mean Gallery 0 30 60 90 Mean
0 68.8 0.5 0.2 0.1 17.4 0 0.1 0.0 0.0 0.0 0.0
30 0.7 82.2 2.1 0.8 21.4 30 0.0 81.7 0.0 0.8 20.6
60 0.3 3.2 77.6 5.4 21.6 60 0.0 0.0 78.0 0.0 19.5
90 0.2 1.1 4.2 80.9 21.6 90 0.0 0.0 0.0 0.0 0.0
Mean 17.5 21.7 21.0 21.8 20.5 Mean 0.0 20.4 19.5 0.2 10.0
(c)LDA (d)1in-GEINet
Probe Probe
Gallery 0 30 60 90 Mean Gallery 0 30 60 90 Mean
0 70.0 3.2 0.3 0.2 18.4 0 75.9 32.1 7.0 7.4 30.6
30 4.6 87.1 11.1 1.9 26.2 30 17.3 89.6 43.7 22.7 43.3
60 0.3 9.3 83.3 19.5 28.1 60 4.0 43.4 86.5 55.4 47.3
90 0.1 0.6 12.6 85.9 24.8 90 3.4 21.5 50.2 90.7 41.5
Mean 18.7 25.0 26.8 26.9 24.4 Mean 25.2 46.6 46.8 44.0 40.7
(e) Siamese (f) MT
Probe Probe
Gallery 0 30 60 90 Mean Gallery 0 30 60 90 Mean
0 52.7 23.7 11.1 11.3 24.7 0 70.7 16.7 4.4 3.9 23.9
30 18.4 78.6 32.6 27.6 39.3 30 14.1 88.1 36.9 17.0 39.0
60 8.0 33.5 76.1 39.6 39.3 60 4.0 39.2 85.7 44.2 43.3
90 7.9 26.5 36.5 82.1 38.2 90 3.2 16.2 43.4 89.3 38.0
Mean 21.8 40.6 39.1 40.1 35.4 Mean 23.0 40.0 42.6 38.6 36.1
(g) LB (h) DM
Probe Probe
Gallery 0 30 60 90 Mean Gallery 0 30 60 90 Mean
0 74.4 16.5 3.5 2.8 24.3 0 68.8 0.8 0.1 0.0 17.4
30 13.6 89.3 36.0 16.2 38.8 30 1.2 82.2 1.4 0.3 21.3
60 2.9 36.2 88.4 44.7 43.0 60 0.1 1.1 77.5 5.6 21.1
90 2.2 14.0 41.2 91.7 37.3 90 0.0 0.2 4.1 80.9 21.3
Mean 23.3 39.0 42.3 38.9 35.9 Mean 17.5 21.1 20.8 21.7 20.3
gallery viewθ can be a good approximation for that for gallery view (360° –θ) based on the left-right gait sym-metry assumption as introduced in the literature [39], and hence substituted these accuracies for gallery view (360° – θ) by those for gallery view θ in Fig. 8. As a result, the accuracies for frontal-view (i.e., 0°) probe rapidly drop as the view angle difference increases because 0° gait features lack important forward-backward motions (e.g., arm swing and stride) and such motions gradu-ally appear as the view angle increases from 0° to 90°, which makes matching more difficult. On the other hand, the accuracy drop for side-view (i.e., 90°) probe is a little bit mitigated compared with 0° probe, because
Table 5EER (%) for thinned view angle pairs for a cooperative setting
(a)VTM (b)wQVTM
Probe Probe
Gallery 0 30 60 90 Mean Gallery 0 30 60 90 Mean
0 6.9 34.2 40.0 40.7 30.5 0 5.1 30.1 37.8 38.9 28.0
30 32.3 6.0 27.3 31.9 24.4 30 30.8 5.1 22.0 31.3 22.3
60 35.8 22.9 7.1 21.5 21.8 60 34.8 19.1 6.0 16.9 19.2
90 36.2 29.0 22.7 5.9 23.4 90 34.5 25.8 17.7 4.5 20.6
Mean 27.8 23.0 24.3 25.0 25.0 Mean 26.3 20.1 20.9 22.9 22.5
(c)LDA (d)1in-GEINet
Probe Probe
Gallery 0 30 60 90 Mean Gallery 0 30 60 90 Mean
0 7.1 27.3 38.3 40.0 28.2 0 3.4 7.4 16.8 17.0 11.2
30 27.4 5.5 22.1 32.8 21.9 30 7.7 1.9 5.4 8.6 5.9
60 38.8 22.4 6.6 18.6 21.6 60 16.8 5.3 2.4 4.6 7.3
90 40.2 32.8 18.5 5.5 24.2 90 17.4 8.6 4.6 1.7 8.1
Mean 28.4 22.0 21.4 24.2 24.0 Mean 11.3 5.8 7.3 8.0 8.1
(e) Siamese (f) MT
Probe Probe
Gallery 0 30 60 90 Mean Gallery 0 30 60 90 Mean
0 2.5 3.9 6.8 6.0 4.8 0 2.3 6.3 11.2 10.7 7.6
30 4.0 1.4 2.9 2.8 2.8 30 6.3 1.4 3.4 4.8 4.0
60 7.0 2.7 1.4 2.5 3.4 60 11.4 3.5 1.3 3.1 4.8
90 6.2 2.7 2.6 1.1 3.1 90 11.5 5.1 3.0 1.1 5.2
Mean 4.9 2.7 3.4 3.1 3.5 Mean 7.9 4.1 4.7 4.9 5.4
(g) LB (h) DM
Probe Probe
Gallery 0 30 60 90 Mean Gallery 0 30 60 90 Mean
0 2.3 6.4 12.1 11.7 8.1 0 6.9 26.8 43.3 46.0 30.8
30 6.8 1.5 4.0 5.2 4.4 30 27.3 6.0 28.4 39.7 25.4
60 12.8 4.2 1.5 3.2 5.4 60 43.2 29.2 7.1 19.9 24.9
90 12.6 5.7 3.2 1.0 5.6 90 46.5 39.6 19.8 5.9 27.9
Mean 8.6 4.5 5.2 5.3 5.9 Mean 31.0 25.4 24.6 27.9 27.2
weak perspective projection assumption. The accuracy for the oblique-view probe averaged over the view range where the view difference between the probe and the gallery is from −90° to 90° is better than those for the frontal and side views. This point is more clar-ified by the averaged accuracies for probe views as shown in Fig.9.
4.6 Results for an uncooperative setting
We employed the same subject lists as the cooperative setting to evaluate the uncooperative setting. Gallery views are randomly selected from 14 view angles (0°, 15°,· · ·, 270°) for each subject. The results for the
a
b
Fig. 8Averaged accuracies for each angular differences.aRank 1 identification rate.bEER
view range (14 views) is wider than cooperative one (0°, 30°, 60°, 90°).
Actually the mean rank 1 identification rates for the cooperative setting in 1in-GEINet for all gallery view angles (14 views) and typical probe view angles (4 views), which is shown as the results of Table3a, are 16.0, 44.9, 42.9, and 42.6% in the cases of 0°, 30°, 60°, 90° prove views, respectively. And these results are comparable (in fact, slightly better) with those of the uncooperative setting shown in Table6(15.7, 41.0, 39.7, and 39.5%, respectively). The slight performance degradation of the uncooperative setting is described as the difference between probe and gallery GEIs of the same subject with different view angles is sometimes larger than that of different subjects with the same view angle, which is actually an essential challeng-ing aspect of the uncooperative settchalleng-ing. In other words, this limited performance degradation of the uncoopera-tive setting compared with the cooperauncoopera-tive setting means that the discriminative approaches with CNNs overcome the difficulties of the uncooperative setting by effectively
Fig. 9Averaged accuracies for each typical probe views
suppressing the appearance changes due to view angle differences while keeping the inter-subject appearance variation.
4.7 Discussion
We discussed the experimental results of the discrimina-tive approaches with CNN from several viewpoints.
1in-GEINet vs. Siamese, MT, and LB In 1in-GEINet,
namely, the method based on CNN with one input, the parameters of CNN are trained so that the soft-max of the node of fc4 layer corresponding to the same subject as input GEI can be high. Specifically, the soft-max loss is calculated as cross-entropy of the soft-max of correspond-ing node. Since the soft-max normalized scores as that their summation is equal to one, not the absolute value of scores before soft-max but the relative scores against the other subjects are highlighted. Because the identification rate depending not on absolute scores but on this relative scores among the subjects, it is more suitable for the iden-tification task rather than verification task, where absolute score affects the performance.
On the other hand, in Siamese, MT, and LB, namely, the methods based on CNN with two inputs, the param-eters are learned so that it is easy to discriminate whether two inputs are the same subject or not. Therefore, these methods look effective as methods for verification task.
In fact, according to Tables4 and5, the rank 1 iden-tification rates of 1in-GEINet is better than those of the other CNNs with two inputs. Moreover, EERs of two input CNNs are better than those of 1in-GEINet.
Table 6Recognition accuracy for uncooperative setting
(a) Rank 1 identification rate (%) (b) EER
Probe Probe
Method 0 30 60 90 Mean Method 0 30 60 90 Mean
LDA 8.1 12.4 12.3 11.8 11.1 LDA 32.1 27.9 28.7 30.6 29.8
1in-GEINet 15.7 41.0 39.7 39.5 34.0 1in-GEINet 14.4 6.3 7.8 8.1 9.2
Siamese 15.6 36.2 33.1 36.5 30.3 Siamese 5.9 2.9 3.8 3.4 4.0
LB 14.2 32.7 32.3 34.6 28.5 LB 9.5 4.7 5.5 5.1 6.2
MT 11.1 31.5 31.1 29.8 25.9 MT 8.9 4.1 4.9 4.8 5.7
DM 7.1 7.4 7.5 9.7 7.9 DM 46.1 40.1 42.2 46.3 43.7
or the first part of the CNN before going through full connection.
Thus, MT and LB is directly affected by appearance difference both derived from inter-subject difference and intra-subject difference due to spatial displacement of the corresponding body parts by view angle differences than Siamese.
As a result shown in Tables4and5, in the case of the small (no) view angle difference, the accuracy of LB and MT is higher than that of Siamese since leveraging the inter-subject difference is more effective than mitigating the intra-subject difference due to view angle differences in such a case. On the other hand, in the case of a larger view angle difference, Siamese is better than LB and MT, since mitigating the intra-subject difference due to view angle difference is more effective than leveraging the inter-subject difference.
MT vs. LB In LB, two raw GEIs are compared at the first part, on the other hand, in MT, two compressed GEIs by convolution and pooling layers are compared at the mid-dle part of the CNN. LB where comparing the raw GEIs more leverages appearance difference considering spa-tial proximity than MT where comparing the compressed GEIs.
According to Tables4and5, in the case of the small (no) view angle difference, the accuracy of LB is higher, while in the case of a larger view angle difference, the accuracy of MT is higher.
Discussion summary We summarize the discussion in
this section as follows:
1. 1in-GEINet, CNN with one input, is effective for identification task, and Siamese, MT, and LB, CNNs with two inputs, are effective for verification task. 2. Compared with CNNs with two inputs, degree of leveraging the inter-subject difference considering spatial proximity is LB>MTSiamese, on the other hand, degree of mitigating the intra-subject
differences due to view angle difference is Siamese MT > LB.
4.8 Sensitivity of the number of training subjects on recognition accuracy
The accuracy of CNN-based method largely depends on the number of training samples. We analyze the sensitivity of the number of training subjects on the recognition accuracy. Three hundred and seven sub-jects among 10,307 subsub-jects in our dataset are used for testing data and various number of subjects among the rest 10,000 subjects are used for training data. 1in-GEINet with the simplest network architecture was used in the experiment.
The sensitivity is shown in Fig.10. Note that the aver-aged result for all view angle pairs for cooperative setting are plotted on the graph. From this graph, the larger the number of training subjects become the better the accuracy is. Additionally according to Fig. 1, the rank 1 identification rate of 10,000 training subjects is higher by approximately 23% compared to that of 150 training sub-jects, i.e., the almost same number of subjects for CASIA dataset B and WOSG with the largest population among
a
b
Fig. 11Relation between the number of training subjects and recognition accuracy for each angular differences.aRank 1 identification rate.bEER
the existing databases with wide view angles, and EER of 10,000 training subjects is lower by approximately 5%.
Furthermore, the results for four typically angular difference (0°, 30°, 60°, 90°) are shown in Fig. 11. From these graphs, in the case of smaller view difference, the accuracy remain to high even if the number of training subjects decreases. In contrast, in the case of larger view difference, the accuracy drastically drop as an amount of view difference become larger. In such a case, it is not easy to authenticate gait images because intra-subject appear-ance variations by view differences can be larger than inter-subject appearance variations. Therefore, database with more various view angles would be required for sufficient training.
From the above results, it has been confirmed that the accuracy of the cross-view gait recognition was increased significantly with an increase in the number of training subjects for CNN-based methods which requires a large training data, especially in the case of large view differ-ence. Thus, it indicated the importance of our dataset, OU-ISIR MVLP, with a large subject number and large view variation.
5 Conclusion
This paper described the construction of a gait database comprising a large population dataset with a wide view angle and presented a statistically reliable performance evaluation of vision-based cross-view gait recognition. This dataset has the following advantages over existing gait databases: (1) the number of subjects is 10,307, which is more than two times greater than the number of existing public large-scale database, (2) the view angle variation is wide, 14 view angles, ranging 0°−90°, 180°−270°, (3) the quality of all GEIs is guaranteed by visual confirmation.
Using our dataset, we carried out a statistically reliable performance comparison of cross-view gait recognition by various approaches. Moreover, we confirmed the effec-tiveness of our dataset with the largest population for
recent CNN-based approaches to gait recognition which generally requires a large number of training samples but achieves the state-of-the-art performance.
Further analysis of gait recognition performance using our dataset is still needed. For example, our dataset enables the evaluation of gender classification or age esti-mation, cross-database recognition. Thus, evaluating such problems is a future work. Though we evaluated only GEI-based methods in order to compare gait recogni-tion methodologies, there are many gait features that can be used for input images, such as DeepGait [41], CGI (chrono-gait image) [42], and FDF (frequency-domain feature) [43]. Thus, evaluating such gait features is also a future work.
Endnote
1The data have been published in the form of
silhou-ette image sequences and GEIs (Gait Energy Images) in PNG format. http://www.am.sanken.osaka-u.ac.jp/ BiometricDB/GaitMVLP.html.
Acknowledgements
This work was supported by JSPS Grants-in-Aid for Scientific Research (A) JP15H01693, and the JST CREST “Behavior Understanding based on Intention-Gait Model” project.
Authors’ contributions
NT and DM participated in the experiments for performance evaluation of gait recognition. YM collected the gait data. NT generated the gait database. NT, YM, and DM prepared the manuscript. YM, DM, TE, and YY gave technical support and conceptual advice. TE and YY designed the study. All authors read and approved the final manuscript.
Competing interests
The authors declare that they have no competing interests.
Publisher’s Note
Springer Nature remains neutral with regard to jurisdictional claims in published maps and institutional affiliations.
Author details
1Osaka University, Ibaraki, Japan.2Osaka Electro-Communication University,
Neyagawa, Japan.
References
1. Bouchrika I, Goffredo M, Carter J, Nixon M (2011) On using gait in forensic biometrics. J Forensic Sci 56(4):882–889
2. Lynnerup N, Larsen PK (2014) Gait as evidence. IET Biom 3(2):47–54. 6 3. Iwama H, Muramatsu D, Makihara Y, Yagi Y (2013) Gait verification system
for criminal investigation. IPSJ Trans Comput Vis Appl 5:163–175 4. Kale A, Roy-Chowdhury A, Chellappa R (2003) Towards a view invariant
gait recognition algorithm. In: Proc. of IEEE Conf. on Advanced Video and Signal Based Surveillance. IEEE, Miami. pp 143–150
5. Makihara Y, Sagawa R, Mukaigawa Y, Echigo T, Yagi Y (2006) Gait recognition using a view transformation model in the frequency domain. In: Proc. of the 9th European Conference on Computer Vision. Springer, Berlin, Heidelberg. pp 151–163
6. Kusakunniran W, Wu Q, Zhang J, Li H (2012) Gait recognition under various viewing angles based on correlated motion regression. IEEE Trans Circ Syst Video Technol 22(6):966–980
7. Goffredo M, Bouchrika I, Carter JN, Nixon MS (2010) Self-calibrating view-invariant gait biometrics. IEEE Trans Syst Man Cybern B Cybern 40(4):997–1008
8. Han J, Bhanu B (2006) Individual recognition using gait energy image. IEEE Trans Pattern Anal Mach Intell 28(2):316–322
9. Bashir K, Xiang T, Gong S (2010) Gait recognition without subject cooperation. Pattern Recogn Lett 31(13):2052–2060
10. Martin-Felez R, Xiang T (2014) Uncooperative gait recognition by learning to rank. Pattern Recognit 47(12):3793–3806
11. Mansur A, Makihara Y, Muramatsu D, Yagi Y (2014) Cross-view gait recognition using view-dependent discriminative analysis. In: The 2nd IEEE Int. Joint Conf. on Biometrics (IJCB 2014). IEEE, Clearwater. pp 1–8 12. Hinton GE, Osindero S, Teh Y-W (2006) A fast learning algorithm for deep
belief nets. Neural Comput 18(7):1527–1554
13. Ilsvrc, imagenet large scale visual recognition challenge.http://www. image-net.org/challenges/LSVRC/. Accessed 4 Feb 2018
14. Ji S, Xu W, Yang M, Yu K (2013) 3d convolutional neural networks for human action recognition. IEEE Trans Pattern Anal Mach Intell 35(1):221–231
15. Karpathy A, Toderici G, Shetty S, Leung T, Sukthankar R, Fei-Fei L (2014) Large-scale video classification with convolutional neural networks. In: Computer Vision and Pattern Recognition (CVPR), 2014 IEEE Conference on. IEEE, Columbus. pp 1725–1732
16. Taigman Y, Yang M, Ranzato M, Wolf L (2014) Deepface: closing the gap to human-level performance in face verification. In: Computer Vision and Pattern Recognition (CVPR), 2014 IEEE Conference on. IEEE, Columbus. pp 1701–1708
17. Wu Z, Huang Y, Wang L, Tan T (2016) A comprehensive study on cross-view gait based human identification with deep cnns. IEEE Trans Pattern Anal Mach Intell 1(1):1–10
18. Wu Z, Huang Y, Wang L (2015) Learning representative deep features for image set analysis. IEEE Trans Multimed 17(11):1960–1968
19. Shiraga K, Makihara Y, Muramatsu D, Echigo T, Yagi Y (2016) Geinet: View-invariant gait recognition using a convolutional neural network. In: Proc. of the 9th IAPR International Conference on Biometrics. IEEE, Halmstad. pp 1–8
20. Takemura N, Shiraga K, Makihara Y, Muramatsu D, Echigo T, Yagi Y (2016) View-invariant gait recognition using convolutional neural network (in japanese). IEICE Trans Fundam (Japan Ed) J99-A(12):440–450 21. Yu S, Tan D, Tan T (2006) A framework for evaluating the effect of view
angle, clothing and carrying condition on gait recognition. In: Proc. of the 18th Int. Conf. on Pattern Recognition, vol 4. IEEE, Hong Kong. pp 441–444 22. Iwama H, Okumura M, Makihara Y, Yagi Y (2012) The ou-isir gait database
comprising the large population dataset and performance evaluation of gait recognition. IEEE Trans Inf Forensic Secur 7(5):1511–1521 23. Samangooei S, Bustard J, Seely R, Nixon M, Carter J (2011) On acquisition
and analysis of a dataset comprising of gait, ear and semantic data. In: Multibiometrics for Human Identification. CUP. pp 277–301. Chapter 12 24. Gross R, Shi J (2001) The cmu motion of body (mobo) database. Technical
report, CMT
25. López-Fernández D, Madrid-Cuevas FJ, Carmona-Poyato Á,
Marín-Jiménez MJ, Mu ˙noz-Salinas R (2014) The AVA Multi-View Dataset for Gait Recognition. Springer International Publishing, Cham 26. DeCann B, Ross A, Dawson J (2013) Investigating gait recognition in the
short-wave infrared (swir) spectrum: Dataset and challenges. In: Proc. of SPIE Conference on Biometric Technology for Human Identification X. SPIE Press, Baltimore. pp 1–16
27. Iwashita Y, Baba R, Ogawara K, Kurazume R (2010) Person identification from spatio-temporal 3d gait. In: 2010 International Conference on Emerging Security Technologies. IEEE, Canterbury. pp 30–35
28. Makihara Y, Mori A, Yagi Y (2010) Temporal super resolution from a single quasi-periodic image sequence based on phase registration.
Queenstown, New Zealand
29. Seely RD, Samangooei S, Lee M, Carter JN, Nixon MS (2008) The university of southampton multi-biometric tunnel and introducing a novel 3d gait dataset. In: Proc. of IEEE Second International Conference on Biometrics: Theory, Applications and Systems. IEEE, Arlington. pp 1–6
30. Makihara Y, Kimura T, Okura F, Mitsugami I, Niwa M, Aoki C, Suzuki A, Muramatsu D, Echigo T, Yagi Y (2016) Gait collector: an automatic gait data collection system in conjunction with an experience-based long-run exhibition. In: Proc. of the 9th IAPR International Conference on Biometrics. IEEE, Halmstad. pp 1–8
31. Liu Z, Sarkar S (2004) Simplest representation yet for gait recognition: averaged silhouette. In: Proc. of the 17th International Conference on Pattern Recognition. IEEE, Cambridge Vol. 1. pp 211–214
32. Kusakunniran W, Wu Q, Li H, Zhang J (2009) Multiple views gait recognition using view transformation model based on optimized gait energy image. In: Proc. of the 2nd IEEE International Workshop on Tracking Humans for the Evaluation of their Motion in Image Sequences. pp 1058–1064
33. Muramatsu D, Makihara Y, Yagi Y (2015) Cross-view gait recognition by fusion of multiple transformation consistency measures. IET Biom 4:62–73(11)
34. Muramatsu D, Makihara Y, Yagi Y (2016) View transformation model incorporating quality measures for cross-view gait recognition. IEEE Trans Cybern PP(99):1–1
35. Otsu N (1982) Optimal linear and nonlinear solutions for least-square discriminant feature extraction. In: Proc. of the 6th Int. Conf. on Pattern Recognition. IEEE, Munich. pp 557–560
36. Belhumeur PN, Hespanha JP, Kriegman DJ (1997) Eigenfaces vs. fisherfaces: recognition using class specific linear projection. IEEE Trans Pattern Anal Mach Intell 19(7):711–720
37. Chopra S, Hadsell R, Lecun Y (2005) Learning a similarity metric discriminatively, with application to face verification. In: Proc. of IEEE Computer Society Conference on Computer Vision and Pattern Recognition. IEEE, SanDiego. pp 539–546
38. Zhang C, Liu W, Ma H, Fu H (2016) Siamese neural network based gait recognition for human identification. In: 2016 IEEE International Conference on Acoustics, Speech and Signal Processing (ICASSP). IEEE, Shanghai. pp 2832–2836
39. Makihara Y, Sagawa R, Mukaigawa Y, Echigo T, Yagi Y (2006) Which reference view is effective for gait identification using a view
transformation model?. In: Proc. of the IEEE Computer Society Workshop on Biometrics 2006, New York
40. Doddington G, Liggett W, Martin A, Przybocki M, Reynolds D (1998) Sheep, goats, lambs and wolves a statistical analysis of speaker performance in the nist 1998 speaker recognition evaluation. In: Proc. of International Conference on Spoken Language Processing. ASSTA, Sydney 41. Li C, Min X, Sun S, Wenqian L, Tang Z (2017) Deepgait: a learning deep
convolutional representation for view-invariant gait recognition using joint bayesian. Appl Sci 7:15. 02
42. Wang C, Zhang J, Wang L, Pu J, Yuan X (2012) Human identification using temporal information preserving gait template. IEEE Trans Pattern Anal Mach Intell 34(11):2164–2176
43. Sagawa R, Makihara Y, Echigo T, Yagi Y (2006) Matching gait image sequences in the frequency domain for tracking people at a distance. In: Proc. of the 7th Asian Conf. on Computer Vision, vol 2. Springer, Berlin, Heidelberg. pp 141–150
44. Nixon MS, Carter JN, Shutler J, Grant M (2001) Experimental plan for automatic gait recognition. Technical report, Southampton
![Fig. 7 Network architectures of CNN-based methods. Numberswidthwritten on left side of conv, pool, fc indicate [(#kernel)×(kernel size, × height) / (stride)], [(#kernel size, width × height) / (stride)],[(#output node)] respectively](https://thumb-us.123doks.com/thumbv2/123dok_us/844124.1582127/7.595.57.291.86.538/network-architectures-methods-numberswidthwritten-indicate-stride-output-respectively.webp)