Understanding and evaluating the
behavior of technical users. A study of developer
interaction at StackOverflow
Tanveer Ahmed
*and Abhishek Srivastava
Background
Over the last few years, community based Q&A forums have gained a lot of popularity. These forums present an excellent opportunity to share knowledge, and provide an ideal medium for learning. In this paper, we focus our attention to one of these community driven forums. Specifically, we consider the case of StackOverflow (SO). Though specu-lative, it is recognized as one of the best forums to have technical discussions online. This statement is justified by the growing interest of literature in analyzing the platform from multiple perspectives. There exists work focusing on badges [1], identifying expert
Abstract
This paper is focused on analyzing the details of one of the most widely used Q&A technical discussion forums on the Internet: StackOverflow. StackOverflow is a huge source of information for both academics and industry practitioners and its analysis can provide useful insights. This is evident by a growing body of work dedicated to the study of this platform. There are several papers that have taken the ‘platform’ as an analyzing point to gain a few useful insights into the practices adopted by software developers. However, different from current literature, the objective of this paper is to explore the habit of users, more specifically, we want to find out how do technical users behave online? In doing so, we attempt to present a new picture that focuses more on the human aspect of this online community. We neither focus on the techni-cal aspects of the platform nor do we focus on the technitechni-cal capabilities of developers, rather, the focus of this paper is to explore the humanistic point of view of technical users. To do that, we mine StackOverflow’s repositories to find a few patterns that raise several questions. The observations presented in this paper highlight real world implications of having open call based software engineering platforms. Further, we conduct a survey of StackOverflow users to find an answer to one of the highly talked about topics on Meta (a discussion forum for StackOverflow). The subject of the survey concerns changing participation habit of users. As the paper progresses forward, we discuss factors that raise the issue of professionalism and ethics at this online venue. The findings show several malpractices happening at StackOverflow. We present a detailed analysis and discuss these issues in this paper.
Keywords: Crowdsourcing, Human computer interaction, Human centered computing
Open Access
© The Author(s) 2017. This article is distributed under the terms of the Creative Commons Attribution 4.0 International License (http://creativecommons.org/licenses/by/4.0/), which permits unrestricted use, distribution, and reproduction in any medium, provided you give appropriate credit to the original author(s) and the source, provide a link to the Creative Commons license, and indicate if changes were made.
RESEARCH
behavior [2], finding emotional cues in developers [3], analyzing and recommending tags [4], gamifying participation [5], predicting the status of questions [6], and so on. But, in contrast to typical software engineering studies, our work is motivated by the eagerness to explore human behavior in open crowd based platforms. In doing so, we aim to pre-sent a different side of the coin that focuses more on the humanistic side of technical users. This motivation of ours is backed by evidence in literature where work has tried to explore the typical habits of software developers in the past [7–9]. However, and in con-trast to professional office environments, one can understand Q&A forums are crowd ori-ented and have a strong grounding in voluntarism. In such settings, there is no command–control model, and it is the efforts/will of the volunteers that keep the plat-form going. It would therefore be very much worth the while to analyze the inseparable link between the volunteer and his/her attitude towards the platform. Different from current literature that maintains a balance between the human and the platform, this paper has a skew towards the human. In our attempt, we focus on typical details of human nature, and its corresponding effect that dictates the interaction of people with the online forum. We have found a few interesting patterns that present several new standpoints and raises new questions. Some of the findings are quite surprising. A few, however, blurs the boundary between ethical and non ethical practices. We discuss these instances in detail and present evidence behind each of these problems. To discover such patterns and to find answers, we use two different kind of methods. First, we conduct statistical analysis to look for patterns. This is done by querying SO’s databases online.1 Second, as participating in SO is projected as a game in literature [1, 5, 10], therefore, one of our questions is—Why did you stop playing? To find an answer, we conduct a sur-vey with SO users. This question of ours attracted a lot of debate with the users we con-tacted. In our discussion, there were normal SO users, high reputation users, current SO moderators, and ex-SO moderators. We discuss the details of our attempt from “The observations” section onwards.
Related work
It has been hypothesized in literature that such open forums have the potential of turn-ing into a huge software repository [11]. SO being one such forum has begun to warrant substantial attention in literature. There are several studies that focus on SO from a soft-ware engineering point of view [12–14]. Further, there are different papers that tries to analyze the technical aspect of SO. For instance [15], tries to find patterns that makes a good code example. Barua et al. [16] provide details about the discussion between devel-opers and the latest trends in SO. Linares-Vásquez et al. [17] studies activity in SO when the Android API changes. Literature has also analyzed SO in context of mobile develop-ment [18]. Campos et al. [19] uses the criterion of text based matching to find a potential programming question for a user to answer. Moreover, work has gone deeper and has found that high reputation users are efficient in providing good answers [20, 21]. How-ever, in contrast to these work, the study conducted in this paper makes an attempt to present a different side of SO. Literature on SO has mostly focused its attention on the technical factors, and has overlooked the issue of the human factor. We, on the other
hand, will focus our attention on this issue only. Having said that, there are however a few studies focusing on technical factors with a light touch on the human factors. This is done in the context of getting an answer accepted at SO. There is work target-ing the human affective state [13] and the presentation quality [22] of an answer to get it accepted. We not only draw inspiration from these work, but go deep into the human aspects and explore the behavior of technical users in detail.
As this paper tries to explore a wide array of problem at SO, therefore, there are a few subparts of the study that have similarity to existing work. In this regard, the founda-tional work in [23] tries to analyze SO and correspondingly tries to teach us a few design lessons. The study however was conducted for the initial years of SO. The initial phase witnessed several upsides, however, after almost 8 years now that SO has matured, nega-tives have cropped up. We not only discuss these neganega-tives, but also present additional details. As a result, we complement the work in literature, at much the same time, we also present a few directions to build additional constructive work. Similarly, analysis conducted in [24] specifies that experts as well as non-expert users exhibit logarithmic growth in participation. We present contradictory evidence, and back it with a survey of users, showing that this is not the case anymore. The experts have now backed off. As specified, this paper has a skew towards human behavior at SO. One of the factors dis-cussed in the paper is gender based participation. In this regard, work presented in [10] focus on women in SO. The authors found that women tend to disengage more quickly than men though their level of activity is comparable to men. Our objective with respect to this work is different. We focus on the criterion of a person, either male or female, answering questions asked by the person of the same gender. Our findings revisit the construct of sexism (for both men and women). One of the subtopics of our analysis concerns spatial dynamics of an individual. To this end, Schnek et al. [25] explore the information flow among continents (Asia, Europe, North America etc.). In this paper, however, we do not focus information flow, rather, we focus on the criterion of spa-tial characteristics making an individual help another individual. The inispa-tial pattern we observed raises a few questions about the way people participate in the real world. To thoroughly test the absurd phenomenon, we go into detail. The findings definitely show a different side of the participants at SO. It is specified in literature [26] that the first per-son to answer a question gets a high score for their post. Furthermore, the median time to answer in SO is 16 min. Taking inspiration from this report, we conducted a few tests. The results we obtained raised a few doubts. In our endeavor to clear the dilemma, we found a pattern that revisited the issue of ethics. We analyzed more, and consequently, found additional unethical practices.
set of standard, expectation, method of working, and motivation. It is therefore logical to analyze these attributes and put them under scrutiny. This paper has the motive to explore some of those humanistic characteristics.
The observations
In this section, we present a few details that are a result of typical human behavior. In this regard, we first summarize the workings of SO in brief. These are as follows:
• StackOverflow is an online system where anyone can ask a question and get an
answer from the crowd.
• It has more than 4.8M users, 11M questions, 19M answers, 47M comments.
• Meta is the venue where users discuss matters related to the everyday activities of
SO.
• Posts in SO terminology refers to questions as well as answers.
• A user is awarded score points for good posts.
• Reputation of users is determined by the score of the post.
• A good number of reputation points results in badges.
• Participation at SO is ‘gamified’ using the idea of reputation points and badges.
Spatial characteristics
Table
1
Na
tion wise r
esp
onses
A
ns b
y/ ques b
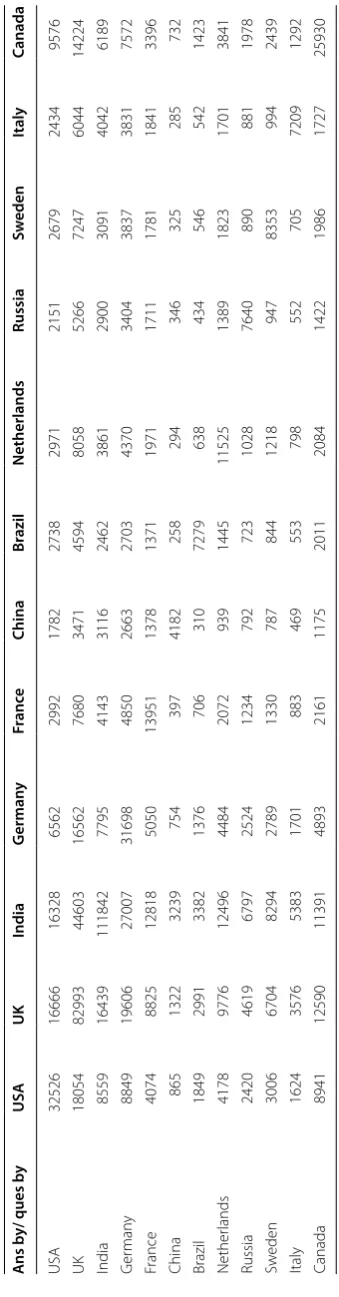
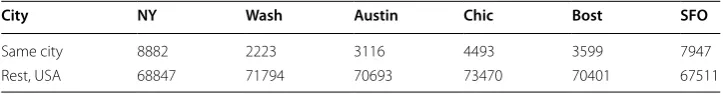
the people from the same city was highest. The results we obtained clearly demonstrated that people have a skew towards the same locality. Therefore, to take one more step in this observation, we took top 10 cities (quantitatively) of a country and cross-referenced answers provided by people from the same city and from the rest of the country. For instance, we took Questions from New York and checked answers provided by the people of New York and the rest of the country, i.e. USA excluding New York. This test was con-ducted for all the previously specified 12 countries. However, in the results, and again the answers provided by people from the same city was high. Evidence for this test is shown in Tables 2 and 3, results for USA and India is presented. For reasons of brevity, the num-ber of test subjects for a few of the cities from USA are shown in Table 4. For this particu-lar observation, although people have the same nationality and clearly the numbers are against the odds, but the results indicate that people prefer answering to a fellow from the same locality more. These statistics are a clear indication that people in SO prefer a person who is similar to them. Through our study of the crowd’s behavior, we realized that the definition of the crowd implies a faceless entity [29], but one has to understand that to the crowd the requester is not faceless (e.g. the one answering a question can see the one asking the question). In this context, there are several studies in sociology inves-tigating the effect of race [30], gender and similarity [31], status [32] on people’s attitude toward others. Moreover, and specially in context of location based helping people, lit-erature has found that people often help others when they belong to the same locality or share similar spatial characteristics [33]. Though the exact reason why people behave this way is unclear, but the evidence we found and prior research in the domain has confirmed this fact [33]. In context of this paper, specifically in open crowd based forums, we expect neutrality, however, the observation presented here clearly negates this notion.
Table 2 City wise responses, USA
NY-New York, Wash-Wshington, SFO-San Francisco, Phil-Philadelphia, LA-Los Angeles
City name NY Wash Austin Chicago Boston SFO Seattle Phil LA
Avg answers from same
city 1.0725 0.95 0.91 0.81 0.79 1.12 1.02 1.74 0.76
Avg ans from rest of the
country USA 0.27 0.05 0.06 0.08 0.06 0.18 0.11 0.02 0.07
Table 3 City wise responses, India
Ban-Bangalore, Gur-Gurgaon, Ahm-Ahmadabad, Hyd-Hyderabad, Kol-Kolkata
City name Delhi Mumbai Ban Pune Noida Gur Chennai Ahm Hyd
Avg answers from same city 0.47 0.53 0.63 0.55 0.37 0.44 0.54 0.79 0.41
Avg ans from rest of the
coun-try, India 0.07 0.06 0.17 0.07 0.017 0.012 0.09 0.037 0.07
Table 4 Number of test subjects USA, city vs. rest of the country
City NY Wash Austin Chic Bost SFO
Same city 8882 2223 3116 4493 3599 7947
Why did you stop playing?
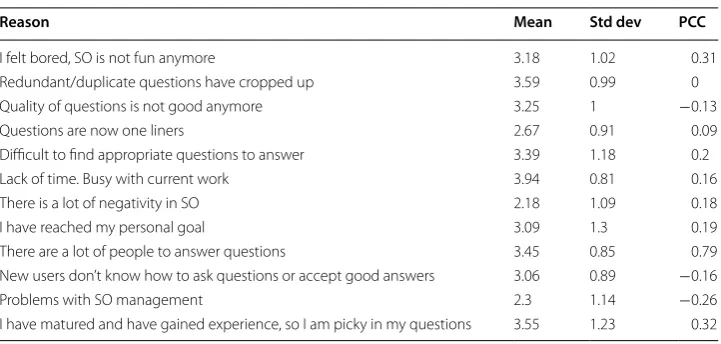
Participation at SO is projected as a game in literature [1, 5]. In this regard, the next observation is concerned with the decreasing activity of good reputation users in the game. In other words, good reputation users showed high activity at SO initially, but they have taken a step back now. Consequently, we wanted to find out why did you stop playing? In our attempt to find the answer to this question, we came across a ‘subjective’ discussion on Meta2 (A discussion forum for problems related to SO). However, there is an issue. It has been specified in [23] that the views on Meta are opinionated. Further-more, sometimes a few posts on Meta show classic symptoms of Emergent Norm The-ory [34]. To explain this problem, we quote from [29], ‘..crowds act in terms of group norms but these group norms are a function of the individual leaders.’ Moreover, there is no definite answer yet. As a result, we wanted to find an objective answer to this ques-tion. We therefore conducted a survey of SO users having good reputaques-tion. In our attempt, a total of 113 emails were sent to ask for the reasons and form different hypoth-esis. We received a total of 56 emails (some with comments and suggestions), and 34 people participated in our survey. Owing to lack of a medium to contact good reputation users, we could not include more. Moreover, one of the SO community managers advised us to discuss this matter on Meta. However, owing to reasons presented in this paragraph and for issues discussed during our conversation with SO users, for instance ‘anonymity’, ‘negativity against the user’, trolling etc., we chose to investigate the matter ourselves. In our survey, there were multiple high ranking users, current SO moderators, and ex-SO moderators. The question attracted significant discussion, with some users sending us long and detailed comments. During our discussion, we realized that there are several reasons why people are decreasing their activity. Therefore, we grouped the identified explanations into different categories and designed a questionnaire. The ques-tions, designed in an interactive manner, are shown Table 5 (The complete questionnaire in the form of Google Docs can be accessed at the link3). The users were requested to state how strongly they agree or disagree to the possible reason on a scale of 1–5.
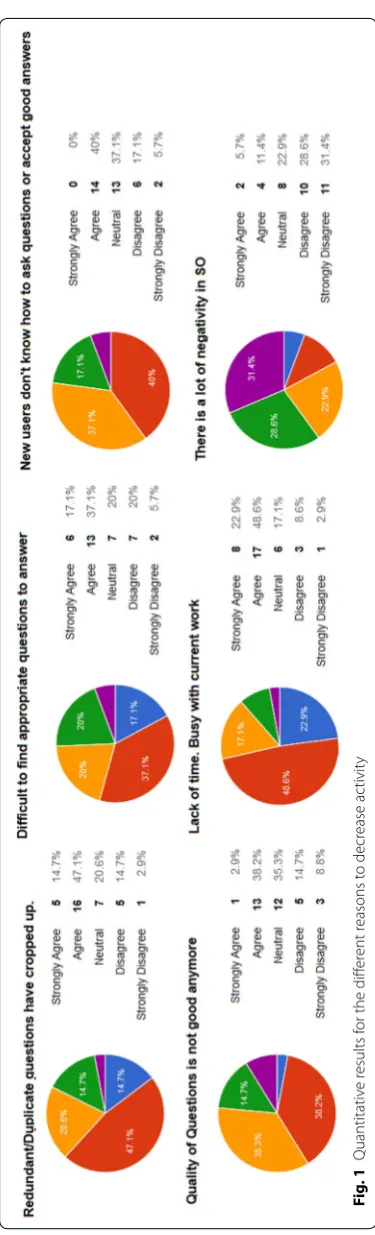
The quantitative result for the reasons is shown in Fig. 1. The complete results are also are presented in Table 5. In the same table, the mean and the standard deviation of the reasons is presented. As users’ response can vary, therefore, Correlation Coeffi-cient (PCC) b/w top 33% and last 33% is also shown. It is visible from the Table that the value for PCC is varying across the identified reasons. But, there is one point of inter-est that has high mean, low std dev, and a positive PCC value: lack of time. It is the top reason to decrease the activity. To emphasize this point, several users pointed out that they have moved in their lives, and no longer have the time to dedicate to SO. Some have moved to better positions in their work (for instance senior management), others have found jobs, some feel they need to dedicate their time someplace else, and so on. Addiction to SO was a phase in life, and they said the phase is now over. Close to lack of time, is the reason, maturity of the users. In this respect, gaining experience with time is an evolutionary human process, therefore, it is natural that users have become picky in their choice of questions. This problem has a strong relationship with yet another reason for decreasing participation, the issue of finding appropriate questions to answer. This
particular category blurs the boundary between the human factors and the search algo-rithms developed by the system. If a search algorithm is able to match the right question for a user, then the issue of maturity and locating appropriate questions to answer will be solved. However, developing a good search algorithm for questions with code and expla-nation in Natural language, personalized for every user, is non-trivial.
As the survey progressed, we also found that another important reason that caused users to decrease their activity was—There are a lot of people to answer questions. This reason, however, was surprising. During our conversation with SO users, they pointed out, in contrast to the initial days, there are a lot of users now and there is no need for them to provide an answer. One user pointed out that he/she does not want to be just another face in the crowd. In the words of the user, ‘Because there are so many others to answer, there’s a level of bystander effect (why spend the effort when someone else will do it?)’. Another one pointed out that owing to such huge numbers, one has to be the Fastest Gun in the West. In other words, if one is aiming to get a good score, or is trying to get his/her answer accepted, then one has to be the first to answer, no matter whether the quality of answer is good or not. Though, it is understandable that the users do not like this transition at SO, moreover, it also affects the quality of an answer, but, it is expected in human oriented environments that the sheer size and variety of users will not only create diversity, but will also generate competition (sometimes unhealthy). Nevertheless, it is one of the properties of crowd dynamics. Following the footsteps of this issue, we also asked whether New users know how to ask questions or how to accept answers. In this case, the response of users varied. The evidence from Table 5 and Fig. 1 suggests that not all users agree to this reason. 13 out of 34 chose to remain neutral, and 14 agree to this proposition. Moreover, the PCC value for this reason is also negative.
Going by quantity presented in Fig. 1, duplicate questions is also among the top con-tenders, but the correlation is not strong. Nevertheless, emphasizing on the point of duplicacy, it is an accepted fact at SO that there are questions that are asked several times. Quantitatively speaking, this property can compel some people to decrease their activity as there is nothing new to learn and no new problems to solve. Hence, one can Table 5 Reason to decrease participation
1-strongly disagree, 2-disagree, 3-neutral, 4-agree, 5-strongly agree
Reason Mean Std dev PCC
I felt bored, SO is not fun anymore 3.18 1.02 0.31
Redundant/duplicate questions have cropped up 3.59 0.99 0
Quality of questions is not good anymore 3.25 1 −0.13
Questions are now one liners 2.67 0.91 0.09
Difficult to find appropriate questions to answer 3.39 1.18 0.2
Lack of time. Busy with current work 3.94 0.81 0.16
There is a lot of negativity in SO 2.18 1.09 0.18
I have reached my personal goal 3.09 1.3 0.19
There are a lot of people to answer questions 3.45 0.85 0.79
New users don’t know how to ask questions or accept good answers 3.06 0.89 −0.16
Problems with SO management 2.3 1.14 −0.26
Fig
. 1
Quantitativ
e r
esults f
or the diff
er
ent r
easons t
o decr
ease ac
tivit
get ‘bored’. In a different context, it has other consequences as well. This consequence will be discussed later in “Plagiarism and taking credit” section.
All the factor discussed in this section are some of the reasons for users to decrease their activity. However, an important point of note discovered during the survey is the factor con-cerning Quality and duplicacy of questions. There are several posts on Meta that states SO has an increasing number of low quality questions.4 Further, users also argue about the increase in duplicate questions. There is also a discussion among SO users that quality is one of the reasons why people do not like participating. To quote from one the those discussions, ‘Yes, because the quality of “new”? questions is going in the toilet. Almost everything I see **** or is a duplicate’. However, our survey neither found the quality of questions nor duplicate questions as a possible reason to reduce participation. Though, for some users it can be a rea-son to stop playing, but the users we contacted did not agreed to this rearea-son.
Quid pro quo
One of the wisest traits of human beings is to help other people. However, the question— ‘In the real world, when in a difficulty, can we expect help from the person we helped in the first place’, often raises a few doubts. Consequently, taking inspiration from this idea, we wanted to test, can we expect an answer from a person whom we have helped previ-ously. Therefore, the test was conducted in two different ways. First, we wanted to test the idea of quid-pro-quo i.e. I helped you, will you help me? Second, how many users returned to answer in the post of the person they answered to before. To find evidence, we took 1M users and checked to see if we can find any pattern of interest. In this regard, the test concerning Quid-pro-quo did not return any statistically significant result. Out the 1,039,986 users in our dataset, only 134,257 came to settle the status quo for quid pro quo, with an average of 1.0831 answers. Therefore, helping somebody and expecting help in return is certainly not the case in SO. Note, it could also imply that people help others without expecting anything in return. Although, there can be several other rea-sons for this behavior, the numbers we present clearly negates the idea of Quid-pro-quo. Similarly, for the second test, the statistics did not favored our expectation either. For this case, owing to the volume of data, we took 100,000 users. Out of 100,000 only 6456 returned to answer in the post of a person, they answered to previously. Though, the responder returned to answer an average of 3 questions, but the statistics are not signifi-cant enough to make a difference.
Does gender make a difference?
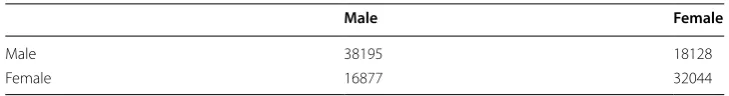
The next inspection was motivated to find the role of gender. In this test, we took ques-tions asked by one gender and cross-referenced the answers posted to by another. To this end, we needed to classify SO users as males and females. Therefore, we took Carn-egie Mellon University’s name corpus5 and classified users based on their ‘display name’. To maintain a balance between males and females, we considered the similar of subjects during analysis. Our dataset had 80,233 males, and 82,351 females. With this experi-mental setting, the result for the status of the test is shown in Table 6. From the table we see that the number of answers provided by people to the same gender is high. This
observation is true both for females and males. Similar to the spatial characteristics of humans, we expected a gender free environment at SO, but the test results show other-wise. After getting these figures we repeated the test 10 more times. We experimented with different number of subjects in each category (we manually and carefully kept the balance between the numbers). However, the result was the same. Users always pre-ferred to answer more to a person of the same gender.
Plagiarism and taking credit
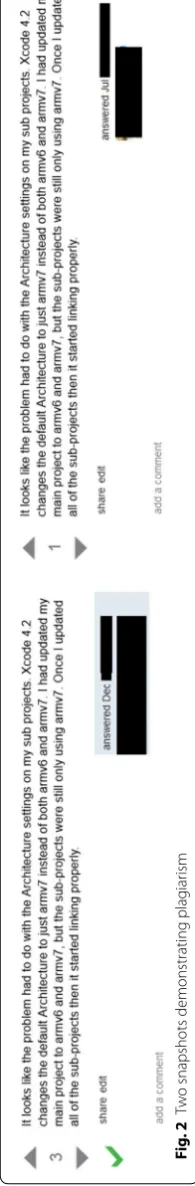
In industrial and academic research, one of worst practices is plagiarism. It is considered unethical. In this regard, we wanted to find out the existence of this malpractice at SO. In other words, the motive is to check whether users copy the answers of other users word-by-word to gain reputation points. To test this hypothesis, we conducted a few experiments. In our experimental settings, we took short answers (having length greater than 45) and sufficiently long answers (with length greater than 2000). We chose these numbers because (1) there is no proper precedent in literature to classify plagiarism. (2) These figures are an indicative of the textual content (and indirectly efforts) in a post. With this setup, we tried to find the existence of plagiarism in SO. During analysis, and to our surprise, indeed we found plagiarized answers. The number of such plagiarized answers with length more than 45 is 1590 and answers having length greater than 2000 is 634. An important point of note here is that even though the answers are online, and sooner or later one is bound to get caught, however, a few SO users ignore this fact and plagiarize answers anyway. To exemplify this, in Fig. 2 we have presented two snapshots of the same answer in different posts. For privacy reasons, most of the data is blacked out. The existence of this behavior confirms the presence of plagiarism.
In this subsection, we highlighted the presence of plagiarism at SO, but the motive of this paper is not to provide a solution to this problem. Our objective is to bring this (and others) problems into the community so that additional investigation and construc-tive work can be built upon. Having said that, we will emphasize on plagiarism. Such instances happen because of three simple reasons. First, there are open ‘duplicate ques-tions’. Second, one asking the question did not look hard enough to find the answer. Third, one answering the question wants to gain reputation points quickly without any effort.
Visit my website to find answers!!
In the next round of analysis we test to find out whether people use SO as a marketing platform for their own gain. In other words, we check whether users advertise or publi-cize their own websites, blogs etc. at SO. For instance, a person locates a question, find a solution and post the link of the answer at SO directing the users to his/her website. The motive is simple—To generate traffic at one’s website. In our view, this type of behavior Table 6 Gender based participation
Male Female
Male 38195 18128
Fig
. 2
T
w
o snapshots demonstrating plag
iar
blurs the boundary between ethical and unethical practice. Therefore, we wanted to get into the details of this issue. In this regard, we extracted several statistics that could bring this issue to light. In our analysis, and to filter the noise, we considered users who have provided more than 10 answers. Further, we considered those users whose answers (atleast 50%) contain a link to their website. Lastly, we also filtered the data based on time to answer (TTA) >3 days (i.e. answer coming after three days of posting a question online). There is evidence in literature [26], as well as in the next sub section, that most regular and honest users try to answer questions quickly (median time is 16 min [26]). Therefore, the number (3 days) was chosen to be sure that a user is taking time to find the question, and is posting an answer on his/her website for the mere purpose of pro-motion. With this setting, the result is shown in Fig. 3. For privacy and reasons of reverse engineering the identity, the number of posts and UserIds are kept hidden. Furthermore, several parts of the data is blacked out. As visible from the figure, there are several users following this type of a practice in SO. For our experiment, we observed a total of 170 users indulging in this behavior. The highest ratio (Answers with URLs to their website/ total answers) is 97%, with the same instance (or user) having posts more than 40 (We don’t present the exact number to keep the identity secret). We believe this type of an activity is not professional. SO is the platform where a user has asked a question, and it is the responsibility of the answerer to provide an answer at this venue. Taking the ben-efit of SO to generate activity at one’s website is not right. However, a few users ignore this fundamental rule and indulge themselves into such practices. For an ideal environ-ment, we expect honesty. However, for real world Q&A forums this is not the case. This finding also questions the behavior of technical users online.
Addiction or something else?—Long answers within 1 min!!
Before beginning the discussion in this subsection, we first show the number of ques-tions answered based on the parameter: time to answer. The result is shown in Table 7. It is visible from the table that a good number of questions are answered within 10 min-utes. An important point of note here is a lot of questions are also answered within 59 s (25,543). Though, some answers contain very little text, for instance PostIDs 80299 or 117256. However, for other questions, the observation raises a few doubts. In simple words, long answers coming in that quickly imply instances that are worth investigating.
To go into the details, we designed a few tests. In the experiment, we considered answers with body length more than 500, 1000, 1500, 2000 chars resp (long answers). The motive was: If long answers are coming within a matter of seconds, then the answers are written in advance or people are trying to collude with others. The motive here is to gain reputa-tion points. Therefore, we categorized the test in two different ways. First, we took the same person asking and answering a question. Second, we look at instances where two different users ask and answer questions. The results for the two scenarios are shown in Table 8. In the following text, for reasons of brevity, we concentrate only on 0–59 s. It is visible from the Table that there are substantial posts satisfying this criterion (answers coming within 59 s). To be specific, the number is 10,948. In this regard, lets consider the another worst case where length(ans) >2000, i.e. we have a sufficiently long answer. For this case, we present the average score of the question as well as the answer. Recall that score is responsible for increasing reputation. In cases when one who has asked a question provides an answer, the avg score (of question and answer) is 31 and 19 respec-tively. In other words, when one follows this behavior then one obtains 50 × 5 reputation points (31 + 19 for the score of the post (question and answer both), reputation = repu-tation + score × 5). In the other case, i.e. when two different users are participating, then the average score of questions and answers is 44 and 40 respectively, implying an incre-ment of 220 points for the asker and 200 points for the answerer. Such high figures indi-cate motivation to gain reputation by using unfair means. As discussed in the beginning of this section, getting good score results in good reputation points. Further, it is also known that users of SO seek reputation. The evidence presented here indicates unfair practice to gain fake Internet points.
The evidence in the previous paragraph indicates cases of collusion and use of unfair means to gain reputation points. However, consider the case of the same user. It is possi-ble that a few users want to share their knowledge with others, whereas others are doing this for the mere purpose of gaining reputation points. Unfortunately, to clear this doubt, we would require a manual survey of such users. In this regard, the evidence show clas-sic symptoms of collusion, the chances that any of these users will agree to the point that they wanted to gain reputation by unfair means is unlikely. Moreover, if we think about this observation, we could also ask: Does this behavior of people (specifically, when two different users ask and answer question immediately) effect the overall “perception” and “fairness” at SO? This question remains unanswered in this paper.
Table 7 Time to answer and number of answer in different interval of time
Time (min) <10 <5 <3 <1
Count 4725023 2095988 677536 25543
Table 8 Number of answers between 0–59 s
Length By same user By different user
>500 1353 8021
>1000 782 2055
>1500 527 620
Discussion and threats to validity
Although, the work presented in this paper merely scratches the surface on open call based software engineering fora, the study, nonetheless, presents a different version of humans participating in these online platforms. SO is an excellent example of people coming together to solve a technical problem. In theory, we can assume that the ideas expressd on the platform are neutral and free of bias. The discussion in this paper, how-ever, brings forth the fact that the reality is far from this utopian assumption. There is much bias and one needs to be pragmatic and realistic in one’s expectations from such online fora. This is an important conclusion arrived at in this paper. Further, there are quite a few avenues for future endeavors that this work opens up and these are discussed as follows:
1. The paper opens up several new directions for researchers working in interdiscipli-nary sciences. For example, researchers in sociology, psychology can take the inves-tigations initiated further and into the domain of specialized professionals, prefer-ably technical users, and explore their behavior online. One has to appreciate that the behavior in an online environment can quite possibly be different from that in an office environment. Through this work, we offer some guidelines and a few starting points to put this idea under scrutiny.
2. Research efforts in crowdsourcing can benefit from this work in their endeavours towards targeting the appropriate set of people while assigning crowdsourcing tasks. Programmers usually comprise the niche group that contributes to crowdsourcing tasks. The assumption is that programmers are thorough professional and are neutral and unbiased in their approach. In this paper, and as is also corroborated by existed literature, we find that software programmers are quite ‘human’ in their approach [35]. We extend the idea in [35] and highlight a few issues that so far eludes litera-ture. Building upon the observations discussed in the paper, future work can explore the humanistic point of view of software programmers.
Having said that, we must also emphasize on a few shortcomings with the study con-ducted in this paper. They are as follows:
1. The first threat is in spatial characteristics. We found statistical evidence that indi-cated people preferred answering to a fellow from the same locality more. Moreo-ver, we found precedent in literature [33] and tested this observation by taking in different criterion and test subjects. To unearth this fact, we needed to extract the location of users from SO’s databases. In this regard, it should be noted here that it is not mandatory that a user at SO must make his/her location public. That is, users can choose not to display their location. As a result, the analysis did not included the
entire user base of SO. Though, the number of test subjects (Table 9) is acceptable,
however, we could not include the entire user base of SO. This therefore is the first shortcoming with the study conducted in the paper.
2. The second threat is the survey of users conducted in the paper. We conducted the survey with 34 subjects. Owing to the reason pointed out section in 3.2, we could not include more users. Therefore, the reasons to decrease participation could suffer from the decline effect. Nevertheless, the survey conducted in the paper can indeed present several guidelines and can serve as a reference point for future work.
3. The third threat is in gender based participation. Similar to point 1, we must point out that we could not include all users in the dataset. This is because some users have display name like NPE (userid 367273). It is therefore difficult to classify such users as either males or females. Moreover, classifying users as males or females on the basis of their names is by definition biased (for example Simon can be used for both males and females). As pointed out in “Does gender make a difference?” section , we conducted the test 10 times by taking in different number of test subjects from the dataset. But, it is not claimed here that the observation is true for the entire user base of SO. Moreover, we do not claim that there is Sexism at SO. To confirm the existence of such a pattern, we need to include the entire users of SO. This, however, is easier said than done. This is because we need to classify all users into males and females accurately.
Despite the shortcomings highlighted in the previous three points, this paper attempted to present the first linking step between the studies in software engineering and the humanistic point of view of technical users at SO. The study tried to explore a new side of SO. Moreover, this paper offers a few potential research questions that needs to be answered in open call based crowd forums. Though, the analysis conducted in the paper was limited to SO, the existence of such patterns and the observations presented in this paper can teach us to have realistic expectations from other open call based Q&A forums as well.
Table 9 Number of subjects in different countries
US UK India Germany France China Brazil Netherland Russia Sweden Italy Canada
Conclusion
In this paper, we discussed a few observations regarding SO, an online Q&A discussion forum. We analyzed the details of this platform with a special emphasis on the human factors. We mined SO repositories to look for the patterns and presented the results. Further, we conducted a survey of SO users to report on a few reasons to decrease one’s activity. We also highlighted a few unethical practices happening at this platform. The results presented in this paper, though targeted towards SO, can be generalized for any other platform as well. To present the contribution of the article, the following points summarize the findings of the paper.
1. The paper reported on cases where users prefer answering to a person from the same locality more.
2. Through a survey, possible reasons to decrease one’s activity were discussed. 3. The idea of helping one and expecting help in return was nullified.
4. It was found that gender plays an important role at SO. 5. The findings further reported on the practice of plagiarism.
6. Through this study, instances where users employ SO as a launchpad for their per-sonal websites were discovered.
7. Possible cases of collusion (to gain reputation points) were presented.
Authors’ contributions
TA carried out the study in the paper, and drafted the first version of the manuscript. TA and AS designed the framework and developed the proposed method together. AS revised the first and second version of the manuscript. All authors read and approved the final manuscript.
Competing interests
The authors declare that they have no competing interests. Funding information
Funding information is not applicable for this work.
Received: 27 October 2016 Accepted: 11 February 2017
References
1. Immorlica N, Stoddard G, Syrgkanis V (2015) Social status and badge design. In: Proceedings of the 24th interna-tional conference on World Wide Web. Internainterna-tional World Wide Web Conferences Steering Committee. pp 473–483 2. Pal A, Harper FM, Konstan JA (2012) Exploring question selection bias to identify experts and potential experts in
community question answering. ACM Trans Inf Syst (TOIS) 30(2):10
3. Murgia A, Tourani P, Adams B, Ortu M (2014) Do developers feel emotions? An exploratory analysis of emotions in software artifacts. Proceedings of the 11th working conference on mining software repositories, ACM, pp 262–271 4. Xia X, Lo D, Wang X, Zhou B (2013) Tag recommendation in software information sites. In: Proceedings of the 10th
working conference on mining software repositories, IEEE Press, pp 287–296
5. Cavusoglu H, Li Z, Huang KW (2015) Can gamification motivate voluntary contributions? The case of StackOverflow Q&A community. In: Proceedings of the 18th ACM conference companion on computer supported cooperative work and social computing, ACM, pp 171–174
6. Correa D, Sureka A (2013) Fit or unfit: analysis and prediction of closed questions on Stack Overflow. In: Proceedings of the first ACM conference on online social networks. ACM, pp 201–212
7. Cherubini M, Venolia G, DeLine R, Ko AJ (2007) Let’s go to the whiteboard: how and why software developers use drawings. In: Proceedings of the SIGCHI conference on human factors in computing systems, pp 557–566 8. Espinosa JA, Slaughter SA, Kraut RE, Herbsleb JD (2007) Familiarity, complexity, and team performance in
geographi-cally distributed software development. Org Sci 18(4):613–630
9. LaToza TD, Venolia G, DeLine R (2006) Maintaining mental models: a study of developer work habits. In: Proceedings of the 28th international conference on software engineering. ACM, pp 492–501
11. Dabbish L, Stuart C, Tsay J, Herbsleb J (2012) Social coding in GitHub: transparency and collaboration in an open software repository. In: Proceedings of the ACM 2012 conference on computer supported cooperative work, ACM, pp 1277–1286
12. Morrison P, Murphy-Hill E (2013) Is programming knowledge related to age? An exploration of Stack Overflow. In: 2013 10th IEEE working conference on mining software repositories (MSR). IEEE, pp 69–72
13. Treude C, Barzilay O, Storey MA (2011) How do programmers ask and answer questions on the web? In: 2011 33rd international conference on Software engineering (ICSE). IEEE, pp 804–807
14. Wang S, Lo D, Jiang L (2013) An empirical study on developer interactions in StackOverflow. In: Proceedings of the 28th annual ACM symposium on applied computing. ACM, pp 1019–1024
15. Nasehi SM, Sillito J, Maurer F, Burns C (2012) What makes a good code example? A study of programming Q&A in StackOverflow. In: 2012 28th IEEE international conference on Software maintenance (ICSM). IEEE, pp 25–34 16. Barua A, Thomas SW, Hassan AE (2014) What are developers talking about? An analysis of topics and trends in Stack
Overflow. Empir Softw Eng 19(3):619–654
17. Linares-Vásquez M, Bavota G, Di Penta M, Oliveto R, Poshyvanyk D (2014) How do API changes trigger Stack Over-flow discussions? A study on the android SDK. In: Proceedings of the 22nd international conference on program comprehension. ACM, pp 83–94
18. Rosen C, Shihab E (2016) What are mobile developers asking about? A large scale study using StackOverflow. Empir Softw Eng 21(3):1192–1223
19. Campos EC, Souza LB, Maia MD (2016) Searching crowd knowledge to recommend solutions for API usage tasks. J Softw Evol Process 28:863–892
20. Anderson A, Huttenlocher D, Kleinberg J, Leskovec J (2012) Discovering value from community activity on focused question answering sites: a case study of Stack Overflow. In: Proceedings of the 18th ACM SIGKDD international conference on knowledge discovery and data mining, ACM, p 850–858
21. Bazelli B, Hindle A, Stroulia E (2013) On the personality traits of StackOverflow users. In: ICSM ’13 proceedings of the 2013 IEEE international conference on software maintenance, IEEE Computer Society, Washington, 22–28 Sept 2013, pp 460–463
22. Asaduzzaman M, Mashiyat AS, Roy CK, Schneider KA (2013) Answering questions about unanswered questions of Stack Overflow. In: Proceedings of the 10th working conference on mining software repositories. IEEE Press, p 97–100 23. Mamykina L, Manoim B, Mittal M, Hripcsak G, Hartmann B (2011) Design lessons from the fastest Q&A site in the
west. In: Proceedings of the SIGCHI conference on human factors in computing systems. ACM, pp 2857–2866 24. Movshovitz-Attias D, Movshovitz-Attias Y, Steenkiste P, Faloutsos C (2013) Analysis of the reputation system and
user contributions on a question answering website: Stackoverflow. In: 2013 IEEE/ACM international conference on advances in social networks analysis and mining (ASONAM). IEEE, pp 886–893
25. Schenk D, Lungu M (2013) Geo-locating the knowledge transfer in StackOverflow. In: Proceedings of the 2013 international workshop on social software engineering. ACM, pp 21–24
26. Bhat V, Gokhale A, Jadhav R, Pudipeddi J, Akoglu L (2014) Min (e) d your tags: analysis of question response time in Stackoverflow. In: 2014 IEEE/ACM international conference on Advances in social networks analysis and mining (ASONAM). IEEE, pp 328–335
27. Koenemann-Belliveau J (1991) Empirical studies of programmers: fourth workshop. Intellect Books
28. Krasner H, Curtis B, Iscoe N (1987) Communication breakdowns and boundary spanning activities on large pro-gramming projects. In: Empirical studies of programmers: second workshop. Ablex Publishing Corp, pp 47–64 29. Reicher S (2001) The psychology of crowd dynamics. In: Michael AH, Tindale RS (eds) Blackwell Handbook of Social
Psychology: group processes, Blackwell, Oxford, pp 182–208
30. Piliavin IM, Rodin J, Piliavin JA (1969) Good samaritanism: an underground phenomenon? J Personal Soc Psychol 13(4):289
31. Emswiller T, Deaux K, Willits JE (1971) Similarity, sex, and requests for small favors. J Appl Soc Psychol 1(3):284–291 32. Dovidio JF, Gaertner SL (1981) The effects of race, status, and ability on helping behavior. Soc Psychol Q 44:192–203 33. Bradner E, Mark G (2002) Why distance matters: effects on cooperation, persuasion and deception. In: Proceedings
of the 2002 ACM conference on computer supported cooperative work. ACM, pp 226–235 34. Turner RH, Killian LM (1957) Collective behavior. Prentice Hall, Englewood Cliffs