WWJMRD 2017; 3(8): 299-307 www.wwjmrd.com
International Journal Peer Reviewed Journal Refereed Journal Indexed Journal UGC Approved Journal Impact Factor MJIF: 4.25 e-ISSN: 2454-6615
Bekir Cirak
Siirt University, Engineering and Architectural Faculty, Mechanical Engineering Department, Kezer Campus, Siirt, Turkey
Correspondence: Bekir Cirak
Siirt University, Engineering and Architectural Faculty, Mechanical Engineering Department, Kezer Campus, Siirt,Turkey
Mathematically Modeling and Optimization by
Artificial Neural Network of Surface Roughness in
CNC Milling – A Case Study
Bekir Cirak
Abstract
In this study, steel AISI 1050 is subjected to process of face milling in CNC milling machine and such parameters as cutting speed, feed rate, flow rate of coolant, depth of cut influencing the surface roughness are investigated. Experimentally, an artificial neural network (ANN) approach for modeling of surface roughness in AISI 1050 steel material. These data have been presented to train a multi layered, single directed, hierarchically connected ANNs using Scaled Conjugate Gradient (SCG) and Levenberg-Marquardt (LM) Back Propagation algorithms with the logistic sigmoid transfer function. The outcomes demonstrated that, the ANN based model have been very successful and the testing data produced of errors.The surface roughness (Ra) is chosen as a measure of surface quality. The data set from major experiment is employed for training a feed forward three layer backpropagation ANN. The developed ANN model is tested on the other combinations of the cutting parameters in the given ranges, which are not included in the training process. The results of calculations are in good agreement with the experimental data confirming the effectiveness of ANN approach in modeling of surface roughness in CNN milling. The ANN model uses a multi-layer feed forward network architecture and was trained with experimental data using backpropagation. The ANN has 4 input neurons, 7 neurons in the hidden layer and 1 output neurons. The ANN model can predict the experimental results quite well with correlation coefficients in the range of 0.95 to 0.98.
Keywords: Artificial neural networks; Modelling; Material processing; Surface roughness; Prediction
Introduction
In recent years, several papers on machining processes have focused on the use of artificial neural networks for modeling surface roughness. Even in such a specific niche of engineering literature, the papers differ considerably in terms of how they define network architectures and validate results, as well as in their training algorithms, error measures, and the like. Furthermore, a perusal of the individual papers leaves a researcher without a clear, sweeping view of what the field’s cutting edge is. Hence, this work reviews a number of these papers, providing a summary and analysis of the findings. Based on recommendations made by scholars of neurocomputing and statistics, the review includes a set of comparison criteria as well as assesses how the research findings were validated. This work also identifies trends in the literature and highlights their main differences. Ultimately, this work points to under explored issues for future research and shows ways to improve how the results are validated.
~ 300 ~ work is therefore in a direction to integrate effect of various parameters which effect the surface roughness. AISI 1050 steel material operation is widely used in modern manufacturing industry because of its high level of accuracy for micro-finishing of shaft, pin material compare to CNC Milling Machine. The surface quality of the machined parts is one of the most important product quality characteristics and one of the most frequent customer requirements. The proposed ANN model is efficiently used for predicting surface roughness in AISI 1050 steel material operation.
Surface roughness has received serious attention of manufacturers for many years. It has been an important design feature and quality measure in many situations, such as parts subjected to fatigue loads, precision fits, fastener holes and esthetic requirements. In addition surface roughness provide adequate tolerances,which imposes one of the most critical constraints for cutting parameter selection in process planning. While the
previous research focused on tolerance study [1-2], this one attempts to develop empirical models with some data mining techniques, such as regression analysis (RA) and computational neural networks (CNN), to help the selection of cutting parameters and the improvement of surface roughness [3-4]. A considerable amount of studies
have investigated the general effects of the speed, feed,and depth of cut, nose radius and others on the surface roughness.
Empirical models have been developed based on metal cutting experiments using Taguchi designs, and it will include the feed, spindle speed, and depth of cut with different coolants as input variables [5]. The past modeling methods on surface roughness prediction can be classified into two categories: geometric modeling [6] and regression analysis [7]. Geometric modeling is based on the motion geometry of a metal cutting process, regardless the cutting dynamics. Analytical models tend to be general and computationally straightforward. The major drawback of this method is, they miss other parameters in cutting dynamics including speed, depth of cut and the work piece material in their models [6].On the other hand regression method is a kind of empirical modeling method, is that these studies did not apply the factorial experimentation approach to design the experiments.
Therefore, the data and conclusions obtained were biased and factorial interactions were not clearly examined
[7].This research work contains the Taguchi
experimentation approach to design several rounds of experiments following the sequential experimentation strategy [10-11] for an in depth discussion of the strategy. Therefore, the impact of each individual factor and factor interactions on surface roughness are clearly examined with a reasonably small amount of time and cost. Secondly, with the improved accuracy of today’s machine tools and surface roughness measuring devices with the help of computers and software, the research work is able to include more parameters simultaneously with more accurate experimental data [12].Jiao et al. concluded that a combined neural fuzzy approach is the most suitable for machining process modeling and control. The fuzzy adaptive network (FAN) was developed for the purpose of surface roughness prediction in milling. The FAN network has both the learning ability and the linguistic representation of the complex phenomenon [13].
Davim et al. investigated the effects of cutting parameters of on the surface finish in steel milling using the design of the experiment and neural network. For the purpose of experimentation, the authors selected the standard L27 (33) orthogonal array, based on the
Taguchi experimental design. The multiple linear regression and three layer back propagation neural network models were developed to study the effect of cutting conditions on surface roughness parameters (Ra and Rt)
[14]. In an extensive work various methodologies for the prediction of the surface profile and roughness were presented, and each approach had its advantages and disadvantages. Three major categories are created for classifying these approaches as a pure modeling based approach, a signal based approach and an artificial intelligence based approach. Additionally, the RBF neural network, trained with the adaptive adjusting parameter, was used for predicting the surface profile[15].
Surface Roughness
There are various surface roughness amplitude parameters such as roughness average (Ra),
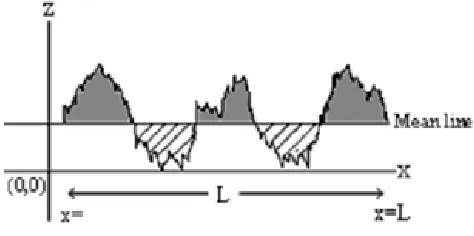
Root mean square (RMS) roughness (Rq), and maximum peak to valley roughness (Ry or Rmax) which are used in industries [6]. Surface roughness average parameter (Ra) is the most extended index of product quality and has been used in this study. The average roughness (Ra) can be defined as the area between the roughness profile and its mean line or the integral of the absolute value of the roughness profile height over the evaluation length. Therefore, the Ra is specified by the equation (1).
Ra =
1
𝐿 ∫ |𝑍(𝑥) 𝑑𝑥 |
𝐿
0 (1)
Where Ra is the arithmetic average deviation from the mean
line, L is the sampling length and Z the coordinate of the profile curve in Figure 1.
Fig. 1: Surface Roughness in Sampling Length
Fig. 2: Measuring of the surface roughness
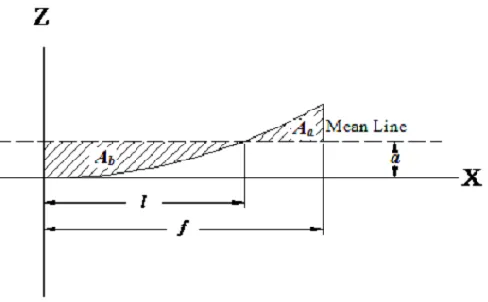
In Figure 3, a representative element of the ideal roughness profile after ball end milling operation has been shown. Using equation, (2) to (8) the theoretical values of Ra can be calculated. The theoretical Ra depends on feed fx and tool nose radius R. Here a is the mean line height. Ab Area
below mean line and Aa is the Area above mean line.
Fig. 3: Mathematically modelling of surface roughness
Ra =
𝐴𝑎 + 𝐴𝑏
𝑓 (2)
Aa = ( f- l ) ( R-a ) - 𝑅
2
4 {(2𝜃𝑓+ 𝑠𝑖𝑛 2𝜃𝑓) − (2𝜃𝑙+ 𝑠𝑖𝑛 2𝜃𝑙)} (3)
Ab = (a-R)l +
𝑅2
4 (2𝜃𝑙+ 𝑠𝑖𝑛 2𝜃𝑙) (4)
a = R-𝑅
2
4𝑓(2𝜃𝑓+ 𝑠𝑖𝑛 2𝜃𝑓) (5)
l = √2 𝑅𝑎 − 𝑎2 (6)
𝜃𝑙 = sin -1 𝑙 𝑅
(7)
𝜃𝑓 = sin -1 𝑓 𝑅
(8)
The representative element with length “ f ” of the curve or surface profile is symmetric with respect to Z axis and surface profile with length f = fx / 2 is repeated over the whole surface for gradual feed of fx in each pass.
Artificial Neural Networks
Artificial neural networks have been studied for many years in the hope of achieving the
human-like performance in the field of the speech, image recognition and the pattern classification. These neural networks are composed of many non linear computational elements operating in parallel. Neural Networks, because of their massive nature, can perform computations at a higher rate. Because of their adaptative nature using the learning process, neural networks can adapt to changes in the data and learn the characteristics of the input signals.
Still according to the author, the ability to learn is a
fundamental trait of the neural network. Although a precise definition of learning is difficult to formulate, the learning in a neural network means the finding an appropriate set of the weights that are connection strengths from the elements to the other layer elements.What makes this work distinguished from others is the use of grinding parameters as input to the neural network which have not been tested yet in surface roughness prediction by neural networks. Besides a high sampling rate data acquisition system was employed to acquire the acoustic emission and cutting power [16].
Problem of Optimization of Cutting Conditions
The cutting parameters must be so selected that the machine is utilized to the maximum possible extent and that the tool life is as long as possible, when there are two conflicting objectives, a compromise must be reached. In general, the selection of easier operating conditions is not economically justified. If the cutting speed, feed rate, flow rate and cutting depth are decreased, the work efficiency is reduced and the tool resistance to wear is prolonged. In this way, the tool life is increased and the cost of the tool replacement reduced, but the labor costs are increased. Inversely, it is not always our aim to produce as much as possible within the shortest possible time.
When selecting the optimum cutting conditions for some machine operation, we make a compromise between maximum material removal rate and the minimum tool wear[17-18]. The purpose of the optimization is to determine such a set of the cutting conditions
V (cutting speed), F (feed rate), D (depth of cut) and C (coolant flow rate) that satisfy the limiting equations and balances the conflicting objectives. The operation of milling is defined as a multiple objective optimization problem with limiting non equations and with three conflicting objectives (production rate, operation cost, and quality of machining). All the above mentioned objectives are represented as a function of the cutting speed, feed rate, flow rate and depth of cutting.
Objectives of optimization production rate
Usually, the production rate is measured in terms of the time necessary for the manufacture of a product (Tp). It is the function of the metal removal rate (MRR) and of the tool life (T):
Tp = Ts+ V
( 1+𝑇𝑐 𝑇 )⁄
𝑀𝑅𝑅 + 𝑇𝑖 (9)
Where Ts, Tc, Ti and V are the tool set up time, the tool change time, the time during which the tool does not cut and the volume of the removed metal respectively. The Ts,Tc,Ti and V are constants so that Tp is the function of MRR and T. The MRR can be expressed by analytical derivation as the product of the cutting speed, feed and depth of cut,
MRR = 1000 v f a (10)
~ 302 ~
T = 𝑘𝑇
𝑣∝1 𝑓∝2 𝑎∝3 (11)
where kT, ∝1, ∝2and ∝3, which are always positive constant
parameters and are determined statistically.
operation cost
The operation cost can be expressed as the cost per product (Cp). In the cost of the operation, two values connected with the cutting parameters (T, Tp) are distinguished:
Cp = Tp (
𝐶1
𝑇 + 𝐶1 + 𝐶0 ) (12)
where, Ct,C1 and Co are the tool cost, the labor cost and the
overhead cost, respectively. In some operations, Ct,Cl and
Co are independent of the cutting parameters.
quality of machining
The most important criterion for the assessment of the surface quality is roughness calculated according to,
Ra = k.V X1. F x2. D x3.C x4 (13)
where, x1, x2, x3, X 4 and k are the constants relevant to a
specific tool-work piece combination. In the presence of many incomparable and conflicting objectives, the ideal solutions satisfying all requirements are very rare. In order to ensure the evaluation of mutual influences and the effects between the objectives and to be able to obtain an overall survey of the manufacturer’s value system.
A multiattribute value function is defined as a real valued function that assigns a real value to each multi attribute alternative, according to the decision maker’s preferential order, such that more preferable alternative is associated with a larger value index than less preferable alternative. One global approach for the determination of the most desirable cutting parameters is by maximization of the manufacturer’s implicit multi-attribute function [19].
Experimental Setup Milling machine
Milling is a form of machining, a material removed process, which is used to create rotational parts by cutting away unwanted material. The milling process requires a milling machine, workpiece, fixture and cutting tool. The workpiece is a piece of preshaped material that is secured to the fixture, which itself is attached to the milling machine, and allowed to rotate at high speeds. The cutter is typically a six point cutting tool that is also secured in the machine. The cutting tool feeds and rotates into the workpiece and cuts away material in the form of small chips to create the desired shape.
This machine typically referred to as milling can be found in a variety of sizes and designs. While most milling are
vertical milling machines, vertical machines are sometimes used, typically for large diameter workpieces. Milling machines can also be classified by the type of control that is offered. Milling machines are also able to be computer controlled, in which case they are referred to as a computer numeric control CNC milling.
Milling cutting tool
All cutting tools that are used in milling can be found in a variety of materials, which will determine the tool’s properties and the workpiece materials for which it is best suited. This properties include the tool’s hardness, toughness and resistance to wear. Experimental Setup includes, CNC Milling Machine (Fanuc TMC500-OM CNC), The geometry of tools of Nose radius, 0.5 mm and Rake angles 180o and Work material AISI 1050, Measuring
equipment Surftest (Mitutoyo SJ-201 PS1 type) surface profilometer, Cut off length 0.8 mm; MBS-9 optical microscope.
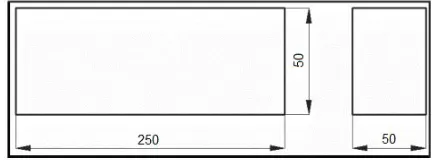
Experiments were carried out with the help of factorial method of design of experiment approach to study the impact of milling parameters on the roughness of turned surfaces. A mathematical model was formulated to predict the effect of machining parameters on surface roughness of a machined work piece. Model was validated with the experimental data and the reported data of other researchers. Further parametric investigations were carried out to predict the effect of various parameters on the surface research The CNC milling machine consists of the machine unit with a three jaw independent chuck, a computer numerically controlled tool slide. The component material was AISI 1050 of 250 mm length, 50 mm width and 50 mm depth as shown in Figure 4.
Fig. 4: Work piece dimensons
In experiment AISI 1050 steel plate was used because this grade of steel offers better forming and bending quality. It was used for applications, where critical bending operations were required. Due to carbon range of 0.7 % and that of manganese of 0.5 %, it can also be quenched and tempered and thus it is very suitable for components where, critical bending has to be achieved and high tensile and toughness can be obtained by means of quenching and tempering. The tool used was cemented carbide insert type. Table 1 shows the component material of AISI 1050
Table 1: Chemical features of AISI 1050 Steel
Figure 5 shows the cutting tool and tool holder. Cutting tool coated tungsten carbide inserts, ISO APKT 1604 tool holder. The cutting tool which provided with the CNC
Fig. 5: Cutting tool and Tool holder of CNC Milling Operation
Surftest (Mitutoyo SJ-201 PS1 type) is a portable, self contained instrument for the measurement of surface texture and is suitable for use in both the workshop and laboratory. Parameters available for surface texture evaluation are Ra.The parameters evaluations and other functions of the instrument are microprocessor based. The measurements results are displaced on an LCD screen and can be output to an optional printer or another computer for further results. Matlab was used for analyzing the results.The selected machining condition is given in Table 2.
Table 2: CNC Milling Conditions
Data analysis
The purpose of developing the mathematical model relating the machining responses and their machining factors was to facilitate the optimization of the machining process. Using the mathematical model, the objective function and process constraints were formulated and the optimization problem was then solved by using regression analysis. Regression Analysis has been made for Surface Roughness (Ra) versus, Coolant Flow Rate (C), Cutting Speed (V), Feed Rate (F), and Depth of Cut (D).The regression equation obtained is
Ra = 390.32 V -0.539.F 0.756.D -0.597.C -0.293 (15)
The R2 value of 0.988 indicated that 98.8% of the
variability in the surface roughness was explained by the model with factors, V, F, D and C. based on the mathematical model, it can be concluded that the Feed Rate is a dominant factor in the roughness model of finish milling of AISI 1050. The developed regression model is reasonably accurate and can be used for prediction within limits.
Surface roughness modeling with ann
So it is found that optimum network is 4-7-1. The performance of this particular trained neural network has been tested with the experimental data and found to be satisfactory. The ANN model was then used to create performance maps (response surfaces). The experimental validation showed that the first ANN predicted optimum operating condition was poorly predicted: the difference between the ANN predicted equivalence ratio and that of the experimental validation data for the optimum point was over 0.1. The second ANN predicted optimum operating condition was accurately predicted within the experimental uncertainty of the measurements.
A surface roughness tester ( Mitutoyo SJ-201) was used to measure the roughness. The measurements were carried out with a Mitutoyo Surftest SJ-201 with cut off length 2.5 mm and number of sampling length 5, stylus type surface texture measuring instrument Surface roughness parameter is selected as response variables in the present study. Roughness measurement is done using a stylus type profilometer. Surface condition of machined work piece was observed using JEOL JSM-6380LA analytical scanning electron microscope. Roughness measurements in the transverse direction on the work pieces are repeated five times and average of five measurements of surface roughness parameter values are recorded (Figure 6 ).
Fig. 6: Mitutoyo Surftest SJ-201
~ 304 ~ arrived at. In the present case, from Table 3 for architecture 4-7-1 network with η = 0.03, and α = 0.7 mean square error for training is 0.0000028412 and for mean square error for testing is 0.0000045623 is minimum. So it is found that optimum network is 4-7-1.
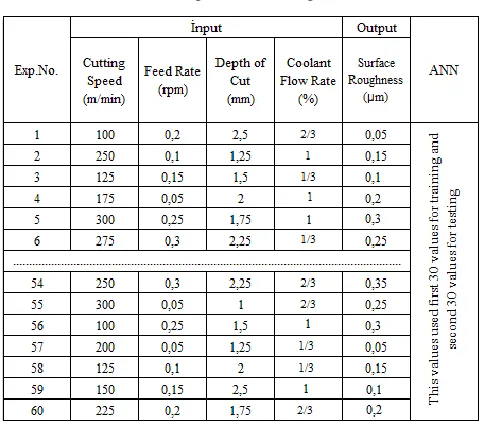
In Table 3 there are total 60 different experimentations performed for different conditions. Back propagation neural network algorithm has been used in the present work. To train the neural network, depth of cut, cutting
speed, feed rate and coolant flow rate (valve opening ) are used as input parameters, and corresponding surface roughness of the machined product as the output parameter. Thus a series of experiments have been conducted to evaluate which CNC milling parameters effect the surface roughness. Four CNC milling parameters such as Cutting speed (m/min), depth of cut (mm), feed rate (mm/rev) and coolant flow rate of valve opening (%) were selected for experimentation.
Table 3: Experimental design matrix
Figure 7 shows performance curve for architecture 4-7-1and considering all afore said, in this specific task, the
optimum architecture 4-7-1 of a three-layer BP ANN was selected.
Fig. 7: Variation of MSE for 4-7-1 network
Artificial neural network models are inspired by animals’ central nervous systems (in particular the brain) that are capable of machine learning and pattern recognition. A neural network is a massively parallel distributed processor that has a natural propensity for storing experimental knowledge and making it available for use. In this study, to construct the neural network models, four cutting parameters; depth of cut, feed rate, cutting speed and coolant flow rate are used as the input neurons and corresponding surface roughness as the output neuron. Figure 8 shows typical architecture of neural
network. To construct the models, the hyperbolic tangent sigmoid function in the hidden layer and linear activation function in the output layer are considered.
Determination of hidden layer(s) and numbers of neurons in the hidden layer(s), learning rate (η) and momentum coefficient (α) are the considerable task. Optimum number of neurons in the hidden layer learning rate (η) and momentum coefficient (α) are decided by trial with increasing the number of neurons. Minimum mean square error (MSE) is the selection criteria. In this study, to train the network, Levenberg Marquardt algorithm is selected for training (Eq. 16). The best network is selected based on the minimum mean square error (MSE).
E = 1
𝑝[ ∑ ∑ (𝑑𝑘
𝑝
− 𝐶𝑘𝑝)2
𝑛 𝑘=1 𝑝
1 ](16)
Eq. 16 is the expression for mean square error (MSE) where, N is the number of pattern, n is he number of node in the output layer, 𝐶𝑘𝑝 is the desired/experimental output for 𝑘 𝑡ℎnode of the 𝑝 𝑡ℎpattern and 𝐶
𝑘 𝑝
is the calculated/predicted output of 𝑘 𝑡ℎnode of 𝑝 𝑡ℎpattern. Nguyen-Widrow weight initialization algorithm has been applied which generates initial weight and bias values for a
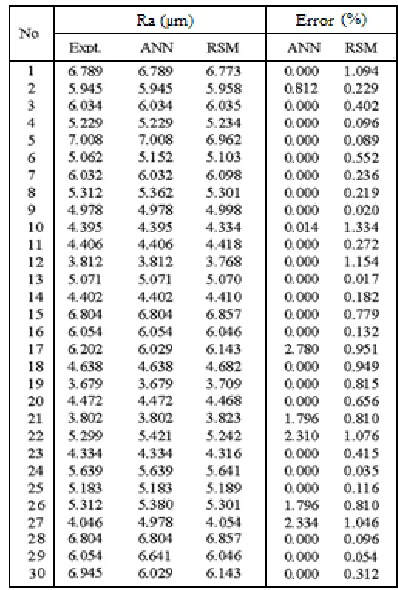
layer so that the active regions of the layer's neurons will be distributed roughly evenly over the input space. The predicted values of surface roughness from the ANN model are compared with the experimental result and also with the surface roughness predicted by response surface model. The comparision of prediction performance of both the models with the experimental result is given in Table 4. The response surface model developed by Arokiadass [8]. Using second order polynomial equation found that the modelis statistically significant with 95% confidence level. Thus reported that the input parameter feed rate has more influence on the response followed by spindle speed, SiCp percentage and depth of cut. The maximum absolute percentage error in ANN model production is 2.33% while for the RSM it is 1.04%, when compared with the experimental result. However the average percentage error in ANN prediction is 0.37% and is less than that involved in RSM prediction which is 0.49%
Table 4: Comparated of ANN and RSM in Experimental Result
The graphical representation of the predicted values of Ra from both the ANN model and RSM is shown in the Fig.9.
The prediction of both ANN model and RSM show high correlation with the experimental result.
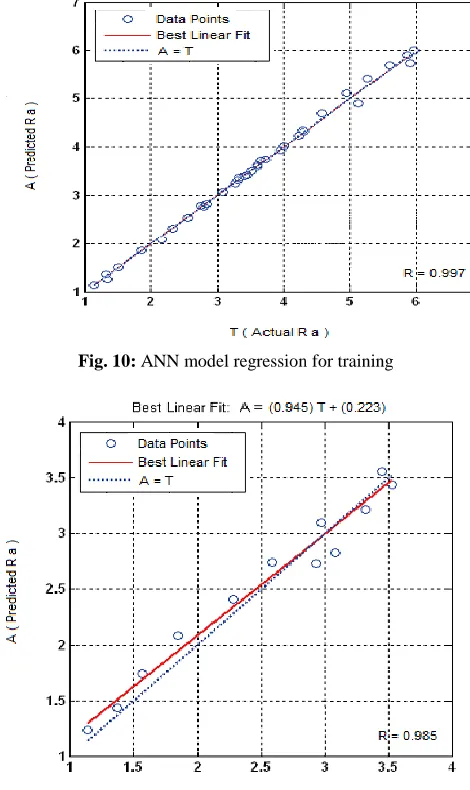
~ 306 ~ Regression analysis was conducted for training, validation and testing pattern and it was observed from the regression analysis that correlation coefficient (R) for training (Figure 10) was 0.99787; For testing (Figure 11), correlation coefficient(R) was 0.98551 and overall R value is 0.99386 which implies moderate correlation between experimental and predicted surface responses.
Fig. 10: ANN model regression for training
Fig. 11: ANN model regression for testing
Comparative study of experimental and ANN predicted surface roughness for randomly selected seven testing have been shown in Figure 12 bar chart. In the bar chart along the X axis is Experiment No which is selected for testing and along the Y axis is Surface roughness (Ra) in µm. Bar chart shows that experimental Ra value and predicted Ra value are very close to each other. So we can say that network architecture 4-7-1 will give very satisfactory result.
Correlation coefficient 1 means the perfect correlation between the experimental and the predicted results. Comparative study of the experimental Ra and ANN predicted Ra is presented in Fig. 12 (a) and it is seen that ANN predicted and experimental Ra are close to each other. Also the network is tested with a separate testing dataset and the comparison of experimental results and predicted results is presented in Fig. 12 (b). The correlation
coefficient (R) is 0.998381 and it is a good correlation between the predicted and experimental outputs. From the results, it is obvious that the network gives a good prediction of Ra in CNC Milling and the network has the generalization capability.
Fig. 12: Comparision of predicted Ra value and actual Ra value for training set
Fig. 13: Comparision of predicted Ra value and actual Ra value for testing set
Acknowledgement
This research work has been conducted in the department of Mechanical Technology in Manisa Technical and Industrial Professional High School. The author gratefully acknowledges the kind support and cooperation provided by the Manisa Technical and Industrial Professional High School and its CNC machine /work shop.This School located in Manisa city in TURKEY.
Conclusions
roughness, followed by the feed rate, cutting speed, coolant flow rate and depth of cut whose influences on surface roughness are at the operation. Very good performances of the proposed ANN model are achieved although the training process is performed on a limited number of input and output data.
In this paper, neural network model for predicting surface roughness Ra in CNC Milling is developed using multi layer feed forward back propagation algorithm. From the experimental results it is seen that the architecture 4-7-1 trained with LM algorithm gives the best performance for predicting Ra in CNC Milling. The developed neural network model can predict surface roughness with about 97% accuracy. The network also has a good generalization capability. Finally, it can be concluded that the developed ANN model is suitable for predicting Ra with high accuracy.
References
1. Tolouei-Rad, M., Bidhendi, I.M., 2001, On the
optimization of machining parameters for milling operation, Journal of Material Processing Technology, 108, pp.286-293.
2. Lin, W.S., Lee B.Y., Wu, C.L., 2001, Modeling the surface roughness and cutting force for milling, Journal of Material Processing Technology, 108, pp. 286-293.
3. P.N.Rao, Manufacturing Technology Volume 2 Metal
cutting and Machine Tools (Tata McGraw Hill Education Private Limited, 2009)
4. K.B.Ahsan, A.M.Mazid, R.E.Clegg and G.K.H.Pang,
Study on carbide cutting tool life using various cutting speeds for α-β Ti-alloy machining, Journal of
achievements in materials and manufacturing
engineering,55(2),2012, 600-606.
5. Z.Q.Liu, X.Ai, H.Zhang, Z.T.Wang and Y.Wan, Wear
patterns and mechanisms of cutting tools in high speed
face milling, Journal of Material processing
technology, 129,2002, 222-226
6. Y. H. Tsai, J. C. Chen and S. J. Lou, “An In-process Surface Recognition System Based on Neural Networks in End Milling Cutting Operations”, International Journal of Machine Tools Manufacture, vol. 39, (1999), pp.583-605.
7. C. Brecher, G. Quintana, T. Rudolf and J. Ciurana, “Use of NC Kernel Data for Surface Roughness Monitoring in Milling Operations”, International Journal of Advanced Manufacturing Technology, vol. 53, (2011), pp. 953–962.
8. Arokiadas,R.,K. Palanirajda and N. Alagumoorthi,
2011. Predictive Modeling of surface roughness in end milling of Al/Si Cp metal matrix composite. Arch. Applied Science Research., 3: 228-236.
9. Shivanandam M., Introduction to artificial neural network using MATLAB. Tata Mc Graw-Hill, Ed-2. 10. Fredj, N. B. R., Amamou & Rezgui, M. A. (2002),
Surface roughness prediction based upon experimental design and neural network models, IEEE SMC, 2002.
11. Amitabha Ghosh and Asok Kumar Mallik,
Manufacturing Science (East west Press private limited, 2010)
12. Cirak B., Kozan R.,” Prediction of the Coating Thickness of Wire Coating Extrusion Processes Using Artificial Neural Network (ANN) ”, Journal of Modern Applied Science,Vol 3, No 7, pp. 52-66-Jully 2009
13. Jiao, Y. Shuting L., Pei Z.J., Lee E.S., 2004, Fuzzy adaptive networks in machining process modeling: surface roughness prediction for milling operations, International Journal of Manufacturing Research, 44, pp. 1643-1651.
14. Davim, J.P., Gaitonde, V.N., Karnik S.R., 2009, Investigations into the effect of cutting conditions on surface roughness in milling of free machining steel by ANN models, Journal of Material Processing Technology, 205, pp. 16-23.
15. Lu, C., 2008, Study on prediction of surface quality in machining process, Journal of Material Processing Technology, 205, pp. 439-450.
16. P.C.Sharma, A textbook of production engineering (S.Chand and Company Ltd, 2012)
17. Feng, An experimental study of the effect of milling parameters on surface roughness in finish milling, Proceedings of the 2001 Industrial Engineering Research Conference, Institute of Industrial Engineers, Norcross, GA,2001.
18. Philipson RH, Ravindram A.,Application of
mathematical programming to metal cutting. Math program stud 1979; 11:116 – 34.
19. Nain CY, Yang WH, Tarng YS., Optimization of
milling operations with multiple performance