GSJ: Volume 6, Issue 6, June 2018, Online: ISSN 2320-9186
www.globalscientificjournal.com
A
TTENTION
D
ETECTION OF THE
D
RIVER TO ENSURE SAFE DRIVING
Partha Pratim Debnath, Md. Golam Rashed, Dipankar Das
Partha Pratim Debnath
Lecturer, Bangladesh Army University of Engineering and Technology, E-mail: parthapratim.ice10@gmail.com
Md. Golam Rashed, Assistant Professor, University of Rajshahi. E-mail: golamrashed@ ru.ac.bd Dipankar Das, Professor, University of Rajshahi. E-mail:dipankar@ ru.ac.bd
KeyWords
Visual focus of attention, eye center localization, gaze detection, sustained attention.
ABSTRACT
I.
INTRODUCTIONAnalysis and understanding of human behavior, particularly of head and eye gaze behavior, has been a subject of interest for
many years [1] in cognitive psychology, neurophysiology and object [2] detection- especially in the field of detection and controlling
of drivers’ focus of attention [3]. However, a full understanding of the detail insight of human’s visual focus of attention (VFOA) to
incorporate human– machine interfaces (HMI) for building up an intelligent system is still a subject of active research. Visual
atten-tion and its controlling process can be integrated in a system to autonomous driving and collision avoidance. In such a system, a
pro-cessing in real time is necessary. Similar to the visual system in humans this can be achieved by focusing the limited resources of a
system to those parts of an image that are relevant to the task of the target human. From the very beginning there is always an
ex-treme demand of an accurate method to accomplish this task.
Every year there are over one million traffic-related fatalities worldwide due to driver’s inattention. According to the police
report 40,927 road accidents occurred during 2001-2010 in Bangladesh. These accidents killed 32,261 persons. The estimated cost of road accidents is about 7500 crore Bangladeshi taka. But a matter of hope is that, recent advances have promoted the integration of driver behavior analysis into Intelligent Driver Assistance Systems to counteract inattention and poor driving behavior. The analysis of
body language in critical situations, such as the time prior to a lane change, becomes central in giving these systems the ability to
predict the context of the situation.
There are different works already done in this field [4][5][6]. Unfortunately, most of the existing methods of controlling
driv-er’s attention use sensors based head mounted devices to estimate the attention level [7][8].Although the sensor-based approaches
are accurate, however these approaches require technology applicable to controlled environment. Moreover, to track the visual
at-tention, the researchers used solely head tracking [9] or eye tracking [10] [11] [12] techniques. But we have combined the both to
estimate the attention of driver and it requires a very low cost senor (such as a USB camera) situated in front of a driver (celling of
the car).Thus our technique is applicable in real time environment and also offers cost efficiency.
Since the road accident is a major problem in Bangladesh due to the low level of driving attention, thus, by implementing
such a system in a vehicle and alarming the driver when s/he looks at other than the target object, our proposed technique will
con-tribute in reducing the number of road accidents caused by the drivers’ fluctuation of visual focus of attention. In this way, for
po-tentially dangerous situations such as driving and flying, our proposed active perception of human’s focus of attention has a large
role to play in improving comfort, saving lives and reducing the cost due to road accidents.
II. METHODOLOGY
The research methodology is divided into three consecutive parts. Which are described as follows-
2.1 Head and Eye Center Detection
In this work we have used a low quality camera (resolution- 5 mega pixels) to capture continuous image of the driver. The
continuous images are then fed to the system for processing. For easier processing, the images are converted into grayscale.
Histo-gram equalization is performed on each image so that we can continue our operation when there is slight lack of proper lighting. 6
in AVI format at the rate of 7 fps (Frame per Second). These stored video files are analyzed to get the results. The step by step
analy-sis to detect the iris center from the image is described in the following section-
2.1.1 Head Pose Detection by 3-D Head Tracker
A human head has non-planar geometry. Also, it has curved surfaces. A simple model for representing a human head such
as a plane would not track the 3D head motion accurately. 2D planar model is simple but not effective for representing a human
head because it cannot represent curved surfaces well. Therefore, 3D head tracking with a planar model is not robust to out-of-plane
rotations. On the other hand, a complex actual head model would require a very exact initialization and suffer from computational
burden. Therefore, to build a 3D model of a human head approximately, a cylinder or an ellipsoid has been often used [13]. Among
them, we adopt an ellipsoidal model for representing the human head.
Since a cylinder model does not represent vertically curved surfaces, compared with a 3D ellipsoid model, the latter is more
suitable for representing a human head. A 3D ellipsoid itself is parameterized by the lengths of its major axes. We assume that the
width rx is 1. Thus we only need to determine the ratios between the width rx to the height ryand the width to the depth r z. In our
approach, we statistically obtain these ratios from the sample data of human heads to represent curved surfaces of a human head
more generally. Let the origin of an object coordinate frame be placed at the center ofa human head and the frontal face looks at the
positive Zaxis of an object coordinate frame. Let [Xo YoZo]T be the coordinates of a surface point Po in the object reference
Frame.Then, the surface point of a 3D ellipsoid can be easily defined like below-
Xo = rxsinα sinβ
Yo = ry cosα
Zo = rzsinα cosβ
Compared with other ellipsoidal models, we only use the partial regions of a human head with a range of about 60o ≤ α ≤ 135o and -90o≤ β≤ 90o to express a human face more precisely and exclude disturbing regions such as hairs and background outliers.
2.1.2 Face Points Extraction by Active Shape Model
Our modeling method works by examining the statistics of the coordinates of the labeled points in the head rectangle [14].
In order to be able to compare equivalent points from different shapes, they must be aligned with respect to a set of axes. We
achieve the required alignment by scaling, rotating and translating the shape so that they correspond as closely as possible. In this
technique, we aim to minimize a weighted sum of squares of distances between equivalent points on different shapes.
We first consider aligning a pair of shapes in the head rectangle. Let xi be the vector describing the n points of the ith shape
in the set:
Xi = (xi0, yi0, xi1, yi1,...,xik, yik,…,xi (n-1), yi (n-1))T
Let M(s,θ)*x+ be a rotation by θ and scaling by s. Given two similar shaper xi and xj, we can choose θj and and sj and
transla-tion (txj, tyj) mapping xi onto M(sj, θj)[xj] + tj so as to minimize the weighted sum.
Ej = (xi – M(sj, θj)[xj] + tj) T W= (xi– M(sj, θj)[xj] + tj),
Where,
tj =(txj, tyj,……,txj, tyj)T and W is the diagonal matrix for each point.
the least with respect to the other points in the shape. We have used a weight matrix defined as follows- let Rkl be the distance
be-tween the points k and l in the shape and V Rklbe the variance in this distance over the set of shapes. We can choose a weight Wk for
the kth point using-
Wk = (∑ 𝑃)-1 where, P =V Rkl
If a point tends to move around a great deal with respect to the other points in the shape, the sum of the variances will be
large and a low weight will be given. If a point wants to stay fixed with respect to the other, the sum of the variances will be small
and a large weight will be given. We match such points in the shape to extract the face points.
2.1.3 Iris Center Detection by Vector Field of Image Gradient
The VFIG iris center detection technique is described as follows-
Let Ic be the possible iris center and Igibe the gradient vector in position Ixi. If Idi is the normalized displacement vector, then it should
have some absolute orientation as the gradient Igi.We can determine the optical center Ic* of the iris (darkest position of the eye) by
computing the dot products of Idi and Igi and finding the global maximum of the dot product over the eye image:
Ic* = argmax Ic{
∑ (𝑃 )}
Where, P = (Idi T Igi)2
Idi = (Ixi -Ic) / (||Ixi -Ic||2)
i =1, 2,...,N and the displacement vector Idi is scaled to unit length in order to obtain an equal weight for all pixel position in the
im-age.
Figure 1: Face points extraction
2.2 Gaze Detection of the Driver
The visual field of the driver is divided as the following diagram-
Figure 3: Failure to detect Near Peripheral Field of View (NPFV) correctly
If we can track the pupil of the eye efficiently, then from the variation of the coordinate of pupil of the driver we can detect on which
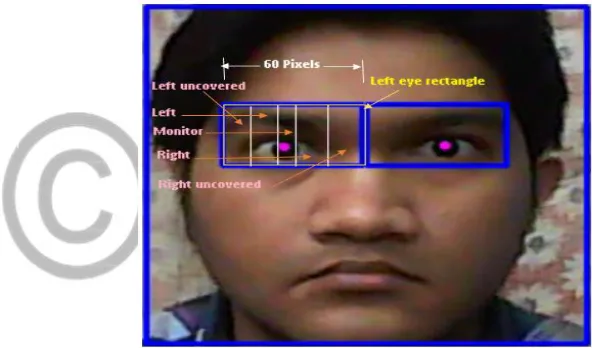
direction he is focusing. From the face points eye rectangle is created around the eye region. For simplicity, we shall consider the
coordinate of only left eye because we know that the pupil of the two eyes move simultaneously. The width of eye rectangle is
divid-ed into three regions: left, monitor and right. If the driver changes his focus from central field of view (CFV) to any of the near
pe-ripheral field of view (NPFV), the corresponding x coordinate of pupil also changes. Within the eye rectangle we shall detect on which
region the x coordinate of eye falls and thus detect the gaze of the driver. To accomplish this, we have used Unequal Partitioning of Eye Rectangle Leaving the Uncovered Regions method [15].
In this technique we leave the uncovered regions and the width of the left, monitor and right regions are not the same. To
detect the slight change of focus from Central Field of View (CFV) to the left or right, the width of the monitor region is decreased
and hence the width of the left as well as the right regions increases so that they can accommodate the slight change of focus in
Near Peripheral Field of View (NPFV) and enhance the total accuracy. The threshold detection for left, monitor and right regions are
discussed below-
Let the width of the left eye rectangle be 60 pixels and it is divided into five equal parts as before.
A rough threshold for the five regions are defined as follows-
Left uncovered1 = {X: X > 300 and X < 312}
Left1 = {X: X >= 312 and X < 324}
Monitor 1= {X: X >= 324 and X <= 336}
Right1= {X: X > 336 and X <= 348}
Right uncovered 1= {X: X > 348 and X < 360}
Now the length of the monitor region is divided into 4 segments. If the length of the Monitor region is 12 pixels, the length
Left uncovered = {X: X > 300 and X < 312}
Left = {X: X >= 312 and X <(324 + d)} ={X: X >= 312 and X <327}
Monitor = {X: X >= (324 + d) and X <= (336– d+1)} ={X: X >= 327 and X <= 334}
Right= {X: X >(336-d+1) and X <= (348+d-1)} ={X: X >= 334 and X <= 350}
Right uncovered = {X: X >(348+d-1) and X < 360} ={X: X >= 350 and X < 360}
Figure 4: Unequal Partitioning of eye rectangle leaving the uncovered regions
If the driver’s gaze is in far peripheral field of view (FPFV) or near this zone, head movement occurs. In this case we cannot
detect the eyes for gaze estimation very accurately. So depending on the head movement, we decide on which object the driver is
looking. To accomplish this, the width of the head rectangle is divided into three regions: Front, Left side and Right side. From the
detected face points, the middle of the face is detected and it is basically the middle of the eye rectangle. Now if we move our head,
this middle line of our face also moves with respect to the head rectangle. We decide whether the driver is looking on left, front or
right based on in which head region the middle line of the face falls. For example let us consider that the width of the head rectangle
is 180 pixels. It is divided into five equal segments. The length of each segment, s = 180 / 5 = 36 pixels. If the x coordinate of the head
rectangle starts from 300, the threshold values for the three head regions are defined as follows-
Left side = {X: X > 300 and X < (300 + 2 * s)}
={X: X > 300 and X <372}
Front = {X: X >=(300 + 2*s) and X <= (300 + 3* s)}
Right side ={X: X > 408 and X < (300 + 5 * s)} ={X: X > 408 and X < 480}
Figure 5: Gaze detection using the head rectangle
2.3 Sustained and Transient Focus of Attention Detection
Selective sustained attention, also known as focused attention, is the level of attention that produces the consistent results on a task over time. However, the time span of sustained attention varies with different type of tasks. On the other hand, transient attention is a short-term response to a stimulus that temporarily attracts/distracts attention.The minimum time for sustained detec-tion is 8 seconds [16], because the maximum time for transient attendetec-tion is 8 seconds. Detecdetec-tion of sustained and transients are very important to ensure a safe driving. For a given time span while driving, if we can detect that the transient attention of the driver are occurring very frequently, we can ensure the inattention of the driver and give an alarm to alert the driver. To ensure a safe driving most of the attention must be sustained. No transients also mean inattention. Because while driving a driver need to look at the back view mirrors at least twice per minute which are also transient attention. For one minute time span during driving, we can ensure a safe driving if it belongs more than two transients. The threshold values of time for transient and sustained focus of attention detec-tion are given as follows-
Transient = {T: T >0 and T < 8} Sustained = {T: T > 8}
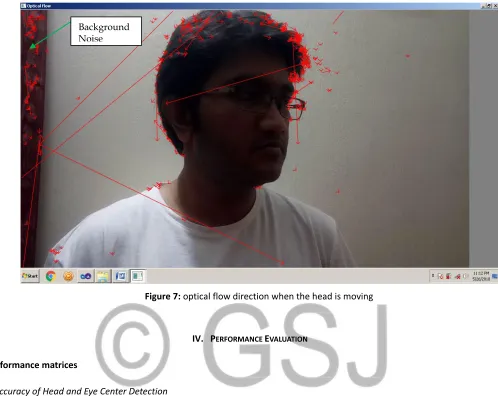
2.4 Body Movement Detection using optical flow feature
The American psychologist James G. Gibson gave the concept of optical flow in 1940[17]. To materialize the visual stimulus
provided to animals, he considered the pattern of apparent motion in a visual scene. The considered motioin is caused by the
rela-tive speed between the observer and the scene. To estimate the optical flow we need the sequences of the ordered images. This
Lucas-Kanade method. For a pixel under consideration, it considers the optical flow constant in it’s neighbourhood. Using the least
square criterion, it solves all the optical flow equation for all of the neighbourhood pixels. To distinguish among different image
el-ements, we have used The Shi and Tomasi corner detection algorithm. The intersection of two edges can be defined as a corner and
used to detect the interesting points that have a well defined position and can be robustly tracked. For feature extraction, we have
used the Kanade–Lucas–Tomasi feature tracker. Basically, feature extraction is done to deduct the amount of resources needed to
narrate the image. With it we can save a lot of computer memory and power.
Figure 8: Block diagram representation of the system
III. DATA COLLECTION
We conducted separate experiments applying different techniques under different lighting conditions and distances from
camera. Data were taken using different participants. This section describes the overall data collection approach step by step.
3.1 Participants
There were total 3 male nonpaying participants with the age 25, 24 and 22 years respectively. For data collection of real
3. 2 Procedure of Gaze Detection Based on Object Detection
For different experiments, the data collection procedure is described as follows-
3. 2.1 Head and Eye Center Detection
In head and eye pupil tracking experiments, the participants were asked to seat at different distances from the camera
un-der different lighting conditions. They sat at 30cm, 40cm, 50cm, 60cm, 70cm, 80cm, 90cm and 100cm away from the camera.
Differ-ent lighting conditions were provided by deploying differDiffer-ent number of (1, 2, 3 and 4) 32 Watt energy bulbs that provides lamination
of different level. The area of our room was 4m2. The average video length was 2 minutes.
3. 2.2 Visual Focus Detection
For gaze detection through applying different techniques, these participants were asked to seat 70 cm away from the
cam-era and to look at different target objects with varying head rotation time (1, 2, 3 seconds). These objects are situated 0.5m apart
from each other. One of the three objects is located in the central field of view (CFV) and the other two in the near peripheral field of
view (NPFV). The average video recording time was 2 minutes. The provided illumination was 200 Lux.
3.2.3 Sustained and Transient Focus of Attention Detection
In sustained and transient attention detection experiments, the participants were asked to look at the left object and the
right object for a very short duration so that they may be considered as transients. The duration of transients was also varied during
different experiments. The average video recording time was 2 minutes.
3.2.3 Procedure of Real Time Data Collection
We videotaped 3 experiments while driving a car. In the first experiment the participant (age 40 years) was asked to drive
the car slowly (35 km/h). In the second experiment the driver (the participant) drove the car comparatively fast(40km/h) through a
busy road. In the final experiment the driver drove at the speed of 55 km/h. The distance between the driver and the camera was
0.7 m. Since the day was sunny, proper illumination was provided. The length of recorded video was 3 minutes 33 seconds, 4 minutes
Figure 9: Video capturing from real time driving
3.2.4 Procedure of body movement detection
The participant was asked to stand by the side of wall and move his body with a low speed. To reduce the image noise, we ensure that there is no background object. The provided illumination was 200 Lux.
Figure 7: optical flow direction when the head is moving
IV. PERFORMANCE EVALUATION
4.1 Performance matrices
4.1.1 Accuracy of Head and Eye Center Detection
We conducted different experiments with different distance from the camera and with different lighting conditions. For
the best lighting condition, the accuracy in head and eye center detection is expressed as follows-
Accuracy varying distance=
×100%...(1)
The performance of head and eye center detection also depends on the lighting condition. For a given distance from
the camera, the accuracy of detection is expressed as follows-
Accuracy varying illumination =
×100%...(2)
4.1.2 Accuracy of Visual Focus Detection
While detecting the gaze from the coordinate of the pupil, the performance is evaluated in terms of “Accuracy” which is
de-fined as follows-
AccuracyFVOA =
× 100%...(3)
4.1.3 Accuracy of Sustained and Transient Focus of Attention Detection Combined With Head Pose
The accuracy for sustained/sustained detection is defined as follows- Background
Accuracy= × 100%...(4)
The accuracy for head pose detection is defined as follows-
Accuracyhead=
× 100%...(5)
4.1.4 Accuracy of Body Movement Detection
To derive the accuracy of body movement, we have taken the average of features taken from 5 consecutive frames. The accuracy is expressed as follows-
AccuracyBody Movement= × 100%...(6)
4.2 Experimental Results
Figure 10 and 11 shows the Accuracy of Head and Eye Center Detection based on equation (1) and (2) as follows-
Figure 10: Accuracy of the head and eye center detec-tion with varying distances from the camera
Figure 11: Accuracy of the head and eye center detec-tion with varying lighting condidetec-tions
Figure 12: Gaze detection accuracy
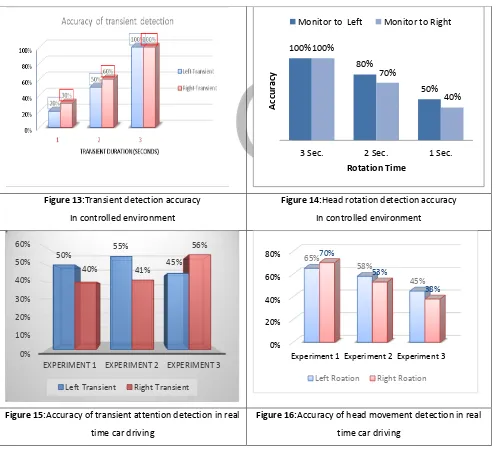
Based on Equation (4) and (5), Accuracy of Sustained and Transient Focus of Attention Detection Combined with Head Pose is
illus-trated in figure 13, 14, 15 and 16 respectively. The accuracy of body movement detection is depicted in figure 17.
Figure 13:Transient detection accuracy In controlled environment
Figure 14:Head rotation detection accuracy In controlled environment
Figure 15:Accuracy of transient attention detection in real time car driving
Figure 16:Accuracy of head movement detection in real time car driving
0.7 0.75 0.8 0.85 0.9
LEFT MONITOR RIGHT 80%
85%
75%
Gaze Detection Accuracy Percentage
100% 80% 50% 100% 70% 40%
3 Sec. 2 Sec. 1 Sec.
Accu
ra
cy
Rotation Time
Monitor to Left Monitor to Right
0% 10% 20% 30% 40% 50% 60%
EXPERIMENT 1 EXPERIMENT 2 EXPERIMENT 3 50% 55%
45% 40% 41%
56%
Left Transient Right Transient
0% 20% 40% 60% 80%
Experiment 1 Experiment 2 Experiment 3
65% 58% 45% 70% 53% 38%
Figure 17: Accuracy of body movement detection
V.CONCLUSION AND FUTURE WORKS
This research basically focuses on gaze detection as well as body movement detection of the driver under different conditions and
applying varying techniques and evaluation of their performance in controlled and real time experiments. There are a lot of scopes
for visual attention detection. Due to short time we cannot do all of these. In the near future some of the other experiments will be
done. Some of them may be:
1. Developing a new technique for gaze detection with more accuracy of detection.
2. Developing a technique that can track the gaze with optimum accuracy with the head rotation time for 1 or 2 seconds.
3. Developing a new technique to track the transients with more accuracy for the transients with the duration of 1 second.
4. Develop a system that can track the head and eye in low illumination.
5. Apply our proposed techniques in real life environments and increase the real time gaze detection performance.
References
*1+ Judd T., Ehinger K., Durand F., and Torralba A., “Learning to Predict Where Humans Look,” in IEEE 12th international conference on Computer Vision, pp. 2106-2113, IEEE, September 2009.
[2] Alexe B., Deselaers T., and Ferrari, “What is an object,” V. 2010. CVPR, pp. 73-80.
*3+ Cal H., Lin Y., and Mourant R., “Evaluation of Drivers’ Visual Behavior and Road Signs in Virtual Environment,” in proceeding of HFES 51st annual meeting, Baltmore, vol. 5, USA, pp. 1645–1649, 2007
[4] Tawari, A., Møgelmose, A., Martin, S., Moeslund, T. B., & Trivedi, M. M. (2014, October). Attention estimation by simultaneous analysis of viewer and view. In Intelligent Transportation Systems (ITSC), 2014 IEEE 17th International Conference on (pp. 1381-1387). IEEE.
[5] Fang, C. Y., Chen, S. W., & Fuh, C. S. (2003). Automatic change detection of driving environments in a vision-based driver assistance system. IEEE Transactions on Neural Networks, 14(3), 646-657.
[6] Lamble, D., Laakso, M., & Summala, H. (1999). Detection thresholds in car following situations and peripheral vision: Implications for positioning of visually demanding in-car displays. Ergonomics, 42(6), 807-815.
*7+ Zhang H., Smith, M. R., and Witt, G. J, “Identification of Real-Time Diagnostic Measures of Visual Distraction with An Automatic Eye-Tracking Sys-tem,” Human Factors: The Journal of the Human Factors and Ergonomics Society, 48(4), pp. 805-821, 2006.
0% 10% 20% 30% 40% 50% 60% 70%
Experiment 1( with background object)
[8] Md. Golam Rashed, Royta Suzuki, Takua Yenezawa, Antony Lam, Yoshinori Kobayashi, and Yoshinori Kuno,” Robustly Tracking People with LI-DARs in a Crowded Museum for Behavioral Analysis” Institute of Electronics, Information and Communication Engineers (IEICE) Transactions on Fundamentals of Electronics,
[9] Murphy-Chutorian, E., & Trivedi, M. M. (2009). Head Pose Estimation in Computer Vision: A Survey, IEEE Transactions on Pattern Analysis and Machine Intelligence, 31(4), pp. 607- 626.
*10+ Kim S., Chung S. T., Jung S., Kim, J., and Cho S. “Multi-Scale Gabor Feature Based Eye Localization,” World Academy of Science, Engineering and Technology 21, pp. 483-487, 2007.
*11+ Kroon B., Hanjalic A., and Maas S. M., “Eye Localization for Face Matching: Is It Always Useful and Under What Conditions?” in Proceedings of the 2008 international conference on Content-based image and video retrieval, pp. 379-388, ACM, July 2008.
[12] Asteriadi, S, Nikolaidis N, HajduA & Pitas I. (2006, March). An Eye Detection Algorithm Using Pixel to Edge Information. In Int. Symp. on Control, Commun. and Sign. Proc.
[13] An K. H. & Chung M. J. (2008, September). 3d Head Tracking and Pose-Robust 2d Texture Map-Based Face Recognition Using A Simple Ellipsoid Model. In 2008. IROS 2008. IEEE/RSJ International Conference on Intelligent Robots and Systems, pp. 307-312. IEEE.
*14+ T. F. Cootes, C. J. Taylor, D. H. Cooper, and J. Graham, “Active shapemodels—their training and application,”Comput. Vis. Image Un-derst., vol. 61, no. 1, pp. 38–59, Jan. 1995. [Online]. Available:http://dx.doi.org/10.1006/cviu.1995.1004
*15+ P. P. Debnath, A. F. M. R. Hasan, and D. Das, “Detection and controllingof drivers’ visual focus of attention,” in2017 International Conferenceon Electrical, Computer and Communication Engineering (ECCE), Feb2017, pp. 301–307.