Keywords: Osteosarcoma, Image processing Noise, Filtering, Denoising parameters.
————————————————————
I . INTRODUCTION
Now a day, Digital image processing involves the application of exclusive computational algorithmic methods to achieve processing over digital images. Image processingis widely used in Real time system, robotics, remote sensing and medical diagnostic. Digital medical image play vital role diagnostic a patients.Medical images are blurred and noisy.Noise in an image may occur due to insufficient lighting and temperature for imaging sensors, image sensor may be affected, Presence of dust particles over the screen of image sensors and interruption in electronic transmission channels.
II.TYPES OF NOISES
Osteosarcoma can de predicted with help of medical images. Magnetic Resonance Imaging (MRI), Ultrasound image, Digital Microscope image, Digital X-ray and Computed Tomography (CT), are mostly used image capturing equipment for diagnosis. These images may be corrupted with noises for example MRI supposed to be corrupted by salt& pepper noise Gaussian noises and Speckle noises, Ultrasound images can be corrupted with speckle noise, Digital Microscope images may be corrupted with salt and pepper noise, Digital X-ray image can have random noises and Computed Tomography (CT) are supposed to corrupted by Poisson noises .
a)Salt And Pepper Noise:
It is also called as impulse noise. It appear as a black and white points on an image. It is caused by due to error in transmitting a data, faulty of pixel element in image sensors, defective memory location. The typical value of white (salt) is 255 and black (pepper) is 0.
The salt and pepper given by Pa for z=a
P(z)= Pa for z=b
0 Otherwise
If a>b ,intensity a will appear as dark dot in a image or intensity will appear light dot in the image.
Figure 1
b)Gaussian Noise:
It is also known as electronic noise because it is arises during image acquisition like sensor noise caused by poor illumination, high temperatures, transmission. Gaussian noise having Probability distribution function is equals to that the normal distribution.
Probability density of the normal distribution function of Gaussian random variable given by
fG( )
√ [ ( )
]
where x represent the grey level,µ mean or median value of the function and σ represent standard deviation of the noise .
___________________
Manuscript
Corresponding Authors
Karthicsonia.B,Researchscholar,Dept of Computer
Applications,AlagappaUniversity,Karaikudi,India.
Dr.Vanitha.M, Asstprofessor,Dept of Computer
Applications,AlagappaUniversity,Karaikudi,India.
891
Figure 2
c) Poisson Noise:
Poisson noise is also known as quantum (photon) noise or shot noise. It is an electronic noise. It occurs when the programmeddigit of particles that carry energy, such as photons in an optical device or electrons in an electronic circuit, is a sufficient amount to provide increase to observable statistical fluctuations in a measurement. Poisson noise follows Poisson distribution is given as in Equation:
( )
Figure 3
d)Speckle Noise:
Speckle noise is multiplicative noise. Multiplicative means unwanted random signal get multiplied into number of relevant signal during image acquisition, image Transmission and other processes. This is a common noise seen in MRI images their appearance is seen in consistent imaging. This noise looks similar in an image as Gaussian noise. Its probability density function (PDF) of Speckle Noise follows gamma distribution is given as in equation:
( )
Figure 4
e) Hybrid Noise (Poisson and Gaussian noise):
It is combination of both Gaussian and Poisson noise. These two noises appear mostly Computed tomography scanimages.
Figure 5
f) Hybrid Noise (GSS NOISE):
It is combination of Gaussian,Salt and pepper noise and Speckle noise. These noises commonly appear in MRI scan images and Using Histopathological Tissue Images.
Gaussian filter is defines Probability distribution of noise, it is used to blur and smoothening image.
c) Median Filter:
Median filter is also known as order statistics filter. It is a type of spatial domain and nonlinear filter. It removes noise by smoothing the images. The median filter replaces the pixel value of image with the middle value.
d)Wiener Filter:
Wiener filter is used to smoothing the speckle noise. The purpose of this filter is to reduce the amount of noise present in an originalimage by comparison with an estimation of the required noiseless image. It is based on a statistical approach.
e) Hybrid filter (WMFilter):
This hybrid filter is combination of Mean and wiener filter. First image is filtered by mean then output of mean filter is given as input to wiener filter then the solution is found.
f)Hybrid filter(MM filter):
This hybrid filter is combination of Mean and median filter. First image is filtered by mean then output of mean filter is given as input to median filter then the solution is found .By this hybrid filter mean filter disadvantage were cleared by median filter and it can be produce better result. The statistical measurements, such asMean square Error (MSE), Root Mean Square Error (RMSE), and Peak Signal-to-Noise Ratio (PSNR) are used to estimate the de-noising performance. Filter having highest PSNR value, consider as a best filter among other filters for denoising performanceThe Mean Square Error is given by following MATLAB CODE: MSE=IMMSE (name of the filter image, original image); The Ratio Mean Square Error (RMSE) is given by following MATLAB CODE:
RMSE=SQRT (MSE);
The Peak Signal-to-Noise Ratio (PSNR) is given by following MATLAB CODE:MAX1=255;
PSNR=10*LOG10(MAXI^2)./MSE;
IV PROPOSED METHODOLOGY
Step1: Input the ImageStep 2: Convert into Grey scale image Step 3: Apply various Noises to image
Step 4:Then Remove the noises using various filters and computational time is calculated
Step 5:Find MSE,RMSE and PSNR(peak signal to noise ratio)
V SIMULATION RESULTS
893
Figure 8
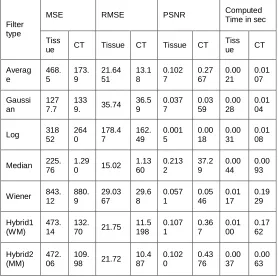
Table I. Image quality parameters by the Average, Gaussian, Log, Median, and Wiener filters, Hybrid1, hybrid
2 with salt and pepper noises applied on the tissue image and CT scan image
Filter type
MSE RMSE PSNR Computed
Time in sec Tiss
ue CT Tissue CT Tissue CT Tiss ue CT Averag
e
468. 5
173. 9
21.64 51
13.1 8
0.102 7
0.27 67
0.00 21
0.01 07 Gaussi
an
127 7.7
133
9. 35.74 36.5 9
0.037 7
0.03 59
0.00 28
0.01 04
Log 318
52 264 0
178.4 7
162. 49
0.001 5
0.00 18
0.00 31
0.01 08 Median 225.
76 1.29
0 15.02 1.13 60
0.213 2
37.2 9
0.00 44
0.00 93 Wiener 843.
12 880. 9
29.03 67
29.6 8
0.057 1
0.05 46
0.01 17
0.19 29 Hybrid1
(WM) 473. 14
132.
70 21.75 11.5 198
0.107 1
0.36 7
0.01 00
0.17 62 Hybrid2
(MM)
472. 06
109.
98 21.72 10.4 87
0.102 0
0.43 76
0.00 37
0.00 63
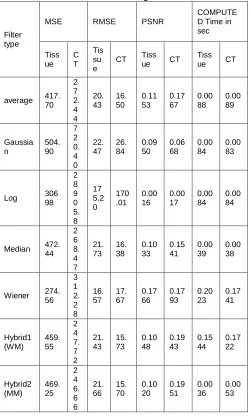
Gaussian noise:
Figure 9
70 4 4
43 50 53 67 88 89
Gaussia n
504. 90
7 2 0. 4 0
22. 47
26. 84
0.09 50
0.06 68
0.00 84
0.00 83
Log 306
98 2 8 9 0 5. 8
17 5.2 0
170 .01
0.00 16
0.00 17
0.00 84
0.00 84
Median 472. 44
2 6 8. 4 7
21. 73
16. 38
0.10 33
0.15 41
0.00 39
0.00 38
Wiener 274. 56
3 1 2. 2 8
16. 57
17. 67
0.17 66
0.17 93
0.20 23
0.17 41
Hybrid1 (WM)
459. 55
2 4 7. 7 2
21. 43
15. 73
0.10 48
0.19 43
0.15 44
0.17 22
Hybrid2 (MM)
469. 25
2 4 6. 6 6
21. 66
15. 70
0.10 20
0.19 51
0.00 36
0.00 53
Speckle Noise:
Figure 11
Figure 12
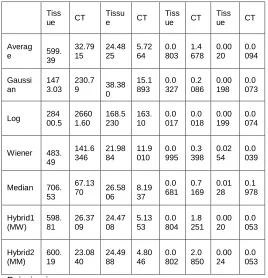
Table III. Image quality parameters by the Average, Gaussian, Log, Median, and Wiener filters, Hybrid1, hybrid
2 with Speckle noises applied on the tissue image and CT scan image
Filter
type MSE RMSE PSNR
895 Tiss
ue CT
Tissu
e CT
Tiss ue CT
Tiss ue CT Averag
e 599.
39
32.79 15
24.48 25
5.72 64
0.0 803
1.4 678
0.00 20
0.0 094 Gaussi
an
147 3.03
230.7 9 38.38
0
15.1 893
0.0 327
0.2 086
0.00 198
0.0 073
Log 284 00.5
2660 1.60
168.5 230
163. 10
0.0 017
0.0 018
0.00 199
0.0 074
Wiener 483. 49
141.6 346
21.98 84
11.9 010
0.0 995
0.3 398
0.02 54
0.0 039
Median 706. 53
67.13 70 26.58
06
8.19 37
0.0 681
0.7 169
0.01 28
0.1 978 Hybrid1
(MW) 598. 81
26.37 09
24.47 08
5.13 53
0.0 804
1.8 251
0.00 20
0.0 053 Hybrid2
(MM)
600. 19
23.08 40
24.49 88
4.80 46
0.0 802
2.0 850
0.00 24
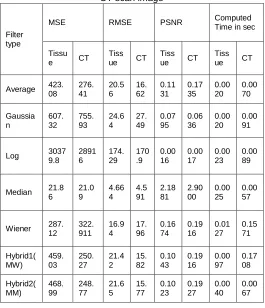
0.0 053 Poission image:
Figure 13
Hybrid PG noises Figure 15 Gaussia n 607. 32 755. 93 24.6 4 27. 49 0.07 95 0.06 36 0.00 20 0.00 91
Log 3037
9.8 2891 6 174. 29 170 .9 0.00 16 0.00 17 0.00 23 0.00 89
Median 21.8 6 21.0 9 4.66 4 4.5 91 2.18 81 2.90 00 0.00 25 0.00 57
Wiener 287. 12 322. 911 16.9 4 17. 96 0.16 74 0.19 16 0.01 27 0.15 71 Hybrid1( MW) 459. 03 250. 27 21.4 2 15. 82 0.10 43 0.19 16 0.00 97 0.17 08 Hybrid2( MM) 468. 99 248. 77 21.6 5 15. 77 0.10 23 0.19 27 0.00 40 0.00 67 Hybrid GSS noises
Figure 16 Gaussia n 178. 258 8 41 .9 40 5 13.3 514 6.47 62 0.27 00 1.1 476 0.002 2 0.0 077 Log 288 59.9 0 27 13 9. 98 169. 88 164. 74 0.00 17 0.0 018 0.002 2 0.0 085 Median 249. 354 2 9. 02 63 15.7 910 3.00 44 0.19 30 5.3 323 0.003 1 0.0 049 Wiener 140. 442 9 17 .7 25 2 11.8 50 4.21 01 0.34 27 2.7 154 0.011 7 0.1 297 Hybrid1
(MW) 369. 20 4. 87 85 19.2 148 2.20 8 0.13 04 9.8 660 0.012 2 0.1 206 Hybrid2
(MM) 367. 39
4. 98 10
19.1 675 2.23
897
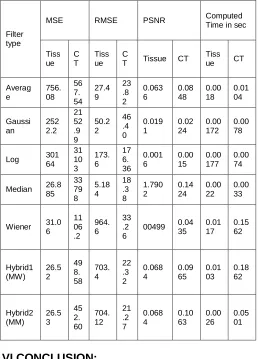
Table VIII. Image quality parameters by the Average, Gaussian, Log, Median, and Wiener filters, Hybrid1, hybrid
2 with Hybrid GSSnoises applied on the tissue image and CT scan image
Filter type
MSE RMSE PSNR Computed
Time in sec
Tiss ue C T Tiss ue C
T Tissue CT Tiss ue CT Averag e 756. 08 56 7. 54 27.4 9 23 .8 2 0.063 6 0.08 48 0.00 18 0.01 04 Gaussi an 252 2.2 21 52 .9 9 50.2 2 46 .4 0 0.019 1 0.02 24 0.00 172 0.00 78
Log 301
64 31 10 3 173. 6 17 6. 36 0.001 6 0.00 15 0.00 177 0.00 74 Median 26.8
85 33 79 8 5.18 4 18 .3 8 1.790 2 0.14 24 0.00 22 0.00 33
Wiener 31.0 6 11 06 .2 964. 6 33 .2 6
00499 0.04 35 0.01 17 0.15 62 Hybrid1 (MW) 26.5 2 49 8. 58 703. 4 22 .3 2 0.068 4 0.09 65 0.01 03 0.18 62 Hybrid2 (MM) 26.5 3 45 2. 60 704. 12 21 .2 7 0.068 4 0.10 63 0.00 26 0.05 01
VI CONCLUSION:
Average, Gaussian, Log, Median, Wiener, Hybrid PG, Hybrid GSS were applied on the original image to remove various category of noises such as Salt & Pepper, Gaussian, Poisson, a Speckle, Hybrid PG noise, and Hybrid GSS noise. The best filter depended on the image quality parameter of PSNR .The performance of Median filter after removing the noise for salt& Pepper and Both Hybrid noises in histopathological and computed tomography images is better than other filters. The performance of Wiener filter after removing the noise for Poisson, Speckle and Gaussian noises in histopathological images is better than other filters. Hybrid filter (Mean & Median) give best in Poisson noise in computed tomography image. Hybrid filter (Mean &Wiener) give best in Gaussian noise in computed tomography image. Meanwhile Log filter is not suitable removing any type’snoise. Median filter have most ability to remove noise with minimum computation time.
VII ACKNOWLEDGEMENT
This research work has been supported by RUSA PHASE 2.0, Alagappa University, Karaikudi.