ISSK- An Integrated Self Service Kiosk for Health
Monitoring and Management
N. Komal Kumar, Dr. R. Bhavani, Dr. A. Mohan, D. Vigneswari
Abstract— India has a huge population of around 1.35 billion people. 80% of India lacks in health infrastructure, medical manpower and other health resources. Approximately 40% of the Population suffers from lifestyle-related diseases (Non Communicable disease NCD) like Hypertension, Diabetes, Obesity, Low nutrition, cardiovascular diseases, and Chronic Respiratory problems. The aim of our work is to provide effortless scalable preventive care solution by keeping tracking of few vitals medical parameters like Blood Pressure (BP), BMC, Body Mass Index (BMI), Electrocardiogram (EKG), Pulse and Weight. FDA compliant test measurements with high test accuracy and sensitivity to measure your vitals in the quickest and most efficient way. A network of easy screening healthcare kiosks all around the Country, log in from anywhere, any-time, and keep control of your health. No more paper records all over the country. Your personal health records and data all in one place.
Index Terms— Kiosk, Health, Monitoring, Lifestyle, Preventive, Effective, Automatic, Disease, Management.
—————————— ——————————
1
I
NTRODUCTION Electronic Health Records (EHR) is the methodical way of collecting patients’ information and storing it in a digital form [1]. This information can be shared via a network connection, internet to all health care centers around the world for monitoring and managing. EHR may include a range of information such as patient demographics, medical history, allergies, laboratory test results, medical images, etc. In olden days EHR's are meant only to maintaining the quality of health care, but nowadays they are used to increase the quality of health outcome by taking appropriate measures. A medical practitioner can make use of multiple clinical data stored in the EHR to identify and stratify the cause of illness. EHR also eliminates the use of paper records which results in data replication and medical errors, captures the state and activities of the patient in real time, since it is in the digital form, data analyst can use data mining techniques to analyze the cause and effect of the ill caused to the patient and take appropriate measures to overcome. Several studies [2] [3] indicated that EHR improves the qualities of health care coordination by cutting down the guessing of patients history, analyzing multiple parameters with its relations, and allows to take decisions in emergency situations.The work is divided into following, sections 2 discusses the various studies in Electronic Health Records (EHR) and automated medical monitoring and management, section 3 represents the proposed methodology, section 4 focuses on the experimental implementation of the automated self-service kiosk and finally concluded in section 5.
2
R
ELATED WORKThis section discusses the recent works of Electronic Health Records (EHR) and automated health care monitoring and management in recent years.
Varma [4] designed a microcontroller based Body Mass Index (BMI) calculator, which calculates the BMI of a person with the help of two parameters i.e. height and weight. The hardware consists of a weighing machine, which measures the weight of the person in terms of kilograms and a height sensing device which calculates the height using a Light Dependent Resistor (LDR), with the available data BMI of the person is calculated, displayed in the LCD display and sent to the personal mobile number using GSM module. The limitation is that the final reports to be prepared manually, there are no minimum fat burning records and there is no cloud storage to maintain records for the future. A semi-automatic digital blood pressure monitor was proposed in [5], which measure both the systolic and diastolic pressure of a person. A piezoresistive silicon pressure sensor is used as the transducer to measure the pressure with a range of 0-7.3 PSI. Measuring health pressure regularly helps to distinguish patients between genuine high blood pressure and hypertension. The proposed method is not portable for gym goers who increase their blood pressure often and there is no cloud storage to maintain the patients’ records. Joshi [6] analyzed cardiac disease using Electrocardiogram (ECG) signals for Cardiac Arrhythmia using the analysis or abnormal and normal wave patterns, the work also classified the heart beats according to different arrhythmia. The limitation is that it cannot able to provide instant measures with high accuracy in less time. Thanapatay [7] proposed ECG beat classification for ECG printouts using Support Vector Machine and Principle Component Analysis. In order to extract the shape, discrete wavelet transform filters were applied to remove noise from the ECG signal, later it is processed using image processing technique. Tang [8] proposed an unobtrusive cuffless blood pressure monitor using the pulse arrival time. ECG and PPG were used to calculate the pulse arrival time of the patient; the proposed system was potential to calculate long term blood pressure of the patient. Zheng [9] proposed a
————————————————
N. Komal Kumar, Department of CSE, St. Peter’s Institute of Higher
Education and Research, Chennai. E-mail:komalkumarnapa@gmail.com
Dr. R. Bhavani, Department of CSE, Vel Tech Multi Tech Dr. Rangarajan
Dr. Sakunthala Engineering College, Chennai. E-mail: bhavanir@veltechmultitech.org
Dr. A. Mohan, Department of IT, Vel Tech High Tech Dr. Rangarajan Dr
Sakunthala Engineering College, Chennai. E-mail:annamalaimohan@gmail.com
D. Vigneswari, Department of IT, KCG College of Technology, Chennai.
Fig. 1. Architecture of ISSK
new blood oxygen monitoring based on the combination of general oxygen monitoring with attribute theory; the system uses 2ml of blood and detects the oxygen levels in the blood with attribute theory, the system lacks in detecting the purity of blood, functions of heart and a cloud storage for future analysis. An automatic medicine dispensing machine was proposed in [10], the system consists of a microcontroller and a motor, that dispenses the medicine, based on the input such as body temperature and blood pressure. Veeraraghavan [11] developed a PC logging tool that extracts the insights from the accessed information in the system, the tool successfully extracted the information from the patients in several areas of Maharashtra and Uttar Pradesh, the system was found to an effective one than the kiosk operator which involves in a questionnaire method for gathering information. Navdeep [12] reviewed the existing cloud storage technologies, its security concerns, and challenges in its maintenance and operation. Privacy-preserving synthetic logarithmic perturbation technique for incremental data in cloud environment was proposed in [13], where the data is stored in the cloud is subjected to a synthetic logarithmic perturbation before storing the data in the cloud, the proposed system outperforms the traditional masking approaches. Machine learning classifiers [14, 15, 16, 17] can also be used to in the diagnosis of health related issues.
3
PROPOSED METHODOLOGYThis section discusses the proposed methodology for an integrated self-service kiosk for health monitoring and management. The overall architecture is represented in Fig. 1
Implementation is the state in the system where the theoretical design is turned into a working system. The most crucial stage in achieving a new successful system and in giving confidence on the new system for the users that will work efficiently and effectively. The system can be implemented only after thorough testing is done and if found to work according to the specification. It involves careful planning, investigation of the current system and its constraints on implementation, a design of methods to achieve the
changeover, an evaluation of changeover methods apart from planning. The validity and proper functionality of all the modules of the developed application are assured during the process of implementation. After designing the new system, the whole system is required to be converted into a language understood by the computer. This is accomplished by coding. Coding is an important stage where the defined procedures are transformed into control specifications with the help of a computer language. This is also called the programming phase in which the programmer converts the program specifications into computer instructions, which we refer to as programs.
3.1 Modules
Development of a self-service kiosk for heals monitoring and management involves various modules integrated into a single system. The following are the modules,
1. Login/Signup 2. Generation of Portal
3. ECG
4. BMI
5. Temperature
6. BMC
7. Spo2
8. Blood Pressure (BP) 9. Analytical Portal 10. Report Generation 11. E-mail
4 E
XPERIMENTAL IMPLEMENTATIONThe modules implemented in this process are based on the architecture design of health KIOSK by developing front end, back end and configuring of health portal in AZURE cloud. The user can access their account in the health portal by launching a portal website. The overall flow of health kiosk shows the UI confi-guration that could be supported and synchronized with a portal cloud server. The overall portal and analytical portal are encrypted using a Dynamo DB. Each portal site will have an admin and API call service and table storage. All Admin services are developed using C#. The back end uses a Microsoft SQL SERVER EXPRESS 2016 in Azure cloud. The final medical report will be sent to the user through their registered email id by subscription of an API call.
4.1 Login/Sign up
Fig. 2. Login/Sign up
Fig. 3. Portal Generation
Fig. 4. ECG Generation from Lead 1
Fig. 5. ECG Generation from Lead 3
Fig. 6. ECG results
Fig. 7. BMI Instructions
4.2 Generation of Portal
After registration, the assignment of the users to the cloud portal takes place for each user which has to be logged in to the respective machine where the user accessed. The steps are, giving the code to create an automatic account for users, Assigning SQL SERVER 2012 to store their user's details, give the query which should be executed in logged in machine UI.
4.3 ECG
An electrocardiogram (ECG) is a test that detects heart problems by measuring the electrical activity generated by the heart as it contracts. The steps are, Fix the electrodes in the kiosk machine, Assemble the kit inside the kiosk machine and connect the electrodes within the ECG kit, the test will analyze the graph up to three leads, ECG kit generates the raw data which should be collected to generate the graph, Analyze the graph based on PQRST waves.
4.4 Body Mass Index (BMI)
Fig. 8. BMI result
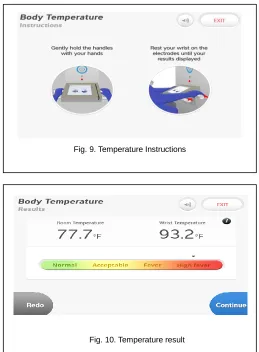
Fig. 9. Temperature Instructions
Fig. 11. BMC Instruction and result
Fig. 12. Spo2 Instruction 4.5 Temperature
The average normal body temperature is generally accepted as 98.6°F (37°C). Some studies have shown that the "normal" body temperature can have a wide range, from 97°F (36.1°C) to 99°F (37.2°C). A temperature over 100.4°F (38°C) most often means you have a fever caused by an infection or illness. The steps are, Fix the IR sensor in the kiosk machine, Assemble the kit on inside the kiosk machine, Convert the final results into digital which should be displayed in machine UI, Analyze the result and tell the status of temperature.
Fig. 10. Temperature result
4.6 BMC
Displays the body fat by passing the current to user’s body, after that which emits the wave from a human which should be analyzed and calculated. The steps are, Fix the IR sensor in the kiosk machine and pass the current, Measure the emitted wave from the human body and analyze the measurement, Convert the final results into digital which should be displayed in machine UI, Analyze the result and display the status of BMC.
4.7 SpO2
Fig. 13. Spo2 result
Fig. 14. Blood Pressure Instruction
Fig. 15. Blood Pressure Result
Fig. 16. Analytics portal
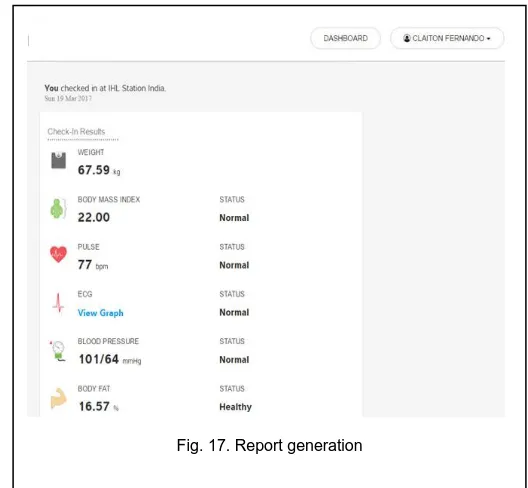
Fig. 17. Report generation 4.8 Blood Pressure
More than 120 over 80 and less than 140 over 90 (120/80-140/90): You have a normal blood pressure reading but it is a little higher than it should be, and you should try to lower it. Make healthy changes to your lifestyle. The steps are, Fix the BP CUFF on the right side of the kiosk machine, Measure the value range and analysis of the measurement, Convert the final results into digital which should be displayed in machine UI, Analyze the result and tell the status of Systolic and Diastolic.
4.9 Analytics Portal
To know about the status of each machine and it should be used for maintenance purpose. The steps are, Create the form using AJAX for the current status of the machine, Establish the connection which connects with SQL SERVER 2012, Give the query to see the details about the kiosk machine, develops the
API call to pass the data and provides efficient storage and security.
4.10 Report Generation
Final report of the user will be taken as handouts for doctor consultation. The steps are, Connect the printer to the left side bottom of the kiosk, Configure with kiosk machine operating system, Give the query to that the details to be printed in a kiosk machine.
4.11 E-mail
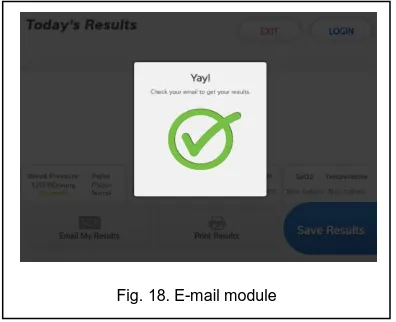
Final report of the user's health status will be sent to the user's email account.
Step 1: Start
Step 2: Final report of health status which will be passed into API calls.
Step 3: Get provider from the API call id which can be fixed in the backend of email module.
Fig. 18. E-mail module
5
CONCLUSION AND FUTURE OUTLOOKAn integrated self-service health monitoring and management KIOSK is presented in this paper. It provides an effortless scalable preventive care solution by keeping track of vital medical parameters such as Blood Pressure, Body fat, Body Mass Index (BMI), Electronic cardiograph (EKG), pulse and Weight. Each member should be logged in into the health portal for monitoring, maintaining Electronic Health Records (EHR) which is deployed into a highly secured cloud environment. The Electronic Health Records (EHR) and medical analysis of the user will be automatically updated to the cloud. Reports generated can be displayed in the KIOSK UI portal and be sent as a mail via email module. Eye power tracking, automatic medicine vending, and analysis of sugar levels can do the future outlook.
A
CKNOWLEDGMENTThe authors wish to thank the authorities of KCG College of Technology, Chennai, Vel Tech Multi Tech Dr. Rangarajan Dr. Sakunthala Engineering College, Chennai, Vel Tech High Tech Dr. Rangarajan Dr. Sakunthala Engineering College, Chennai and St. Peter’s Institute of Higher Education and Research, Chennai, India.
R
EFERENCES[1] https://en.wikipedia.org/wiki/Electronic_health_record
[2] Greenhalgh T, Potts HW, Wong G, Bark P, Swinglehurst D.: Tensions and paradoxes in electronic patient record research: a systematic literature review using the meta-narrative method. The Milbank Quarterly. 87 (4): 729–88 (2009)
[3] Berg M.: of Forms, Containers, and the Electronic Medical Record: Some Tools for a Sociology of the Formal". Science, Technology & Human Values. 22 (4): 403–433 (1997)
[4] Varma, M. D. S., Mhatre, M. V. R., More, M. P. M., & Ayane, S. S.: Measurement of Body Mass Index (BMI) using PIC 18F452 Microcontroller. International Journal on Re-cent and Innovation Trends in Computing and Communication, 3(4), 2213-2216 (2015)
[5] Fuentes, R., & Bañuelos, M. A.: Digital blood pressure monitor. Journal of applied re-search and technology, 2(3), 224-229 (2004)
[6] Joshi, A., Tomar, A.K., & Tomar, M.S.: A Review Paper on Analysis of Electrocardio-graph (ECG) Signal for the Detection of Arrhythmia Abnormalities. International Journal of Advanced Research in Electrical, Electronics, and Instrumentation Engineering, 3(10), 12466-12475 (2014)
[7] Thanapatay, D., Suwansaroj, C., & Thanawattano, C.: ECG beat classification method for ECG printout with Principle Components Analysis and Support Vector Machines. 2010 International Conference on Electronics and Information Engineering, 1, V1-72-V1-75. (2010)
[8] Tang, Z., Tamura, T., Sekine, M., Huang, M., Chen, W., Yoshida, M. & Kanaya, S.: A Chair–Based Unobtrusive Cuffless Blood Pressure Monitoring System Based on Pulse Arrival Time. IEEE Journal of biomedical and health informatics, 21(5), 1194-1205 (2017)
[9] M. Zheng and J. Feng, : Blood Oxygen Monitoring Cloud Platform based on the Attribute Theory College of Information Engineering. 2012 IEEE International Conference on Granular Computing, Hangzhou, 657-662 (2012)
[10]M. Penna, D. V. Gowda, J. J. Jijesh and Shivashankar,.: Design and implementation of automatic medicine dispensing machine. 2017 2nd IEEE International Conference on Re-cent Trends in Electronics, Information & Communication Technology (RTEICT), Bangalore, 1962-1966 (2017))
[11]R. Veeraraghavan, G. Singh, K. Toyama, and D. Menon. : Kiosk Usage Measurement us-ing a Software Logging Tool. 2006 International Conference on Information and Commu-nication Technologies and Development, Berkeley, CA,317-324 (2006)
[12]Navdeep Aggarwal, Parshant Tyagi, Bhanu P Dubey, and Emmanuel S Pilli. Article: Cloud Computing: Data Storage Security Analysis and its Challenges. International Journal of Computer Applications 70(24):33-37 (2013)
[13]Vigneswari D, Komal Kumar.N, Dr. Lakshmi Tulasi.: A Privacy-Preserving technique for incremental data set on cloud by synthetic data perturbation, International Journal of Engineering & Technology, 7(3.34), 331-334 (2018)
[14]Komal Kumar N., Vigneswari D., Vamsi Krishna M., Phanindra Reddy G.V. An Optimized Random Forest Classifier for Diabetes Mellitus, Advances in Intelligent Systems and Computing. 2019; 813, 765-773)
[15]N. Komal Kumar, D. Vigneswari, M. Kavya, K. Ramya, T. Lakshmi Druthi, Predicting Non-Small Cell Lung Cancer: A Machine Learning Paradigm. Journal of Computational and Theoretical Nanoscience. 2018; 15(6/7): 2055–2058
[16]Komal Kumar.N, Vigneswari.D, B A S Roopa Devi. MSO – MLP diagnostic approach for detecting DENV serotypes, International Journal of Pure and Applied Mathematics. 2018; 118(5): pp 1-6.