© 2017 IJSRST | Volume 3 | Issue 6 | Print ISSN: 2395-6011 | Online ISSN: 2395-602X Themed Section: Science and Technology
A Comprehensive Clinical Decision Support Application
Software Tool for Dose Management Procedure in SPECT
Issahaku Shirazu
1, 3, 5, Theophilus Sackey
1, 3, 5, Mary Boadu
4, 5, Ernest Kojo Eduful
1. 3, 5,
Edem Sosu
1, 3, 5Francis Hasford
3, 4, 5, Awo Assasie-Gyimah
3, Theresa, Bebaaku Dery
1, 5,
Mark Pokoo-Aikins
1, 51University of Cape Coast, School of Agriculture and Physical Sciences Faculty of Physical Sciences, Department of Physics,
Cape coast, Ghana
2University of Ghana Medical School, Department of Radiology, Korle-Bu Teaching Hospital, Accra Ghana 3
National Centre of Radiotherapy and Nuclear Medicine, Department of Medical Physics, Korle-Bu Teaching Hospital, Accra Ghana
4Graduate School of Nuclear and Allied Sciences, University of Ghana, Legon, Ghana 5
Ghana Atomic Energy Commission, Radiological and Medical Sciences Research Institute, Medical Radiation Physics Centre, Accra, Ghana.
ABSTRACT
SPECT is a nuclear medicine tomographic imaging technique which uses gamma rays to produce images from a radioactive source. The source is either administered or injected into the patient and an attached computer process the information as an image. In medical imaging procedure, patients radiation dose are manage through appropriate dose optimisation protocol by various imaging centers. The protocol is designed to establish a balance between the injected activity and the quality of images produced. The aim of the study is to determine and design a GUI of the relationship between patient’s radiation dose from the injected activities and the image quality based on the signal to noise ratio. The study procedure involved three processes, the injected activities, which is administered to patients based on age, weight and gender, the process imaging technique based on image reconstruction method and the image quality, based on signal to noise ratio. Minitab statistical application tool was used to design a comprehensive clinical support application software based on mathematical model of patient’s preclinical information and administered activity. This was done by using experimental analytical modeling technique to determine BSI, from measured body height and weight based on age and gender. The Minitab regression modeling technique was then used to model the relationship between administered activities (potential patient dose) based on age and weight and image quality based on signal to noise ratio (SNR). So that with known patient’s height and weight and the injected activity, pre-imaging input parameters are determined, enabling dose estimate parameters to be predicted before the beginning of the imaging procedure. These were done in order to predict the expected SNR that will be good enough to answer all the clinical questions from the administered activities. This enable dose optimisation protocol to be established using a comprehensive clinical decision support application software for clinical application in SPECT imaging.
Keywords: Signal To Noise Ratio, Analytical Modeling, Exposure, Injected Activity.
I.
INTRODUCTION
SPECT imaging is a nuclear medicine techniques, comprising a radioactive material as a source of photon and a specially design computer with a camera. SPECT scan integrates two technologies to view patients body, this include computed tomography technology designed
Before a SPECT scan, the patient is injected with a chemical that is radiolabeled, meaning it emits gamma rays that can be detected by the scanner camera and an attached computer that process the information from the ratio tracer to be process into images. That’s the computer collects the information emitted by the gamma rays and translates them into two-dimensional cross-sections. These cross-sectional images can be added back together to form a 3D image of the patient body.
The radioisotopes typically used in SPECT to label tracers are iodine-123, technetium-99m, xenon-133, thallium-201, and fluorine-18. These radioactive forms of natural elements will pass safely through the patient body and be detected by the scanner camera. Various drugs and other chemicals can be labeled with these isotopes.
The type of tracer used depends on what is to be measured. For example, if the request is to assess tumor, it might be radiolabeled glucose (FDG) and watch how it is metabolized by the tumor.
New model in SPECT technology enable the reconstructed images to produce the true 3D information. This allow nuclear medicine physicians to view tissues and whole organs in 3D format to answer all the clinical questions. However, the fact that radioactive substance are introduced into the patient called for concern by users of this technology and clinicians. This procedure remain a challenge since its inception, to nuclear medicine practitioners and the general public. To address this challenge it is necessary to administer a minimum amount of radio nuclear that will produce enough quality of images to answer all the clinical question. This balance is achieve by establishing the relationship between administered activity and the quality of images produce based on signal to noise ratio (SNR). That is, for accurate and optimized imaging procedure in SPECT imaging, experimental analytical modeling technique is used to model the relationship between pre-imaging administered activity (potential patient dose) and image quality using signal to noise ratio (SNR). This was done by modeling the relationship established between the administered activity and quality of images produced to simplify this process. So that with known input pre-imaging parameters, patients
body parameters and administered activity the quality of images are predetermine. These were done in order to predict the expected SNR that will be good enough to answer all the clinical questions. Finally, a GUI is develop to provide a comfortable working process for graphic display.
Models are mathematical formulas that are applied to data to identify relationships among various depend and independent variables, such as correlation or causation. In general terms, models may be developed to evaluate a particular variable in the data based on other variable(s) in the data, with some residual error depending on model accuracy. In addition, models derived from data are best described by inferential statistics mode, which includes techniques to measure relationships between particular variables.
Scientist build models that are descriptive of scientific data to simplify analytical process and communicate results. Once the data is analyzed, it may be reported in many formats to the users of the data to support their requirements. This also aid feedback and assist in the improvement of the quality of the model. As such, most of the analytical cycle is an iterative process [1]. The results of a model maybe text base technique or visual indicators techniques or both to help clearly and efficiently communicate the message to the users. The text base are usual display as GUI while the visual indicators are display as diagrams, tables and charts to help communicate key messages contained in the data. Diagrams are useful visualized explanation of data, tables on the other hands are helpful to a user who might lookup specific numbers, while charts (e.g., bar charts or line charts) may help explain the quantitative messages contained in the data. However, the best method is to develop a text base model couple with a visual indicators.
AIM
The aim of the study is to determine a GUI based on modeled mathematical relationship between injected activity, age, gender, weight, height and BSI, and signal to noise ratio during SPECT imaging.
Various input parameters are related to the process data, which determine the image quality and the resultant patient’s radiation dose during SPECT imaging. These are done by designing a mathematical equations which describe the procedure in nuclear medicine imaging that reduce unnecessary radiation exposure to patients and at the same time maintain adequate information on the images to answer all the clinical questions [2, 3]. This provide standard reference data to aid image analysis and enable clinicians to provide accurate information for clinical decision at the same time avoid unnecessary exposure to patients. Through effective patients radiation dose procedure and protocol. This is best achieved by the use of computer aided design model based on mathematical modeling technique.
A mathematical equation, refer to as model is a set of mathematical statements, mostly with double or triple variables, say S, Q and M. Where S is a system, Q is a question relating to the system S, and M is a set of mathematical statements, where M = {1, 2… n} which can be used to answer Q. For instance to an observer B, an image A* is a model of an object A to the extent that B can use A* to answer questions that interest him about A [76].
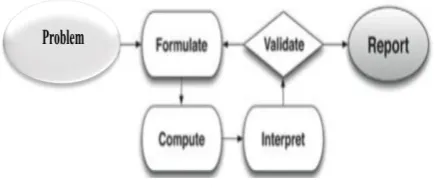
In recent time’s mathematical modeling are used to design an interface for an interactive relationship between various elements in a system. It typically depend on a number of input parameters, which when processed through a mathematical formulae, results in one or two outputs. Figure 1, shows a schematic
diagram of the process of mathematical modeling [3].
Figure 1: Mathematical Model
Mathematical models together with a suitable computer algorithm are used in variety of fields. Partly because these models are easy to compute and standardize by changing variables and factors in the designed expression. More importantly with the use of software
during the modeling processes and procedure in order to overcome the obvious challenge of user interactive capabilities.
III.
MATERIALS
The materials used included;
Patients images data
SPECT System
Radioactive source (Tc-99m)
Mo/Tc Generator
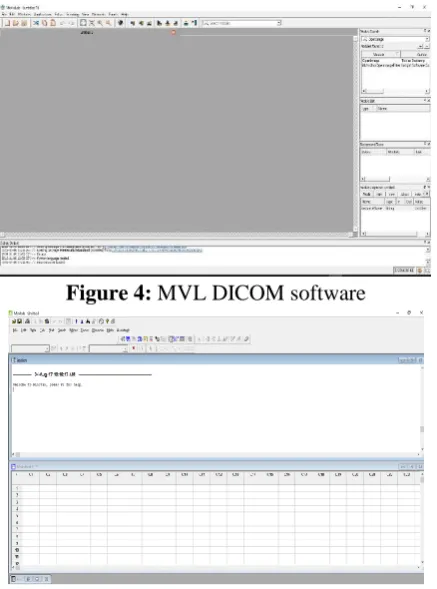
MVL DICOM Application software.
Minitab statistical Application tool
Figure 2: SPECT
Figure 4: MVL DICOM software
Figure 5: Minitab Application Software
IV.
METHODOLOGY
Pre-imaging data process involve collections of patients’ basic information as part of the imaging process. The parameters measured include; gender, age, height, weight, patients’ injected activity and BSI. These were done as part of the basic imaging protocols as standard practice at the hospital.
Approximately 200 patients pre-imaging data were captured between 2013 and 2016. This were reviewed, analysed and modeled in two sets of mathematical models. First model was based on gender, weight and age, in relation to BSI. The second model was based on injected activity and BSI in relation to SNR. Both models were developed in terms of gender and age as a major input parameters. These were modeled using advance statistical modeling tools known as major axes regression analysis with Minitab statistical software platform. Together with experimental empirical analysis using fundamental correlation relationship.
These experimental modeling process involve the use of mathematical modeling procedure which reduces the data from empirical measurements to real clinical application process for implementation [4]. These were
done using experimental analytical modeling technique to established equations that described the relationship between patients statistics on one and how it relate injected activity and image quality based on signal to noise ratio of the image. This modeling technique involve the use of mathematical regression analysis to determine the mathematical relationship between two or more variables. The idea of linear regression equation predictor which is use to estimate the relationship between two unknown variables in the form of the model equation predictor were used as in:
1
where Y is the unknown variable and X is the predictor with B0 and B1 as the intercept on the axis of the
unknown variable and slope of the relationship between the two variables respectively.
In addition, each predictor in a regression equation has an estimated coefficient associated with the sample population regression coefficients. That is, by using the estimated coefficients (B1) with the predictors to
calculate the fitted value of the response Y. Furthermore, the model equations were verified by estimating B1 and
B0 and compare them with the modeled linear regression
equation predictor above. In addition the estimated coefficient (B1) were also estimated using the formula in
simple linear regression:
2
where the formula for the intercept (B0) were estimated
using:
3
These were done and the two standard models were determined and converted to GUI using computer design models.
V.
DESIGN MODEL
a creation of an integrated text-based application software using GUI in a form of text-based user interface which is applicable in clinical environment. This serve as an input interface for the nuclear medicine department for purposes of radiation protection and the estimation of appropriate input parameters as a control measure.
Statistical analysis as well as other inferential statistics of the data were performed using Minitab 1.6 Statistical analysis tools [5]. This involve the use of both Multivariate techniques for the distribution of a variable and analysis of variance technique for the various analysis of the data. The Multivariate Analysis of Variance (MANOVA) technique, suitable for large distribution of variable or sample population greater than 30 sample units or number of observations were applied. While the analysis of variance (ANOVA) which is a collection of statistical model was use to analyzed the differences among the mean of the various age and gender variations and their associated procedures [6]. In other words, both the ANOVA, correlation and multivariate regression analyses were performed. Correlation and major regression analyses were also carried out to determine the relationship that exists among the various parameters, in both the primary, in term age, gender and patient body size and the secondary data in terms of injected activities and patient size in relation to SNR using Minitab 1.6 statistical analysis.
The expected results of the two modeled relationship between injected activities and image quality based on age, weight, height, and other body parameters are shown in equation 4 and 5. In addition these were presented based on gender (M/F), paediatric (P) and adults.
BSIM/F/P = µ0A + µ1W + C0 4
SNRM/F/P = λ0A0 + λ1BSI + C1 5
Where A, W, A0, BSI are age, weight, injected activity
and body surface index respectively. µ,λ, and C, are constants determined and presented as shown in equation 6-10.
RESULTS
The modeled adult female equations are:
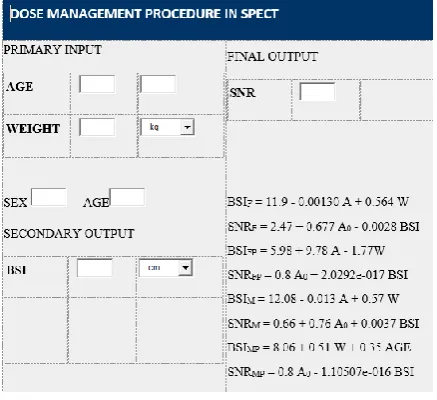
BSIF = 11.9 - 0.00130 A + 0.564 W 6
SNRF = 2.47 + 0.677 A0 - 0.0028 BSI 7
The modeled paediatric female equations are:
BSIFP = 5.98 + 9.78 A - 1.77W 8
SNRFP = 0.8 A0 + 2.0292e-017 BSI 9
The modeled adult male equations are:
BSIM = 12.08 - 0.013 A + 0.57 W 10
SNRM = 0.66 + 0.76 A0 + 0.0037 BSI 11
The modeled paediatric male equations were:
BSIMP = 8.06 + 0.51 W + 0.35 AGE 12
SNRMP = 0.8 A0 - 1.10507e-016 BSI 13
These equations were converted to GUI and presented as in figure 4.
Figure 6. GUI for dose management
VI.
ANALYSIS AND DISCUSSIONS
activity the quality of the expected images are determined prior to the start of the imaging process. This enable adequate information to be made available to the nuclear medicine physician for clinical decision and the development of appropriate patient’s dose management protocol. Hence this enabled the improvement of radiation protection of patients from excessive and unnecessary radiation dose.
VII.
RECOMMENDATIONS
The results of this study has been comprehensively and effected tested. This produced excellent results and it is recommended for use by nuclear medicine technologist and physicians for dose management. Hence radiation protection of patience
VIII.
REFERENCES
[1].O'Neil, Cathy and, Schutt, Rachel (2014). Doing Data Science. O'Reilly. ISBN 978-1-449-35865-5
[2].WILEY-VCH Verlag GmbH & Co. KGaA,
Weinheim, Mathematical Modeling and
Simulation: Introduction for Scientists and Engineers. Kai Velten, 2009, ISBN: 978-3-527-40758-8, Pages: 67-89
[3].Feeman, Timothy G. The Mathematics of Medical Imaging: A Beginner's Guide. Springer Undergraduate Texts in Mathematics and Technology. Springer. ISBN 978-0387927114, 2010
[4].Hutton B F and Osiecki A 1998 Correction of partial volume effects in myocardial SPECT J. Nucl. Cardiology. 5 Pages: 402–413
[5].Lisa Sullivan, Hypothesis Testing - Analysis of Variance (ANOVA), Boston University School of Public Health, 2010
[6].Ghana Statistical Service, 2010 population and housing project, National Analytical report, May 2013; Page: 54
[7].Paras, P. Quality Assurance in Nuclear Medicine in Medical Radionuclide Imaging. Proceedings of IAEA symposium. Los Angeles, 1976, IAEA, Vienna, Austria, Pages 130- 143. [8].Guidelines and Standards Committee of the
ACR Commission on Nuclear Medicine in collaboration with the SPR. ACR-SPR Practice
Guideline for the Performance of Adult and Pediatric Skeletal Scintigraphy (Bone Scan). American College of Radiology and Society of Pediatric Radiology, 2012.