https://doi.org/10.5194/esd-10-171-2019 © Author(s) 2019. This work is distributed under the Creative Commons Attribution 4.0 License.
Development and prospects of the regional
MiKlip decadal prediction system over Europe:
predictive skill, added value of regionalization,
and ensemble size dependency
Mark Reyers1, Hendrik Feldmann2, Sebastian Mieruch2,3, Joaquim G. Pinto2, Marianne Uhlig2,4, Bodo Ahrens5, Barbara Früh6, Kameswarrao Modali7, Natalie Laube2, Julia Moemken1,2,
Wolfgang Müller7, Gerd Schädler2, and Christoph Kottmeier2
1Institute for Geophysics and Meteorology, University of Cologne, Cologne, Germany 2Institute for Meteorology and Climate Research (IMK-TRO),
Karlsruhe Institute of Technology (KIT), Karlsruhe, Germany
3Alfred Wegener Institute for Polar and Marine Sciences, Bremerhaven, Germany 4School of Geography, Environment and Earth Sciences,
Victoria University of Wellington, Wellington, New Zealand 5Institute for Atmospheric and Environmental Sciences, Goethe University Frankfurt a. M., Frankfurt a. M., Germany
6Deutscher Wetterdienst (DWD), Offenbach, Germany 7Max Planck Institute for Meteorology, Hamburg, Germany
Correspondence:Mark Reyers ([email protected])
Received: 25 July 2017 – Discussion started: 4 September 2017
Revised: 13 February 2019 – Accepted: 1 March 2019 – Published: 20 March 2019
1 Introduction
In recent years, interest in climate predictions on timescales from 1 year up to a decade has increased in the climate sci-ence community, since this time span falls within the plan-ning horizon for a wide variety of decision makers (Meehl et al., 2009, 2014). A large ensemble of initialized decadal hindcasts has been consolidated in a component of the Cou-pled Model Intercomparison Project Phase 5 (CMIP5; Taylor et al., 2012), and the number of studies aiming at decadal pre-dictions has strongly increased in recent years (for a review see Meehl et al., 2014). Typically, the North Atlantic is a key region for decadal predictions and forecast skill is found for various quantities such as heat content and sea surface tem-perature (e.g. Kröger et al., 2012; Yeager et al., 2012), CO2 uptake (Li et al., 2016), and integrated quantities such as the sub-polar gyre (Matei et al., 2012; Yeager et al., 2012; Rob-son et al., 2013). Recent studies suggest that in particular the Atlantic multi-decadal variability, which is strongly linked to the Atlantic Meridional Overturning Circulation (AMOC), is a major source of decadal predictability (Smith et al., 2012; Pohlmann et al., 2013a). As such low-frequency variability patterns may affect the climate globally, perennial means of meteorological parameters might be predictable several years ahead. Numerous studies focus on primary meteorological parameters on the global scale, in particular surface tempera-ture (e.g. Chikamoto et al., 2012; Doblas-Reyes et al., 2013; Ho et al., 2013; Corti et al., 2015). Comparatively few studies analyse storm tracks (Kruschke et al., 2014, 2016), Atlantic tropical cyclones (Dunestone et al., 2011), intense or extreme events (e.g. Benestad and Mezghani, 2015; Eade et al., 2012), or zoom into a certain region of the world (e.g. Guemas et al., 2015).
In the German research consortium MiKlip (http://www. fona-miklip.de, last access: December 2018), a global decadal prediction system was developed based on the Max Planck Institute Earth system Model (MPI-ESM; for an overview see Marotzke et al., 2016). Within the project, sev-eral hindcast generations were produced. The first two are discussed in this paper. The skill of the MiKlip System for decadal predictions was analysed in a wide variety of re-cent studies. For example, Müller et al. (2012) investigated global surface air temperature in the first generation of the global MiKlip system (baseline0, which was a contribution to CMIP5) and found that the initialized hindcasts have predic-tive skill over the North Atlantic region, while negapredic-tive skill scores are identified for the tropics. A modified initialization in the second global MiKlip system generation (baseline1) considerably improves the performance in the tropics, but brings only limited skill improvement over the North Atlantic and Europe (Pohlmann et al., 2013b). Kruschke et al. (2014) identified significant positive skill scores for cyclone fre-quency over the central North Atlantic in the global baseline0 and baseline1 generations, while no significant skill was de-tected over the eastern North Atlantic and Europe.
Further-more, Kadow et al. (2015) evaluated the global MiKlip sys-tem with respect to sys-temperature and precipitation, giving evi-dence that an enlargement of the hindcast ensemble generally leads to an improvement of the prediction system.
The MiKlip consortium is to our best knowledge the first institution worldwide which has established a decadal pre-diction system for the regional scale. With this aim, con-siderable efforts were made to downscale the global MPI-ESM hindcasts by developing and/or employing different re-gionalization techniques. After the second project phase, an exceptionally large ensemble was regionalized by dynami-cal downsdynami-caling with regional climate models. Although be-ing computationally expensive, dynamical downscalbe-ing has many advantages compared to other downscaling methods. For example, all output variables are physically consistent in dynamically downscaled model runs, which is particularly important when using decadal predictions for impact mod-elling, hydrological simulations, or user-oriented parameters. Previous experiences reveal that a skill for regional decadal predictions exists but that the interpretation of the results is quite complex due to the non-linear relationship to the global prediction skill. For example, Mieruch et al. (2014) found rather heterogeneous predictive skill for precipitation and temperature over Europe in the baseline0 generation. The skill differs over space, season, variable, and lead time af-ter initialization. However, a general feature is an improved model spread for precipitation in the downscaled hindcasts when compared to their global counterparts. A potential for predicting regional peak winds and wind energy potentials over central Europe several years ahead was identified in Haas et al. (2016) and Moemken et al. (2016). Specifically, they found highest skill scores for the first years after ini-tialization. All the individual studies analysing the MiKlip prediction system consider different ensembles, variables, lead times, skill metrics, and/or downscaling and data pre-processing methods. Therefore, it is difficult to draw gen-eral conclusions regarding skill over Europe in the MiKlip decadal prediction system. In particular, an overall statement for the benefit of regionalization and thus for the prospects of a regional decadal prediction system is hardly possible so far. This motivated us to analyse both the global and the down-scaled MiKlip ensemble with respect to different issues.
In this study, the decadal predictive skill for temperature, precipitation, and wind speed over Europe is analysed for the baseline0 and baseline1 generations of the MiKlip sys-tem. With this aim, we used the same methodologies for all three variables to ensure comparability. Global MPI-ESM and downscaled hindcast ensembles are considered to ad-dress the following four key questions:
– Is there a potential for skilful regional decadal predic-tions in Europe?
– How does the regional decadal predictive skill depend on the ensemble size?
– How does the number of initializations affect the skill estimates?
The datasets used in this study are described in Sect. 2, fol-lowed by the methodologies for data pre-processing and skill analysis in Sect. 3. The results for the four key questions are shown in Sect. 4. A summary and discussion, as well as an outlook for future work, are given in Sect. 5.
2 Data
The analysed global hindcasts were simulated with the cou-pled model MPI-ESM in low resolution (MPI-ESM-LR; Giorgetta et al., 2013). Its atmospheric component is based on the ECHAM6 model (Stevens et al., 2013) with a hori-zontal resolution of T63 and 47 vertical levels, which is cou-pled to the MPI-OM (Jungclaus et al., 2013) with a hori-zontal resolution of 1.5◦ and 40 vertical levels. Two hind-cast generations are considered here, both computed with the MPI-ESM-LR but with different initialization strategies. The first generation (baseline0; Müller et al., 2012; Matei et al., 2012) is initialized with oceanic conditions from an experi-ment where surface fluxes from the NCEP/NOAA reanalysis (Kalnay et al., 1996) were assimilated into the ocean model MPI-OM. The anomalies of ocean temperature and salinity from this experiment were then used to initialize the decadal hindcasts in the coupled model. For the second generation (baseline1; Pohlmann et al., 2013b), temperature and salin-ity anomalies from the ocean reanalysis system 4 (ORAS4; Balmaseda et al., 2013) are used instead, together with a full-field 3-D atmospheric initialization using full-fields from ERA40 (Uppala et al., 2005) and ERA-Interim (Dee et al., 2011). For both generations, yearly initialized hindcasts are available, each of them comprising a 10-year period. For each starting date, an ensemble was generated using a 1-day lagged ini-tialization from the assimilation experiments (cf. Marotzke et al., 2016 for more details). For baseline0 there are 10 mem-bers for each fifth year and 3 memmem-bers for the other years, whereas baseline1 provides 10 members for each starting year. Here, we use hindcasts of five starting dates (1 Jan-uary 1961, 1971, 1981, 1991, and 2001; hereafter referred to as dec1960, dec1970, dec1980, dec1990, and dec2000) to cover the whole period from 1961 to 2010. This resulted in an ensemble of 50 global hindcasts per generation (baseline0 and baseline1; hereafter MPI_b0 and MPI_b1).
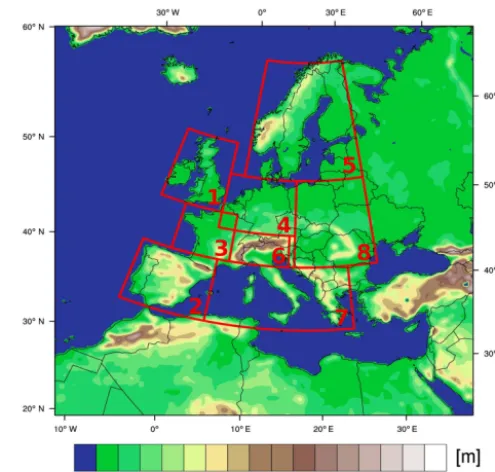
The global hindcasts are dynamically downscaled to the EURO-CORDEX domain (Giorgi et al., 2009; cf. Fig. 1) at a horizontal grid resolution of 0.22◦using the mesoscale non-hydrostatic regional climate model COSMO-CLM (CCLM; Rockel et al., 2008) on a rotated grid. The model ver-sion COSMO4.8-clm17 is employed. By using the MPI-ESM-LR ensemble as driving data, the global “initial
con-Figure 1.CCLM modelling domain (EURO-CORDEX domain): Model orography and PRUDENCE regions. 1: British Isles, BI; 2: Iberian Peninsula, IP; 3: France, FR; 4: Mid-Europe, ME; 5: Scandinavia, SC; 6: Alps, AL; 7: Mediterranean, MD; and 8: eastern Europe, EA.
dition” perturbation strategy is simply passed to the re-gional model. Hence, the downscaled hindcasts also inherit the applied anomaly initialization of the global ensembles. The downscaling experiment includes hindcasts for dec1960, dec1970, dec1980, dec1990, and dec2000, with 10 members per decade (hereafter CCLM_b0 and CCLM_b1). The re-gional ensembles therefore consist of the same time series like the global ensembles MPI_b0 and MPI_b1.
We evaluate the performance of both the global MPI-ESM and the regional CCLM hindcasts with the following datasets. For temperature and precipitation, we consider the observational dataset E-OBS (Haylock et al., 2008) based on the ECA & D (European Climate Assessment & Dataset; http://ecad.eu/, last access: September 2016) at a regular 0.25◦×0.25◦ grid. As no gridded dataset is available for wind, a CCLM simulation forced with boundary conditions from ERA40 and ERA-Interim is employed as verification dataset for wind speed. For this reanalysis-driven simulation, CCLM is applied in the same model set-up as for the region-alization of the global hindcast ensemble (see above).
ob-served natural and anthropogenic forcings (e.g. aerosol and greenhouse gas concentrations among others) for the pe-riod 1850–2005 (e.g. Müller et al., 2012).
3 Methods
3.1 Data processing
All datasets considered in this study are pre-processed in an analogous manner to enable a direct comparison. First, all data are bilinear interpolated to the grid used for the E-OBS data (0.25◦×0.25◦resolution). At each grid point, monthly anomaly time series are computed by subtracting the long-term means for the period 1961–2010 from the interpolated raw datasets. Finally, annual values are derived and multi-annual means for lead years 1–5 are built for further evalua-tion.
Following the suggestion of Goddard et al. (2013), the skill analysis is partly performed for spatial means. Spatial averaging of the anomaly time series is performed for eight PRUDENCE regions over Europe (see Fig. 1; Christensen and Christensen, 2007). Note that we only used grid points over land surfaces for the spatial means as E-OBS data are not available over the oceans. Additionally, we calculated the predictive skill on the basis of all individual grid points for specific analysis.
3.2 Skill metrics
The following metrics are used to evaluate the perfor-mance of the global and regional hindcast ensembles and to address the four key questions: the mean squared er-ror skill score (MSESS) and the anomaly correlation coef-ficient (ACC), which are both measures for the forecast ac-curacy. The skill metrics are applied to the pre-processed time series described in Sect. 3.1 and are computed for multi-annual means for lead time years 1–5 after initialization. Re-cent studies analysing the MiKlip decadal prediction system demonstrated that the MiKlip ensemble performs best for the first years after initialization for a wide range of variables, while the skill diminishes for longer forecast periods. For example, Müller et al. (2012) found highest skill scores for years 1–4 and 2–5 for annual mean surface temperature for both the North Atlantic region and global means. The same is true for annual wind speed and wind energy potentials over central Europe, for which skilful predictions are mainly re-stricted to the first years after initialization (years 1–4), while negative skill scores are found for longer lead time periods (Moemken et al., 2016). Kruschke et al. (2014) provided ev-idence that the prediction skill for winter cyclones over the North Atlantic region is best for years 2–5 and reduced for longer time periods. Following the recommendation by God-dard et al. (2013), we focus, in the following, on the lead time years 1–5 after initialization.
The deterministic MSESS (Murphy, 1988) is defined as
MSESS(HRO)=1−MSEhind
MSEref
(1)
with
MSEhind= 1
N N
X
i=1
Hi−Oi
2 and
MSEref= 1 N
N
X
i=1
Ri−Oi 2
, (2)
wherei=1, . . . ,N is the time index, MSEhind is the mean squared error (MSE) between the ensemble mean of the dynamical downscaled hindcasts (Hi) and the verification data (Oi), and MSEref is the mean squared error of a ref-erence dataset (Ri). In this study, the uninitialized historical simulations, the climatology, or the global initialized hind-casts are used as reference. A MSESS could be between mi-nus infinity and one, with positive MSESS meaning that the hindcasts are closer to the verification dataset than the refer-ence, indicating that the initialization and downscaling lead to higher accuracy in predicting observed values.
Following Murphy (1988) and given that anomalies are used (as in this study), the MSESS with the climatology as reference (i.e.Ri ≡O) can be decomposed as follows:
MSESS(H, O, O)=rH2,O−
rH,O−
SH SO
2
, (3)
whererH,Ois the correlation between the hindcasts (Hi) and the verification data (Oi), andSHandSOare the sample vari-ances of the simulation ensembles and the observations, re-spectively. The second term is the conditional bias.
CB=
rH,O−
SH SO
. (4)
In the case that another reference is applied, the decomposi-tion is as follows:
MSESS(H, R, O)=
rH2,O−hrH,O−SSHO i2
−rR2,O+hrR,O−SSRO i2
1−rR2,O+hrR,O−SSRO
i2 (5)
or
MSESS(H, R, O)=
MSESS(H, O, O)−MSESS(R, O, O)
1−MSESS(R, O, O) , (6)
Hence, MSESS depends on the conditional bias, as well as on the correlation. It is smaller than the correlation in the case that there is a conditional bias, for which the optimal value is 0. CB depends on the balance between correlation and the ratio of the standard deviation between the ensemble and the observation. The improvement or added value of CB is calculated according to Kadow et al. (2015) as
CBAV=
rref,obs− Sref SO −
rhind,obs− Shind SO . (7)
The correlation or ACC (anomaly correlation coefficient; e.g. Wilks, 2011) is computed as the Pearson correlation be-tween the ensemble mean of the hindcasts at a certain loca-tioniand the corresponding observations (Obs):
ACCi= 1 N
P
t HtOt
SHSO
, (8)
where t=1, . . . ,N is the time index. The ACC quantifies the accuracy of the predictions only in terms of the tempo-ral course, while it is independent from the variance of the target variable and from the mean bias. To compare the per-formance of the hindcasts and of the uninitialized historical runs, we compute the difference of the ACC of the hindcasts minus the ACC of the historical runs for several issues (here-after delta_ACC).
The significance of the skill scores is determined by using a bootstrapping approach at the 95 % level (Kadow et al., 2015) and attest of the respective distributions.
4 Results
4.1 Is there a potential for skilful regional decadal predictions in Europe?
In this section, we address the first key question and anal-yse the general potential for skilful regional decadal predic-tions over Europe. Figure 2 shows MSESS plots for tempera-ture, precipitation, and surface wind speed in CCLM_b0 and CCLM_b1 with the climatology as reference. Not surpris-ingly, the MSESS is positive for most of Europe for temper-ature. It is significant for most regions in western Europe in CCLM_b0 and large parts of southern Europe in CCLM_b1 (Fig. 2a and b). This is due to the strong positive trend in the observed temperature, which is predicted by the hindcasts but not captured by the climatology. Deviations between both ensembles are larger for precipitation (Fig. 2c and d), where the MSESS fields are distinctly patchier when compared to temperature (Fig. 2a and b). While positive and significant skill scores are found over large parts of western Europe in CCLM_b1 (Fig. 2d), MSESS values are mostly negative over this region in CCLM_b0 (Fig. 2c). For wind speed (Fig. 2e and f), a positive MSESS is found only for northern Europe and CCLM_b0, where skill scores are often significant. As at
the same time negative skill scores are found for other Euro-pean regions in both ensembles, the climatology is generally closer to the observations than the hindcasts. In this respect, we have analysed the respective spatial mean wind speed time series for the Iberian Peninsula (Prudence region 2) and CCLM_b0. The wind speed shows a slight negative trend in CCLM_b0, while the trend is slightly positive for the obser-vational dataset (not shown). At the same time, the decadal variability for wind speed is quite small over this region in all datasets (it ranges from 0.02 to−0.02 in CCLM_b0 and E-OBS). Hence, the deviation of the climatology from the observations, and thus its MSE, is generally small in this re-gion, resulting in a negative MSESS when using the clima-tology as reference (see also Eq. 3 for MSESS in Sect. 3.2).
A different picture is revealed when using the uninitialized historical runs as reference dataset for the MSESS computa-tion (Fig. 3). For temperature (Fig. 3a and b), positive skill scores are found in both ensembles over Scandinavia and for southeastern Europe, and at some grid points this prediction skill is significant. A stripe of negative values occurs over the British Isles and central Europe. The analysis of the time se-ries for Mid-Europe (spatial mean over Prudence region 4) reveals that this negative skill mainly results from a strong temperature increase from dec1960 to dec1970 in the obser-vations, while CCLM_b0 and CCLM_b1 depict a decrease in temperature (not shown), which in fact was observed in southern Europe for instance. As a consequence, the temper-ature in the hindcasts has larger deviations than the unini-tialized simulations compared to the observations during the first half of the considered period, but agree well to the ob-servations from dec1980 onwards. The largest deviations be-tween CCLM_b0 and CCLM_b1 are found for Iberia, parts of southern France, and Italy, where the MSESS is positive for CCLM_b1 but neutral to negative for CCLM_b0.
Again, deviations in the MSESS fields between both en-sembles are larger for precipitation (Fig. 3c and d), reflecting the local character of rainfall. Both ensembles show positive and partly significant MSESS values for regions in Scandi-navia and eastern Europe, and to a lesser extent for Iberia and the British Isles (Fig. 3c and d). In CCLM_b1, predictive skill is also identified over western central Europe. Thus for CCLM_b1 positive skill is found for larger areas indicating an added value of the improved initialization procedure in baseline1 compared to baseline0.
in-Figure 2.Spatial distribution of the MSESS for the multi-annual mean anomalies of lead years 1–5 for(a)temperature in CCLM_b0,
(b)temperature in CCLM_b1,(c)precipitation in CCLM_b0,(d)precipitation in CCLM_b1,(e)wind speed in CCLM_b0, and(f)wind speed in CCLM_b1. As reference dataset we have used the climatology. The black dots indicate significant skill at the 95 % level (bootstrapping).
dicating that the changes in the initialization method do not improve the results for wind speed.
We conclude that in terms of the MSESS accuracy there generally is a potential for skilful decadal predictions over Europe in the regional MiKlip ensembles. However, the skill pattern depends on the region and the variable. For individual regions, the initialization leads to an added value for accurate (retrospective) forecasts several years ahead, while for some
Figure 3.Spatial distribution of the MSESS for the multi-annual mean anomalies of lead years 1–5 for(a)temperature in CCLM_b0,
(b)temperature in CCLM_b1,(c)precipitation in CCLM_b0,(d)precipitation in CCLM_b1,(e)wind speed in CCLM_b0, and(f)wind speed in CCLM_b1. As reference dataset we have used the uninitialized historical ensemble. The black dots indicate significant skill at the 95 % level (bootstrapping).
4.2 Does regional downscaling provide an added value for decadal predictions?
Recent studies document that the application of regional cli-mate models may improve clicli-mate simulations, in particu-lar over complex terrain (Berg et al., 2013; Feldmann et al., 2013; Hackenbruch et al., 2016). This is mainly due to a more realistic representation of the topography (e.g.
Figure 4.Spatial distribution of the MSESS for the multi-annual mean anomalies of lead years 1–5 for(a)temperature in CCLM_b0,
(b)temperature in CCLM_b1,(c)precipitation in CCLM_b0,(d)precipitation in CCLM_b1,(e)wind speed in CCLM_b0, and(f)wind speed in CCLM_b1. As reference dataset we have used the respective global MPI data. The black dots indicate significant skill at the 95 % level (bootstrapping).
Generally, significant improvements in the prediction skill by dynamical downscaling are restricted to limited geograph-ical areas, and they strongly depend on the variable. For tem-perature a significant added value of downscaling is found over Scandinavia and southeast Europe in CCLM_b0, and over southeast Europe and the British Isles in CCLM_b1 (Fig. 4a and b). Therefore, the regionalization typically
re-Table 1.MSESS, ACC, and conditional bias (CB) for the CCLM ensembles (left half) and added value compared to the global MPI ensembles (right half) for b0 (upper half) and b1 (lower half) for temperature averaged over the eight Prudence regions (cf. Fig. 1) and the whole of Europe (EU). In the left half, bold (italic) numbers represent MSESS values above+0.3 (below −0.3), ACC values above+0.4 (below−0.4), and CB values between±0.2 are marked in bold and beyond ±0.3 in italic. In the right half, bold (italic) numbers corresponds to a distinct improvement (deterioration) by dynamical downscaling using a common threshold of±0.05.
Temp Skill Added value
b0 MSESS ACC CB MSESS ACC CB
BI 0.75 0.90 0.15 −0.04 −0.02 −0.02 FR 0.66 0.89 0.34 –0.12 –0.05 −0.04
ME 0.56 0.80 0.23 –0.11 –0.05 –0.05
AL 0.57 0.82 0.10 –0.05 −0.04 0.02
IP 0.50 0.76 0.22 0.01 0.03 –0.08
MD 0.42 0.75 –0.04 0.01 −0.02 0.05
EA 0.45 0.72 –0.16 0.05 0.00 0.11
SC 0.02 0.45 –0.36 0.20 0.07 0.16
EU 0.35 0.67 –0.09 0.05 0.01 0.09
Temp Skill Added value
b1 MSESS ACC CB MSESS ACC CB
BI 0.34 0.64 0.25 0.12 0.15 –0.07
FR 0.63 0.87 0.34 −0.03 −0.01 −0.01 ME 0.51 0.75 0.19 −0.03 −0.02 −0.02 AL 0.68 0.89 0.04 −0.03 −0.01 0.06
IP 0.62 0.83 0.20 −0.01 0.01 −0.03 MD 0.52 0.82 –0.09 0.08 −0.01 0.07
EA 0.37 0.66 –0.20 0.05 −0.04 0.15
SC 0.24 0.56 –0.18 −0.03 −0.03 –0.09
EU 0.40 0.69 –0.05 0.01 −0.01 0.01
gional model over large parts of northwest Europe in the baseline0 ensemble (see also Table 1).
Again, rather patchy MSESS fields are obtained for pre-cipitation. Nevertheless, there are several regions with sig-nificantly improved prediction skills in the CCLM ensembles compared to MPI_b0 and MPI_b1 (Fig. 4c and d). For exam-ple, both CCLM_b0 and CCLM_b1 reveal significant posi-tive MSESS over eastern Germany and over parts of Scandi-navia.
The added value of downscaling is most pronounced for wind in CCLM_b0 (Fig. 4e). Significant improvements of the MSESS are detected for southeast Europe, Italy, Scandi-navia, and for coastal areas of Iberia, France, and England. Areas with an added value of downscaling are also exis-tent in CCLM_b1 (Fig. 4f), but visibly reduced compared to CCLM_b0.
In Tables 1–3 we summarize the analysis of skill (cf. Fig. 2) and added value (cf. Fig. 4) of the regional hind-casts compared to the climatology for the three variables as spatial means over the PRUDENCE regions (cf. Fig. 1). The tables display the MSESS as well as its components
correla-Table 2.As Table 1, but for precipitation.
Prec Skill Added value
b0 MSESS ACC CB MSESS ACC CB
BI –0.17 –0.04 –0.39 –0.09 –0.09 –0.13
FR –0.64 –0.55 –0.87 0.07 0.09 0.01
ME –0.49 –0.31 –0.72 0.18 0.26 0.18
AL –0.27 –0.10 –0.46 –0.14 −0.04 –0.19
IP 0.12 0.41 0.06 0.05 0.17 0.12
MD –0.08 0.20 −0.25 –0.13 –0.07 –0.16
EA –0.28 0.02 –0.45 –0.05 –0.09 –0.05
SC –0.06 0.16 −0.27 0.02 −0.01 0.05
EU –0.17 0.06 –0.35 0.00 0.01 0.01
Prec Skill Added value
b1 MSESS ACC CB MSESS ACC CB
BI 0.07 0.21 –0.04 0.01 0.01 −0.01 FR 0.21 0.51 –0.04 0.04 0.05 −0.02
ME 0.20 0.54 0.01 0.16 0.20 0.01
AL –0.01 0.19 –0.11 –0.06 –0.05 –0.11
IP –0.09 0.12 –0.20 –0.15 –0.13 –0.16
MD 0.05 0.29 –0.13 0.03 0.03 −0.02 EA –0.11 0.05 –0.32 0.05 −0.01 0.03 SC 0.06 0.41 –0.17 0.00 0.05 0.04 EU 0.03 0.28 –0.16 0.02 0.02 0.00
Table 3.As Table 1, but for wind speed.
Wind Skill Added value
b0 MSESS ACC CB MSESS ACC CB
BI 0.21 0.50 0.19 0.23 0.09 –0.12
FR –0.77 –0.63 –0.88 0.09 −0.04 0.06
ME –0.22 –0.04 –0.34 0.23 0.13 0.23
AL –0.69 –0.45 –0.81 0.07 0.06 0.03
IP –0.36 –0.08 –0.52 0.26 0.17 0.18
MD 0.06 0.38 –0.10 0.12 0.02 0.18
EA –0.46 –0.21 –0.59 0.36 0.10 0.31
SC 0.19 0.50 0.17 0.16 0.09 0.02
EU –0.11 0.16 –0.20 0.15 0.07 0.21
Wind Skill Added value
b1 MSESS ACC CB MSESS ACC CB
BI –0.35 –0.57 –0.80 0.02 –0.09 −0.01 FR –0.01 0.28 −0.22 0.00 0.07 –0.05
ME –0.12 –0.06 –0.38 –0.24 –0.41 –0.29
AL –0.14 0.32 –0.30 –0.30 –0.13 –0.22
IP 0.05 0.29 –0.17 0.19 0.21 0.18
MD 0.07 0.41 –0.06 0.02 0.05 −0.03 EA –0.38 –0.23 –0.69 –0.09 –0.07 –0.21
SC –0.37 –0.34 –0.67 0.06 –0.05 0.02
EU –0.23 –0.11 –0.50 0.00 −0.02 −0.04
chosen in a way that above this level a skill score is regarded as significant by the bootstrapping procedure. The thresholds for the formatting are above (bold) or below (italic)±0.3 for the MSESS, and±0.4 for ACC. Since the optimal value for the conditional bias is zero, a low CB is depicted for the ab-solute value, |CB|, being below 0.2 (bold), and a high CB for |CB| being larger than 0.3 (italic). The formatting for the added value in the right half of the tables corresponds to the sign of the skill difference (dynamical downscaled minus global MPI; bold: distinctly positive; italic: distinctly nega-tive) in a region. The threshold is 5 % (±0.05) and chosen in an analogous way to the left half of the tables.
For temperature (Table 1), the MSESS and ACC are high in all regions except Scandinavia (SC). The correlation is above 0.8 in CCLM_b0 for the northwestern part of Eu-rope – namely the British Isles (BI), France (FR), Mid-Europe (ME), and the Alps (AL). For CCLM_b1 the high-est correlation is found more in the southern part of the re-gion, namely in France (FR), the Iberian Peninsula (IP), the Alps (AL), and the Mediterranean (MD). The CB is low for most areas, except France (FR) and Scandinavia (SC) in CCLM_b0. The MSESS is high due to the high ACC and the low CB. MSESS and ACC are higher and CB lower for b1 than for b0 over the whole of Europe (EU). A signif-icant added value of the regionalization of baseline0 occurs for Scandinavia (SC) and Eastern Europe (EA) as well as for Europe (EU). In these regions CB is significantly lower for CCLM compared to the MPI-ESM hindcasts. CCLM_b1 shows an added value for the regions British Isles (BI), the Mediterranean (MD) and Eastern Europe (EA) as well as over the entire domain (EU). The main cause is again a re-duced conditional bias.
The MSESS for precipitation (Table 2) is much lower than for temperature. It is mostly negative for CCLM_b0 and only slightly positive for some regions in CCLM_b1. For CCLM_b0 a significant positive correlation is only found for the Iberian Peninsula (IP). The CB is generally negative (ex-cept for IP), which is inherited from the global hindcasts, since for MPI_b0 CB is even lower than for CCLM_b0. Over the whole domain the added value is low and not significant. For CCLM_b1, a positive ACC is uncovered for France (FR), Mid-Europe (ME) and Scandinavia (SC). The conditional bias is much lower than for CCLM_b0 and only slightly neg-ative in most areas. An added value in relation to MPI_b1 occurs in those regions where ACC of CCLM_b1 is positive. There is also an added value for the whole domain (EU), but it is only significant for ACC.
The highest ACC for the 10 m wind speed is revealed for northern Europe (BI and SC) as well as in the Mediter-ranean (MD) for CCLM_b0, and in the southern regions for CCLM_b1 (Table 3). These are all regions with low to mod-erate conditional bias. CB is strongly negative in regions with a low skill. Interestingly, the added value for the MSESS of CCLM_b0 is significant in all regions, and for most regions a significant improvement is also visible with respect to ACC
and CB. For CCLM_b1, on the other hand, significant im-provements of MSESS and ACC compared to MPI_b1 are only found for a few regions.
We conclude that regional downscaling may indeed pro-vide an added value for decadal predictions over Europe, both for individual grid points as well as for spatial means. However, this added value is not systematic but depends on variable and region.
4.3 How does the regional decadal predictive skill depend on the ensemble size?
Past studies suggest that the ensemble size of a predic-tion system has an impact on the forecast skill of a model (Richardson, 2001; Ferro et al., 2008). Generally, there is a consensus that the prediction skill for both seasonal and decadal predictions is enhanced when the number of ensem-ble members is increased. Kadow et al. (2015) analysed the global MiKlip baseline1 generation and concluded that the forecast accuracy for surface temperature for lead years 1 and 2–9 is improved for nearly the whole globe when the ensemble size is increased from 3 to 10 members. This is in line with the findings of Sienz et al. (2016) who examined the prediction skill for North Atlantic sea surface tempera-tures in the same hindcast ensemble. Also for seasonal pre-dictions of the North Atlantic Oscillation a forecast system profits from increasing size (e.g. Scaife et al., 2014). How-ever, the ensemble-size-dependent skill bias has never been demonstrated based on regional decadal climate predictions before. With this aim, we analyse the impact of the ensem-ble size on the predictive skill for the eight PRUDENCE re-gions in Europe in both the regional and the global MiK-lip ensembles. In the following, results are only shown for the Iberian Peninsula (IP), as the findings are similar for the other PRUDENCE regions. Figure 5 exhibits the dependency of MSESS and delta_ACC when compared to the histori-cal simulations for lead years 1–5 (y axis) on the ensem-ble size (x axis) for all three variables spatially averaged over IP. For each ensemble size n (n varying between 2 and 10), the solid coloured lines depict the averaged skill scores for all permutations of n-member ensemble combi-nations for each of the four individual hindcast ensembles (MPI_b0, MPI_b1, CCLM_b0, and CCLM_b1). Note that for the reference dataset always the full ensemble of 10 mem-bers of the uninitialized historical runs is used, independently of the ensemble size of the initialized hindcasts.
Figure 5.Skill scores for the multi-annual mean anomalies of lead years 1–5 of the CCLM_b0 (red), MPI_b0 (yellow), CCLM_b1 (blue), and MPI_b1 (green) ensembles depending on the ensemble size (xaxis, ranging from 2 to 10 members) over IP (cf. Fig. 1). MSESS for
(a)temperature,(b)precipitation, and(c)wind speed; delta_ACC for(d)temperature,(e)precipitation, and(f)wind speed. In(d)–(f)box and whisker plots for the skill scores of alln-member combinations are shown to indicate the uncertainty due to the ensemble size. For MSESS and delta_ACC we have used the uninitialized historical ensemble as reference dataset. Note the different scaling of theyaxis. For details, please refer to the main text.
variables over all eight PRUDENCE regions (not shown), re-gardless of whether the skill scores are negative or positive. In some cases, the ensemble size increase even leads to a shift from negative MSESS values to positive values in one or more of the ensembles (e.g. Fig. 5a and c). In contrast, no systematic conclusion can be stated for the delta_ACC, as the ensemble size dependency of the predictive skill depends on the variable and the considered MiKlip ensemble (Fig. 5d–f). Nevertheless, there are also examples for delta_ACC where the ensemble size dependency is similar to that of MSESS, e.g. for temperature (Fig. 5d). These results suggest that a regional decadal prediction system generally benefits from larger ensemble sizes, either in terms of more skilful decadal forecasts or at least of a reduction of the bias or the uncer-tainty, depending on the variable and the hindcast generation. Note that for most variables and skill scores the hindcast gen-eration is more important for the skill than the resolution. In addition, most diagrams indicate an added value of down-scaling. For temperature and wind speed, both generations of CCLM surpass their MPI counterparts for both skill scores, indicating a systematic added value of downscaling. This is particularly visible for wind in the b0 ensemble, where the prediction skill of CCLM is distinctly better than for MPI-ESM-LR (Fig. 5c and f). This is mainly due to higher skill scores over orographic structured terrains of IP in CLM_b0 compared to MPI_b0 (cf. Fig. 4).
For ensembles with less than 10 members, the skill scores of all possible n-member ensemble combinations are av-eraged. For selected ensembles, box and whisker plots of thesen-member combinations are shown for delta_ACC in Fig. 5d–f. Given that we are doing permutations without re-placement, the spread between the individualn-member en-sembles declines with an increasing number of membersn, and this decline should therefore not be over-interpreted. Nevertheless, the spread is quite large not only for small ensemble sizes but also for ensembles with n >5. For in-stance, delta_ACC for wind in CCLM_b0 (MPI_b0) varies between 0 and+1.6 (−0.1 and+1.1) for the 2-member en-sembles (Fig. 5f). Even for the 7-member ensemble, results can differ quite strongly depending on the selection of the ensemble members. Similar results are found for temperature and precipitation. These findings clearly demonstrate the ne-cessity of using large ensembles to reduce uncertainties. Fur-thermore, only for high numbers of ensemble members (eight or more), the delta_ACC curve for CCLM_b0 is above the range of uncertainty in MPI_b0 in the case of precipitation (Fig. 5e) and wind (Fig. 5f). This indicates that the predic-tion skill may only be significantly improved when the whole ensemble is dynamically downscaled. The same applies for the improvement from baseline0 to baseline1 in the case of temperature (Fig. 5d).
predic-tive skill of a regional decadal prediction system is generally improved when the size of the hindcast ensembles increases. This is valid for all variables, regions, and hindcast ensem-bles considered in this study. The skill scores converge to-wards a certain value in most cases for MSESS in all hind-casts (see Fig. 5a–c). The increments in added value by in-creasing the number of ensemble members decrease for more than 5 members. Nevertheless, it is recommended to use 10 members or more for the skill assessment of decadal predic-tions on the regional scale, as is also endorsed in the Decadal Climate Prediction Project (DCPP) contribution to CMIP6 (Boer et al., 2016).
4.4 How does the number of initializations affect the skill estimates?
A lesson learned from the CMIP5 decadal experiments is that more starting years and thus a larger number of initializations is beneficial to establish robust skill estimates (Boer et al., 2016). This has been reflected in the progress from the first global MiKlip hindcast generation baseline0 to the second generation baseline1. Whereas baseline0 provides 10 ensem-ble members every fifth year (compliant with the CMIP5 ex-perimental protocol), baseline1 provides this ensemble size for each starting year of the hindcast period. To assess the impact of using only five initializations (as used elsewhere in the paper) on the robustness of our main conclusions we performed a sensitivity analysis with the global baseline1 en-semble, for which all starting years are available. For this, we compared the sample with ten-yearly starting dates with the full yearly initialized MPI-ESM-LR baseline1 ensemble over the same period from 1960 to 2000.
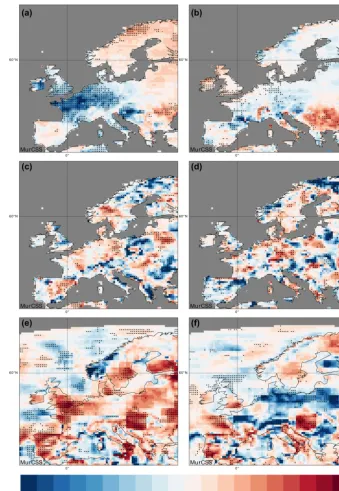
Figure 6 presents a comparison between the ACC scores for the sample with five initializations (Fig. 6a, c, e) and the sample with all 41 initializations (Fig. 6b, d, f). For all three variables the score maps show in general comparable spatial distributions. The skill maps for the sample with all initial-izations usually depict a smoother spatial distribution with less extreme skill values and larger areas with significant skill scores. The regional averages over most of the PRUDENCE regions are comparable. However, in some regions larger dif-ferences can occur: for temperature over Ireland and Scot-land, for precipitation over parts of France and eastern Eu-rope, and for wind from northeastern Spain towards the Alps. Similar results are found for MSESS (not shown) for which not only the number of initializations of MPI_b1 is increased but also the number of uninitialized historical runs.
It is obvious that more initializations increase the robust-ness of the skill assessment, especially with respect to quan-titative estimates and significance of the results. Therefore, this work supports the recommendations made for CMIP6 by Boer et al. (2016) to generate hindcast ensembles with yearly starting dates. Nevertheless, using only five initializations al-ready represents the general features and to some extent the significance of the regional distribution. Therefore, the
anal-ysis of the sample with all initializations confirms the quali-tative findings from Sect. 4.1. The results regarding the added value and the ensemble size dependence are less affected by the number of initializations. Given the above findings, we conclude that the results obtained here for a limited num-ber of initializations qualitatively comparable to those which would be obtained for samples with distinctly more initial-izations.
5 Summary and discussion
In this study, the decadal prediction skill of the regional MiK-lip decadal prediction system is analysed for temperature, precipitation, and wind speed over Europe and compared to the forecast skill of the global ensemble. The goal is to assess the prospect of such a system for the application in forecasts on decadal timescales. Focus is given to years 1–5 after ini-tialization. Two skill scores are used to quantify the accuracy of the two different MiKlip hindcast generations. The main findings of our study can be summarized as follows:
– There is a potential for regional decadal predictability over Europe for temperature, precipitation, and wind speed in the MiKlip system, but the predictive skill de-pends on the variable, the region, and the hindcast gen-eration.
– The MiKlip prediction system may distinctly benefit from regional downscaling. An added value in terms of accuracy and to some extend significance of skill is particularly revealed for temperature over the British Isles (BI), Scandinavia (SC), the Iberian Peninsula (IP); and for precipitation over the British Isles (BI), Scandi-navia (SC), Mid-Europe (ME), and France (FR) for the b1 generation. Most of these regions are characterized by complex coastlines and orography, which indicates that the better representation of topographic structures in the regionalized hindcasts may improve the predic-tive skill.
– The improvement of the initialization procedure from baseline0 to baseline1 as described in Pohlmann et al. (2013b) increases the overall predictive skill in the downscaled MiKlip hindcasts over Europe, at least for precipitation and temperature. However, improvement of the skill varies between variable and region. The skill for temperature increases around the Mediterranean Sea and parts of Scandinavia from b0 to b1. For precipita-tion the skill of b1 compared to b0 is higher in all re-gions except the Iberian Peninsula and eastern Europe. Only for wind speed is there mostly no benefit from the improved initialization.
Figure 6.Spatial distribution of the ACC for the multi-annual mean anomalies of lead years 1–5 in MPI_b1 for(a, b)temperature,(c, d) pre-cipitation, and (e, f)wind speed. For (a, c, e)five start years (dec1960, dec1970, dec1980, dec1990, dec2000) have been used, while for(b, d, f) all start years from dec1960 to dec2000 are taken into account. The black dots indicate significant skill at the 95 % level (bootstrapping). For more details see the main text.
MiKlip decadal predictions system, and 10 members is found to be suitable for regional decadal forecasts. This is valid for all variables and European regions.
– Based on the MPI_b1 data, it was shown that results derived from only five initializations used in this study qualitatively agree with results based on the full set of annual initializations. Nevertheless, such an increase
would improve the robustness and significance of the skill maps.
Penin-sula seem to be key European regions for decadal prediction skill with the regional prediction system. This is in line with findings from Guemas et al. (2015) and may be related to skilful predictions of the Atlantic Multi-decadal Oscillation (AMO; Garcia-Serrano et al., 2012; Guemas et al., 2015). Due to the rather non-linear relationship of these large-scale North Atlantic features to regional atmospheric conditions over Europe, the mechanisms steering the decadal variability and predictability of climate variables in European regions are thus more complex. The decadal variability in regional precipitation, temperature, and wind speed over most parts of Europe is largely affected by the North Atlantic Oscillation, but its skilful decadal predictability over the continent is still under debate. With respect to this, a better understanding of the mechanisms relevant for the regional climate over Europe on the decadal timescale is required, as was, for example, ob-tained for the tropical Atlantic (Dunstone et al., 2011). This is an objective of the ongoing second phase of the MiKlip project.
The skill scores may strongly vary between neighbouring grid points. Comparable results were found by Guemas et al. (2015), who detected a rather diffuse pattern for the ac-curacy of decadal predictions over Europe for seasonal tem-perature and precipitation. This might at least partly be due to spatial and temporal inhomogeneity of the gridded obser-vational references. A more realistic assessment of the pre-diction skill can be made by considering spatial means (God-dard et al., 2013), which was mostly considered in this study. In line with Kadow et al. (2015), we could show that an en-largement of the ensemble size up to 10 members results in an improvement of the prediction skill over Europe. How-ever, prediction skill could further benefit from even larger ensemble sizes, especially in areas with low signal-to-noise ratio (cf. Sienz et al., 2016).
Bias and drift adjustment (e.g. Boer et al., 2016) provides prospect in skill improvement not only for GCMs but also for RCMs. This is particularly the case for ensemble simu-lations run with full-field initialization (like the third MiK-lip generation prototype, not analysed here; cf. Marotzke et al., 2016). While bias and drift adjustment methods have im-proved the forecast skill of near-term climate prediction (e.g. Kruschke et al., 2016), the general expectation is that drift correction is less important for prediction systems employ-ing anomaly initializations like the baseline0 and baseline1 ensembles analysed here (Marotzke et al., 2016). Neverthe-less, bias correction and calibration are an important topic in the second phase of MiKlip.
Due to the high computational costs of dynamical down-scaling, only five initializations (one per decade) are avail-able for the regional MiKlip ensemble (see Sect. 2). This is a shortcoming regarding the statistical significance of the results and some of the statements presented in this study. However, we could show that the qualitative findings are only partly influenced by the limited number of available hind-casts and that the main conclusions can be regarded as
ro-bust. The statistical significance will be easier to quantify when the regional simulations for the newest MiKlip ensem-ble generation are availaensem-ble with annual starting dates over more than 50 years. On the other hand, regional decadal fore-casts may have advantages beyond the examples discussed in this paper. For example, RCMs enable the integration of improved components of the hydrological cycle or climate-system components with memory on multi-year timescales like soil moisture (Khodayar et al., 2014; Sein et al., 2015). Kothe et al. (2016) has shown that extracting the initial state of the deep soil in the RCMs from regional data assimilation schemes may improve decadal predictions. Further, Akhtar et al. (2017) demonstrated that the regional feedback between large water bodies and the atmosphere play a major in the re-gional climate system. This feedback can only be captured in regionalized climate predictions by a dynamic RCM–ocean coupling. Most of the approaches mentioned above are on-going within the second phase of MiKlip and are expected to enhance the decadal prediction skill over Europe. We thus conclude that a decadal prediction system would clearly ben-efit from a regional forecast ensemble.
The regional decadal prediction system generated by the MiKlip consortium comprises altogether 1000 years (two hindcast generations, each of them comprising 10 hindcast members for five starting years) of simulations with 0.22◦ for the entire EURO-CORDEX region, which is, to our best knowledge, unprecedented. Hence, this ensemble enabled us to gain important insights into different aspects and the prospects of regional downscaling for decadal predictions, and serve as a good basis for future studies. In the ongo-ing second phase of MiKlip it is planned to downscale a complete ensemble hindcast generation with 10 members for more than 50 starting years, giving altogether more than 5000 years. These regional hindcast ensembles provide a valuable dataset beyond decadal predictions, as they prise multiple realizations of the present-day climate in com-parably high resolution, which can for instance be used to determine more robust return periods for extreme events.
Data availability. The MiKlip data will be made available via the CERA database (http://cera-www.dkrz.de/, last access: June 2018) of the German Climate Computing Center (DKRZ).
Competing interests. The authors declare that they have no con-flict of interest.
Acknowledgements. MiKlip is funded by the German Fed-eral Ministry for Education and Research (BMBF, contracts: 01LP1518 A-D and 01LP1519) All simulations were carried out at the German Climate Computing Centre (DKRZ), which also pro-vided all major data services. We acknowledge the E-OBS dataset from the EU-FP6 project ENSEMBLES (http://ensembles-eu. metoffice.com, last access: September 2016) and the data providers in the ECA & D project (http://www.ecad.eu, last access: Septem-ber 2016). We thank the European Centre for Medium-Range Weather Forecasts (ECMWF) for their ERA-40 and ERA-Interim reanalysis data (http://apps.ecmwf.int/datasets/, last access: Decem-ber 2018). Joaquim G. Pinto thanks the AXA Research Fund for support. We thank past and present members of the MiKlip-C (Re-gionalization) group for discussions and comments, and Christo-pher Kadow and Sebastian Illing for providing the MiKlip Central Evaluation System (MiKlip CES). We thank the reviewers for their comments, which helped to improve the manuscript.
Review statement. This paper was edited by Andrey Gritsun and reviewed by three anonymous referees.
References
Akhtar, N., Brauch, J., and Ahrens, B.: Climate Modeling over the Mediterranean Sea: Impact of Resolution and Ocean Coupling, Clim. Dynam., 51, 933–948, https://doi.org/10.1007/s00382-017-3570-8, 2017.
Balmaseda, M. A., Mogensen, K., and Weaver, A. T.: Evaluation of the ECMWF ocean reanalysis system ORAS4, Q. J. Roy. Me-teorol. Soc., 139, 1132–1161, https://doi.org/10.1002/qj.2063, 2013.
Benestad, R. E. and Mezghani, A.: On downscaling probabilities for heavy 24-hour precipitation events at seasonal-to-decadal scales, Tellus A, 67, 25954, https://doi.org/10.3402/tellusa.v67.25954, 2015.
Berg, P., Wagner, S., Kunstmann, S., and Schaedler, G.: High reso-lution regional climate model simulations for Germany: part I – validation, Clim. Dynam., 40, 401–414, 2013.
Boer, G. J., Smith, D. M., Cassou, C., Doblas-Reyes, F., Danaba-soglu, G., Kirtman, B., Kushnir, Y., Kimoto, M., Meehl, G. A., Msadek, R., Mueller, W. A., Taylor, K. E., Zwiers, F., Rixen, M., Ruprich-Robert, Y., and Eade, R.: The Decadal Climate Predic-tion Project (DCPP) contribuPredic-tion to CMIP6, Geosci. Model Dev., 9, 3751–3777, https://doi.org/10.5194/gmd-9-3751-2016, 2016. Chikamoto Y., Kimoto, M., Ishii, M., Mochizuki, T., Sakamoto,
T. T., Tatebe, H., Komuro, Y., Watanabe, M., Nozawa, T., Shiogama, H., Mori, M., Yasunaka, S., and Imada, Y.: An overview of decadal climate predictability in a multi-model en-semble by climate model MIROC, Clim. Dynam., 40, 1201– 1222, https://doi.org/10.1007/s00382-012-1351-y, 2012. Christensen, J. H. and Christensen, O. B.: A summary of the
PRUDENCE model projections of changes in European
cli-mate by the end of this century, Climatic Change, 81, 7–30, https://doi.org/10.1007/s10584-006-9210-7, 2007.
Corti S., Palmer, T., Balmaseda, M., Weisheimer, A., Drijfhout, S., Dunstone, N., Hazeleger, W., Kröger, J., Pohlmann, H., Smith, D., von Storch, J.-S., and Wouters, B.: Impact of Ini-tial Conditions versus External Forcing in Decadal Climate Pre-dictions: A Sensitivity Experiment, J. Climate, 28, 4454–4470, https://doi.org/10.1175/JCLI-D-14-00671.1, 2015.
Dee, D. P., Uppala, S. M., Simmons, A. J., Berrisford, P., Poli, P., Kobayashi, S., Andrae, U., Balmaseda, M. A., Balsamo, G., Bauer, P., Bechtold, P., Beljaars, A. C. M., van de Berg, L., Bid-lot, J.,Bormann, N., Delsol, C., Dragani, R., Fuentes, M., Geer, A. J., Haimberger, L., Healy, S. B., Hersbach, H., Holm, E. V., Isaksen, L., Kallberg, P., Köhler, M., Matricardi, M., McNally, A. P., Monge-Sanz, B. M., Morcrette, J.-J., Park, B.-K., Peubey, C., de Rosnay, P., Tavolato, C., Thepaut, J.-N., and Vitart, F.: The ERA-Interim reanalysis: configuration and performance of the data assimilation system, Q. J. Roy. Meteorol. Soc., 137, 553– 597, https://doi.org/10.1002/qj.828, 2011.
Doblas-Reyes, F. J., Andreu-Burillo, I., Chikamoto, Y., García-Serrano, J., Guemas, V., Kimoto, M., Mochizuki, T., Rodrigues, L. R. L., and van Oldenborgh, G. J.: Initialized near-term regional climate change prediction, Nat. Commun., 4, 1715, https://doi.org/10.1038/ncomms2704, 2013.
Dunstone, N. J., Smith, D. M., and Eade, R.: Multi-year predictabil-ityof the tropical Atlantic atmosphere driven by the high lat-itude North Atlantic Ocean, Geophys. Res. Lett., 38, L14701, https://doi.org/10.1029/2011GL047949, 2011.
Eade, R., Hamilton, E., Smith, D. M., Graham, R. J., and Scaife, A. A.: Forecasting the number of extreme daily events out to a decade ahead, J. Geophys. Res., 117, D21110, https://doi.org/10.1029/2012JD018015, 2012.
Feldmann, H., Schaedler, G., Panitz, H.-J., and Kottmeier, C.: Near future changes of extreme precipitation over complex terrain in Central Europe derived from high resolution RCM ensemble simulations, Int. J. Climatol., 33, 1964–1977, 2013.
Ferro, C. A. T., Richardson, D. S., and Weigel, A. P.: On the effect of ensemble size on the discrete and continu-ous ranked probability scores, Meteorol. Appl., 15, 19–24, https://doi.org/10.1002/met.45, 2008.
Garcia-Serrano, J., Doblas-Reyes, F. J., and Coelho, C. A. S.: Understanding Atlantic multi-decadal variabil-ity prediction skill, Geophys. Res. Lett., 39, L18708, https://doi.org/10.1029/2012GL053283, 2012.
Giorgetta, M. A., Jungclaus, J. J., Reick, C. H., Legutke, S., Bader, J., Böttinger, M. and Brovkin, V., Crueger, T., Esch, M., Fieg, K., Glushak, K., Gayler, V., Haak., H., Hollweg, H.-D., Ilyina, T., Kinne, S., Kornblueh, L., Matei, D., Mauritsen, T., Mikolajew-icz., U., Mueller, W. A., Notz, D., Pithan, F., Raddatz, T., Rast, S., Redler, R., Roeckner, E., Schmidt, H., Schnur, R., Segschnei-der, J., Six, K. D., Stockhause, M., Timmreck, C., Wegner, J., Widmann, H., Wieners, K.-H., Claussen, M., Marotzke, J., and Stevens, B.: Climate and carbon cycle changes from 1850 to 2100 in MPI-ESM simulations for the Coupled Model Inter-comparison Project phase 5, J. Adv. Model. Earth Syst., 5, 572– 597, https://doi.org/10.1002/jame.20038, 2013.
Goddard, L., Kumar, A., Solomon, A., Smith, D., Boer, G., Gonzalez, P., Kharin, V., Merryfield, W., Deser, C., Ma-son, S. J., Kirtman, B. P., Msadek, R., Sutton, R., Hawkins, E., Fricker, T., Hegerl, G., Ferro, C. A. T., Stephenson, D. B., Meehl, G. A., Stockdale, T., Burgman, R., Greene, A. M., Kushnir, Y., Newman, M., Carton, J., Fukumori, I., and Delworth, T.: A verification framework for interannual-to-decadal predictions experiments, Clim. Dynam., 40, 245–272, https://doi.org/10.1007/s00382-012-1481-2, 2013.
Guemas V., García-Serrano, J., Mariotti, A., Doblas-Reyes, F., and Caron, L.-P.: Prospects for decadal climate prediction in the Mediterranean region, Q. J. Roy. Meteorol. Soc., 141, 580–597, https://doi.org/10.1002/qj.2379, 2015.
Hackenbruch, J., Schaedler, G., and Schipper, J. W.: Added value of high-resolution regional climate simulations for regional impact studies, Meteorol. Z., 25, 291–304, https://doi.org/10.1127/metz/2016/0701, 2016.
Haas, R., Reyers, M., and Pinto, J. G.: Decadal pre-dictability of regional-scale peak winds over Europe based on MPI-ESM-LR, Meteorol. Z., 25, 739–752, https://doi.org/10.1127/metz/2015/0583, 2016.
Haylock, M. R., Hofstra, N., Klein Tank, A. M. G., Klok, E. J., Jones, P. D., and New, M.: A European daily high-resolution gridded data set of surface temperature and pre-cipitation for 1950–2006, J. Geophys. Res., 113, D20119, https://doi.org/10.1029/2008JD010201, 2008.
Ho, C. K., Hawkins, E., Shaffrey, L., Bröcker, J., Hermanson, L., Murphy, J. M., Smith, D. M., and Eade, R.: Examining reliabil-ity of seasonal to decadal sea surface temperature forecasts: The role of ensemble dispersion, Geophys. Res. Lett., 40, 5770–5775, https://doi.org/10.1002/2013GL057630, 2013.
Jungclaus, J. H., Fischer, N., Haak, H., Lohmann, K., Marotzke, J., Matei, D., Mikolajewicz, U., Notz, D., and von Storch, J.-S.: Characteristics of the ocean simulations in MPIOM, the ocean component of the MPI-Earth system model, J. Adv. Model. Earth Syst., 5, 422–446, https://doi.org/10.1002/jame.20023, 2013. Kadow, C., Illing, S., Kunst, O., Rust, H. W., Pohlmann, H., Müller,
W. A., and Cubasch, U.: Evaluation of forecasts by accuracy and spread in the MiKlip decadal climate prediction system, Mete-orol. Z., 25, 631–643, https://doi.org/10.1127/metz/2015/0639, 2015.
Kalnay, E., Kanamitsu, M., Kistler, R., Collins, W., Deaven, D., Gandin, L., Iredell, M., Saha, S., White, G., Woollen, J., Zhu, Y., Leetmaa, A., Reynolds, R., Chelliah, M., Ebisuzaki, W., Higgins, W., Janowiak, J., Mo, K. C., Ropelewski, C. Wang, J., Jenne, R., and Joseph, D.: The NCEP/NCAR 40-Year Reanalysis Project, B. Am. Meteorol. Soc., 77, 437–471, https://doi.org/10.1175/1520-0477(1996)077<0437:TNYRP>2.0.CO;2, 1996.
Khodayar, S., Selinger, A., Feldmann, H., and Kottmeier, C.: Sensi-tivity of soil moisture initialization for decadal predictions under different regional climatic conditions in Europe, Int. J. Climatol., 35, 1899–1915, https://doi.org/10.1002/joc.4096, 2014. Kothe, S., Tödter, J., and Ahrens, B.: Strategies for soil initialisation
in regional decadal climate predictions, Meteorol. Z., 25, 775– 794, https://doi.org/10.1127/metz/2016/0729, 2016.
Kröger, J., Müller, W. A., and von Storch, J.-S.: Impact of different ocean reanalyses on decadal climate prediction, Clim. Dynam., 39, 795–810, https://doi.org/10.1007/s00382-012-1310-7, 2012.
Kruschke, T., Rust, H. W., Kadow, C., Leckebusch, G. C., and Ulbrich, U.: Evaluating decadal predictions of north-ern hemispheric cyclone frequencies, Tellus A, 66, 22830, https://doi.org/10.3402/tellusa.v66.22830, 2014.
Kruschke, T., Rust, H. W., Kadow, C., Müller, W. A., Pohlmann, H., Leckebusch, G. C., and Ulbrich, U.: Proba-bilistic evaluation of decadal prediction skill regarding North-ern Hemisphere winter storms, Meteorol. Z., 25, 721–738, https://doi.org/10.1127/metz/2015/0641, 2016.
Li, H., Ilyina, T., Müller, W. A., and Sienz, F.: Decadal predic-tions of the North Atlantic CO2uptake, Nat. Commun., 7, 11076, https://doi.org/10.1038/ncomms11076, 2016.
Marotzke J., Müller, W. A., Vamborg, F. S. E., Becker, P., Cubasch, U., Feldmann, H., Kaspar, F., Kottmeier, C., Marini, C., Polkova, I., Prömmel, K., Rust, H. W., Rust, H. W., Stammer, D., Ul-brich, U., Kadow, C., Köhl, A., Kröger, J., Kruschke, T., Pinto, J. G., Pohlmann, H., Reyers, M., Schröder, M., Sienz, F., Timm-reck, C., and Ziese, M.: MiKlip – a National Research Project on Decadal Climate Prediction, B. Am. Meteorol. Soc., 97, 2379– 2393, https://doi.org/10.1175/BAMS-D-15-00184.1, 2016. Matei, D., Pohlmann, H., Jungclaus, J. H., Müller, W. A., Haak, H.,
and Marotzke, J.: Two tales of initializing decadal climate predic-tion experiments with the ECHAM5/MPI-OM model, J. Climate, 8502–8523, https://doi.org/10.1175/JCLI-D-11-00633.1, 2012. Meehl, G. A., Goddard, L., Murphy, J., Stouffer, R. J.,
Boer, G., Danabasoglu, G., Dixon, K., Giorgetta, M. A., Greene, A. M., Hawkins, E., Hegerl, G., Karoly, D., Keenly-side, N. S., Kimoto, M., Kirtman, B., Navarra, A., Pul-warty, R., Smith, D., Stammer, D., and Stockdale, T.: Decadal Prediction, B. Am. Meteorol. Soc., 90, 1467–1485, https://doi.org/10.1175/2009BAMS2778.1, 2009.
Meehl, G. A., Goddard, L., Boer, G., Burgman, R., Branstator, G., Cassou, C., Corti S., Danabasoglu, G., Doblas-Reyes, F., Hawkins, E., Karspeck, A., Kimoto, M., Kumar, A., Matei, D., Mignot, J., Msadek, R., Navarra, A., Pohlmann, H., Rienecker, M., Rosati, T., Schneider, E., Smith, D., Sutton, R., Teng, H., van Oldenborgh, G. J., Vecchi, G., and Yeager, S.: Decadal Cli-mate Prediction: An Update from the Trenches, B. Am. Me-teorol. Soc., 95, 243–267, https://doi.org/10.1175/BAMS-D-12-00241.1, 2014.
Mieruch, S., Feldmann, H., Schädler, G., Lenz, C.-J., Kothe, S., and Kottmeier, C.: The regional MiKlip decadal forecast ensemble for Europe: the added value of downscaling, Geosci. Model Dev., 7, 2983–2999, https://doi.org/10.5194/gmd-7-2983-2014, 2014. Moemken, J., Reyers, M., Buldmann, B., and Pinto, J. G.:
Decadal predictability of regional scale wind speed and wind energy potentials over Central Europe, Tellus A, 68, 29199, https://doi.org/10.3402/tellusa.v68.29199, 2016.
Müller, W. A., Baehr, J., Haak, H., Jungclaus, J. H., Kröger, J., Matei, D., Notz, D., Pohlmann, H., von Storch, J.-S., and Marotzke, J.: Forecast skill of multi-year seasonal means in the decadal prediction system of the Max Planck In-stitute for Meteorology, Geophys. Res. Lett., 39, L22707, https://doi.org/10.1029/2012GL053326, 2012.
Pohlmann, H., Smith, D. M., Balmaseda, M. A., Keenlyside, N. S., Masina, S., Matei, D., Müller, W. A., and P. Rogel, P.: Pre-dictability of the mid-latitude Atlantic meridional overturning circulation in a multi-model system, Clim. Dynam., 41, 775–785, https://doi.org/10.1007/s00382-013-1663-6, 2013a.
Pohlmann, H., Müller, W. A., Kulkarni, K., Kameswarrao, M., Matei, D., Vamborg, F. S. E., Kadow, C., Illing, S., and Marotzke, J.: Improved forecast skill in the tropics in the new MiKlip decadal climate predictions, Geophys. Res. Lett., 40, 5798–5802, https://doi.org/10.1002/2013GL058051, 2013b.
Richardson, D. S.: Measures of skill and value of ensemble pre-dictions systems, their interrelationship and the effect of en-semble size, Q. J. Roy. Meteorol. Soc., 1277, 2473–2489, https://doi.org/10.1002/qj.49712757715, 2001.
Robson, J., Sutton, R., and Smith, D.: Predictable climate impacts of the decadal changes in the ocean in the 1990s, J. Climate, 26, 6329–6339, https://doi.org/10.1175/JCLI-D-12-00827.1, 2013. Rockel, B., Will, A., and Hense, A.: The Regional Climate
Model COSMO-CLM (CCLM), Meteorol. Z., 17, 347–348, https://doi.org/10.1127/0941-2948/2008/0309, 2008.
Scaife, A. A., Arribas, A., Blockley, E., Brookshaw, A., Clark, R. T., Dunstone, N., Eade, R., Fereday, D., Folland, C. K., Gordon, M., Hermanson, L., Knight, J. R., Lea, D. J., MacLachlan, C., Maid-ens, A., Martin, M., Peterson, A. K., Smith, D., Vellinga, M., Wallace, E., Waters, J., and Williams, A.: Skillful long-range pre-diction of European and North American Winters, Geophys. Res. Lett., 41, 2514–2519, https://doi.org/10.1002/2014GL059637, 2014.
Sein, D. V., Mikolajewicz, U., Gröger, M., Fast, I., Cabos, W., Pinto, J. G., Hagemann, S., Semmler, T., Izquierdo, A., and Jacob, D.: Regionally coupled atmosphere–ocean– sea ice–marine biogeochemistry model ROM: 1. Descrip-tion and validaDescrip-tion, J. Adv. Model. Earth Syst., 7, 268–304, https://doi.org/10.1002/2014MS000357, 2015.
Sienz, F., Müller, W. A., and Pohlmann, H.: Ensemble size impact on the decadal predictive skill assessment, Meteorol. Z., 25, 645– 655, 2016.
Smith, D. M., Scaife, A. A., and Kirtman, B. P.: What is the current state of scientific knowledge with regard to sea-sonal and decadal forecasting?, Environ. Res. Lett., 5, 015602, https://doi.org/10.1088/1748-9326/7/1/015602, 2012.
Stevens, B., Giorgetta, M. A., Esch, M., Mauritsen, T., Crueger, T., Rast, S., Salzmann, M., Schmidt, H., Bader, J., Block, K., Brokopf, R., Fast, I., Kinne, S., Kornblueh, L., Lohmann, U., Pin-cus, R., Reichler, T., and Roeckner, E.: Atmospheric component of the MPI-M Earth System Model: ECHAM6, J. Adv. Model. Earth Syst., 5, 146–172, https://doi.org/10.1002/jame.20015, 2013.
Taylor, K. E., Stouffer, R. J., and Meehl, G. A.: An Overview of CMIP5 and the Experiment Design, B. Am. Meteorol. Soc., 93, 485–498, https://doi.org/10.1175/BAMS-D-11-00094.1, 2012. Uppala, S. M., KÅllberg, P. W., Simmons, A. J., Andrae, U.,
Bech-told, V. D. C., Fiorino, M., Gibson, J. K., Haseler, J., Hernan-dez, A., Kelly, G. A., Li, X., Onogi, K., Saarinen, S., Sokka, N., Allan, R. P., Andersson, E., Arpe, K., Balmaseda, M. A., Beljaars, A. C. M., Van De Berg, L., Bidlot, J., Bormann, N., Caires, S., Chevallier, F., Dethof, A., Dragosavac, M., Fisher, M., Fuentes, M., Hagemann, S., Hólm, E., Hoskins, B. J., Isaksen, L., Janssen, P. A. E. M., Jenne, R., Mcnally, A. P., Mahfouf, J.-F., Morcrette, J.-J., Rayner, N. A., Saunders, R. W., Simon, P., Sterl, A., Trenberth, K. E., Untch, A., Vasiljevic, D., Viterbo, P., and Woollen, J.: The ERA-40 re-analysis, Q. J. Roy. Meteorol. Soc., 131, 2961–3012, https://doi.org/10.1256/qj.04.176, 2005. Wilks, D. S.: Statistical Methods in the Atmospheric Sciences,
3rd revised edition, Academic Press, Oxford, UK, 2011. Yeager, S., Karspeck, A., Danabasoglu, G., Tribbia, J., and Teng,