A NOVEL GRAPH MODEL FOR E-MAIL
FORENSICS: EVIDENCE ACTIVITY
ANALYSIS GRAPH
Sridhar NerallaResearch Scholar,
Dept.of CS&SE, Andhra University, Visakhapatnam, Andhra Pradesh, India
D.Lalitha Bhaskari Associate Professor,
Dept.of CS&SE, Andhra University, Visakhapatnam, Andhra Pradesh, India
P.S.Avadhani Professor,
Dept.of CS&SE, Andhra University, Visakhapatnam, Andhra Pradesh, India
Abstract:
This work puts forward a novel technique for evidence analysis that assist cyber forensics expert for analyzing cyber crime episode in an effective manner. Novelty in Evidence Activity Analysis Graph is reflection of activities involved in the cyber crime that are represented as nodes along with stylometric analysis. In this piece of work email based cyber crime incident is considered for study and that incident is represented in Evidence Activity Analysis Graph to fix the suspect. Comparisons between various graphs that are used in cyber forensics were also discussed in this paper. This model establishes relationships between various activities that were happened in the cyber crime.
Keywords: Cyber Crime; Cyber Forensics; Email Forensics; Evidence; Graphs; Security
1. Introduction
Safeguarding of evidence in cyber crime incident is imperative task in cyber forensics. Graph models provide better indulgent to represent real world scenarios. This paper concentration of graphs is completely different from existing graph models like attack graphs, evidence graphs or scenario graphs. This paper is focused on activities happened in cyber crimes and reconstructed the entire crime incident with the help of evidence which results as Evidence Activity Analysis Graph. In simple words the steps for identifying the suspect of a cyber crime, represented as Evidence Activity Analysis Graph model. Another facet of this research is combining stylometric analysis of authorship attribution as one of the activities. Sridhar et al. [10] proposed inverted pyramid approach for e-mail forensics considered as base for using authorship attribution in this work. This paper is divided in five sections. Section 2 summarizes the early graph models that are widely used in computer forensics. Section 3 introduces proposal graph model namely Evidence Activity Analysis Graph model. Same section includes the definition and simple understanding of the graph model. Section 4 completely focuses on experiment to represent email based cyber crime incident in Evidence Activity Analysis Graph model. Section 5 compares various existing graph models with proposed model. As a final point, section 6 presents the conclusions of this piece of work.
2. Early Graphs in Computer Forensics
Representation of evidence that can be applicable in court of law is important in cyber forensics. This representation can be done through different manners, but the best approach is graph representation. Cyber crime incidents in computer forensics require representation through graph that enhances the efficiency of forensic investigation. According to this paper computer forensics may be either digital forensics or cyber forensics.
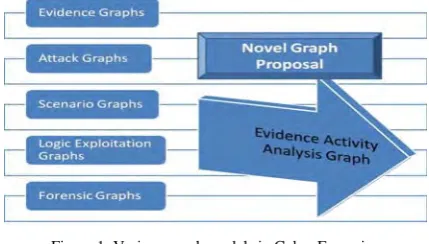
of graphs. Various graphs involved in cyber forensics research are shown in figure 1 along with proposed graph model.
Figure 1: Various graph models in Cyber Forensics
Wang et al. [13] defined evidence graph in which host computers are nodes and preprocessed forensics evidence as edges. Initially Wang et al. proposed evidence graph to facilitate the presentation and manipulation of intrusion evidence. They used automated reasoning process that helps the cyber forensics investigator to fix the intrusion in an effective manner. Later Wang et al. [14] proposed that diffusion and graph spectral methods provide high performance computation methods to forensics analysis field. Further Wang et al. [15] stated that evidence graphs use quantitative metrics to estimate the admissibility of evidence to identify host that is involved in a specific attack. The main components involved in evidence graph are id, source, destination, content and timestamp that are used as edges to connect hosts. Strong point behind the evidence graphs is connections are based on time ordered fashion for forming the evidence graph. Liu et al. [6] discussed about integration of evidence graphs using the concept of merging evidence sub graphs.
Basically evidence graphs are built from attack; hence there is a strong relation between evidence graphs and attack graphs. Evidence graphs are used with network forensics by representing intrusion evidence in the network. As per our point of view evidence graphs and attack graphs are basically used for intrusion detection. Attack graphs are graphical structural models that describe the ways in which a node may be compromised and they are used to analyze security vulnerabilities and their dependencies. Comparing with evidence graphs, attack graphs have been used widely in computer forensics. Swiler et al. [11] created attack-graph simulation tool at Sandia National Laboratory in 1998. In early forms complexity of attack graphs is too high [12] because paths are explicitly enumerated that leads to combinational explosion.
An Attack graph represents the causal relationship between exploits sharing common pre-condition and post-condition. Visual representation of attack graphs allows forensics experts to understand the problems of a network in a better manner [9]. Intact research focus of attack graphs can be seen at the works of Ryan Trost [8] in his book Practical Intrusion Analysis. Latest research studies show the relationship between evidence graphs and attack graphs. Liu et al. [5] proposed mapping probabilistic evidence graphs with attack graphs to adjust inaccuracies.
Several other graph models were introduced by researchers but they were not widely used in cyber forensics. Danilo et al. [2] proposed forensics graph but further research in this direction meager because forensics graph completely depends on hypothesis. Todd et al. [7] discussed about scenario graphs that are related with attack graphs. Further Jeannette [4] extended this idea of scenario graphs and shown that scenario graphs can be applied to security. Han-dong et al. [3] elaborated about logic exploitation graphs that analyzes network based on logical exploitation. In this graph model nodes are exploitation items and edges between nodes are changes in the system.
3. Proposal Model: Evidence Activity Analysis Graph
Many real-world situations can conveniently be described by means of a graph consisting of a set of nodes together with lines joining certain pairs of these nodes. Cyber forensics, a field of emerging trend, also can be described by using graphs. For example, the nodes could represent activities, with edges representing the relationship between these events. Earlier evidence graphs defined as a quadruple by Wang et al. [13]. As per that an evidence graph is a quadruple G=(N,E,S,R), where N is the set of incident nodes, E is the set of directed edges, S stands for states of nodes and R is the set of labels that indicate the attributes of edges.
Instead of evidence graph, this paper proposes Evidence Activity Analysis Graph. In the Evidence Activity Analysis Graph, each node represents a source of activity in forensic investigation and each edge represents the relationship between the incidents. The major functionality of Evidence Activity Analysis Graph is providing a visualization of observed evidence, so it is convenient for forensics expert to interact with the evidence.
proposes Evidence Activity Analysis Graph as an ordered triple which can be represented with the help of G=<A,R, φ > where A is set of Activities and R is set of relationships. Cyber crime incidents can conveniently be described by means of Evidence Activity Analysis Graphs. These graphs consists set of points together with line joining certain pairs to these points.
3.1. Definition of Evidence Activity Analysis Graph
An Evidence Activity Analysis Graph G is an ordered triple (A(G), R(G), φG) consisting of a nonempty set A(G) of vertices representing set of activities, a set R(G), disjoint from A(G), of edges representing set of relationships and an incidence function φG) that associates with each edge of G an unordered pair of vertices of G. If e is an edge and u and v are vertices such that φG=uv, then e is said to join u and v; the vertices u and v-are called the ends of e.
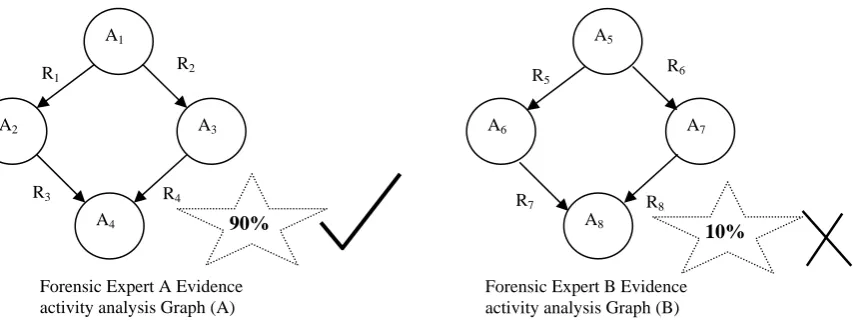
3.2. Example
Let A1,A2,A3,A4 are activities with relations R1,R2,R3,R4 and activities A5,A6,A7,A8 with R5,R6,R7,R8 as
relations of two different evidences for the same forensic analysis and both of them are represented in figure 2. Assume that Evidence Activity Analysis Graph A is 90% nearest to the incident and Evidence Activity Analysis Graph B is 10%, then consider only Evidence Activity Analysis Graph A and proceed further.
Figure 2: Simple Example for Evidence Activity Analysis Graph
As per the initial introduction, Evidence Activity Analysis Graph concentration of evidence is completely different from those evidence graphs and attack graphs related to cyber forensics. This paper is focused on activities happened in cyber crimes and reconstruct the entire crime incident with the help of evidence which results Evidence Activity Analysis Graph. Advantages of using Evidence Activity Analysis Graphs are
Better understanding of evidences
Apparent idea for sequence of incidents happened at the time of cyber crime For a comprehensible idea on cyber crime incident
4. Experiment
4.1.Case Study – Assumed Cyber Crime Incident
Consider a threatening mail received by all employees of the company stating that recent employee policies degrade the company prestige with a suggestion to relinquish from the company. As per company opinion one of the employees might be dissatisfied with the current policies and he/she might have communicated this email. Only two options are with the company either ignore the mail or identify the suspect. Company decided to identify the suspect and lodged a complaint related to that mail to investigate.
4.2.Scenario Setup
Assume that two forensics experts analyzing the case namely Alice and Bob. Alice wants to complete his investigation by deciding the mail was communicated by insider or outsider. But Bob wants to find the suspect by investigating in-depth manner.
4.3.Evidence Processing
Both Alice and Bob started analyzing the e-mail. Alice investigation is based on company assumption and he wants to confirm that assumption. As per Alice approach the following activities and relationships were identified.
1) Initial assumption: It is an insider cyber crime incident A1
A2
A4
A3
A5
A6
A8
A7
Forensic Expert A Evidence activity analysis Graph (A)
Forensic Expert B Evidence activity analysis Graph (B) R1
R2
R3 R4
R5 R6
R7 R8
2) Circumvent through the mail content 3) Explore the header of email content 4) Find the IP address
5) As per assumption, it may belong to company IP 6) Fix that it is an insider threaten (assumption is correct)
Bob wants detailed investigation so he started his investigation without assumption. Bob identified following steps related to processing the evidence.
1) Get the email header
2) Identify all the IP addresses involved in email header 3) Apply tracert towards those IP addresses
4) Locate those IP addresses using IP locaters 5) Find the location of the email origination
6) Two cases may exist: Case 1: related to company IP, case 2: related to other IP 7) Case 1: Related to Company IP
a. Collect mailbox for all the employees
b. Prepare authorship profiles based on emails using stylometric approach c. Get stylometric properties for the suspect mail
d. Compare stylometric properties with authorship profiles e. Fixing author:
i. If any match occurred, fix the author ii. Otherwise, return not matched 8) Case 2: Related to Other IP
a. Assumption: Mail may be sent by ex-employee or current employee b. Identify City location of IP Address
c. Check any employee is been to that city
d. Collect all such employees both existing and correct, name them as suspects e. Gather mailbox for those suspects
f. Prepare authorship profiles based on emails using stylometric approach for the suspects g. Get stylometric properties for the suspect mail
h. Compare stylometric properties with authorship profiles i. Fixing author:
i. If any match occurred, fix the author ii. Otherwise, return not matched
4.4.Evidence Graph Construction
As per Alice investigation to construct Evidence Activity Analysis Graph, the identified steps should be converted as activities and relationships. Alice identified activities are Circumvent through the mail content and applied header analysis (A1), extraction of IP Address (A2), and fixing the location and Confirmation
insider/outsider threaten (A3). Relationships identified by Alice are Begin with assumption: Insider Cyber Crime
Incident (R1), header Information (R2), IP Address (R3), and fixing the Result (R4).
Bob identified activities are Header analysis (A1 ), tracert IP Address (A2 ), fixing the location (A3), processing
of insiders (A4), authorship profiles of insiders (A5), checking employees city visits (A6), suspects mail
processing (A7), evidence mail processing (A8) and comparison (A9). Abbasi et al. (2008) discussed stylometric
analysis which eases the job of cyber forensics investigator at the time of deciding author from a group of suspects. Relationships identified by Bob are header information (R1), IP Addresses Vector (R2), location of
email IP Origin (R3), company IP (R4), mailbox of all Insiders (R5), insiders’ stylometric properties (R6),
non-company IP (R7), city Location of IP (R8), suspect’s stylometric properties (R9), evidence mail stylometric
properties (R10), and Comparison Result (R11). Alice and Bob Evidence Activity Analysis Graph models are
Figure 3: Alice and Bob Evidence Activity Analysis Graph models
4.5.Alice Evidence Analysis vs. Bob Evidence Analysis
After Alice and Bob completed their Evidence Activity Analysis Graphs, a comparison should be made between these two graphs to identify the better approach. Though Alice graph model is simple, suspect is not identified even in final stage. Bob had chosen a complex evidence analysis graph that identifies the suspect by applying stylometric approach. Comparison between these two analyses is shown in table 1.
TABLE 1: Comparison between Alice Vs Bob analysis
Alice evidence analysis Bob evidence analysis
Simple approach Complex approach Identifies insider/outsider Identifies suspect Use general approach Uses stylometric analysis
Not bother about outside IP Given equal priority to both company IP and non-company IP No analysis for employee behavior Concentrated on employee behavior also
4.6.Result
After careful observation of pictorial representation shown by Alice and Bob, forensic experts can easily choose the better approach. In this case Forensic Investigator Bob approach is correct and investigation should be made in the same direction to identify the suspect.
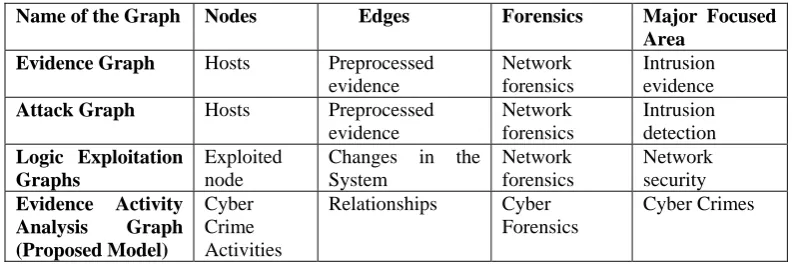
5. Comparison between existing graphs and proposed Evidence Activity Analysis Graph model
Idea of Evidence Activity Analysis Graph that is presented in this paper is completely different from other existing graphs in cyber forensics. Major contribution of evidence graphs or attack graphs focused on intrusion detection in specific to network forensics analysis. This paper speaks about evidence in terms of evidential material that can be applicable in court of law. Activities in this graph model are flow of actions (may be predicted) happened in the cyber crime incident. As per existing graph models nodes are not represented as hosts, they are activities involved in the incident. As per our observation all graphs are directed acyclic graphs including proposed graph model. Table 2 shows the comparison between existing graphs and Evidence Activity Analysis Graph model.
Table 2: Comparison between existing graphs and Evidence Activity Analysis Graph model
Name of the Graph Nodes Edges Forensics Major Focused
Area
Evidence Graph Hosts Preprocessed
evidence
Network forensics
Intrusion evidence
Attack Graph Hosts Preprocessed
evidence
Network forensics
Intrusion detection
Logic Exploitation Graphs
Exploited node
Changes in the System
Network forensics
Network security
Evidence Activity Analysis Graph (Proposed Model)
Cyber Crime Activities
Relationships Cyber Forensics
6. Conclusion
We proposed the Evidence Activity Analysis Graph model for e-mail forensics. This paper compared existing graph models namely evidence graphs and attack graphs with proposed graph model. Conceptual differences between these graphs indicate that proposed graph model completely different from existing ones. In court of law, this kind of graph acts evidential material. This work acts as an initial step towards email forensics analysis. Result graphs concluded that evidence activity graph model helps forensics experts in understanding the cyber crime scenario in an effective manner.
References
[1] Abbasi A, Chen H. Writeprints: a stylometric approach to identity level identification and similarity detection in cyberspace. ACM Transactions on Information Systems March 2008;26(2).
[2] Danilo Bruschi, Mattia Monga, Lorenzo Martignoni, How to Reuse Knowledge about Forensic Investigations, Digital Forensics Research Workshop, 2004
[3] Han-dong Mao1, Wei-Ming Zhang1, Chen Feng, An Approach for Network Security Analysis using Logic Exploitation Graph, Seventh International Conference on Computer and Information Technology, 2007, DOI 10.1109/CIT.2007.129
[4] Jeannette M. Wing, “Scenario Graphs Applied to Security (Extended Abstract),” Verification of Infinite-State Systems with Applications to Security, editors E. Clarke, M. Minea, and F.L. Tiplea, IOS Press, 2006, pp. 229–234.
[5] Liu C,Singhal A, Wijesekher D, Mapping Evidence Graphs to Attack Graphs, IEEE International Workshop on Information Forensics and Security, December, 2012.
[6] Liu C,Singhal A, Wijesekher D, Merging Evidence Sub Graphs to Create an Integrated Evidence Graph, Ninth Annual IFIP WG 11.9 International Conference on Digital Forensics, 2013
[7] Todd Hughes and Oleg Sheyner, “Attack Scenario Graphs for Computer Network Threat Analysis and Prediction,” Complexity, 9(2):15–18, November/December 2003.
[8] Ryan Trost, Practical Intrusion Analysis-Prevention and Detection for the twenty first century, Pearson Education, 2009, pp 119-147 [9] Sheyner, O., Haines, J., Jha, S., Lippmann, R.,Wing, J.M.: Automated Generation and Analysis of Attack Graphs. In: Proceedings of
the 2002 IEEE Symposium on Security and Privacy (S&P 2002), pp. 273–284. IEEE Press,
[10] Sridhar Neralla, Lalitha Bhaskari D, Avadhani P S, Inverted Pyramid Approach for E-mail forensics using heterogeneous forensics tools, CSI Communications, July 2013 Pp 20-22
[11] Swiler, L and Phillips, C. “A graph-based system for network-vulnerability analysis.” Proceedings of the 1998 workshop on New security paradigms, p. 71–79, September 22–26, 1998, Charlottesville, VA.
[12] Swiler L, C. Phillips, D. Ellis, S. Chakerian. “Computer-Attack Graph Generation Tool.” Proceedings of the DARPA Information Survivability Conference and Exposition II, 2001.
[13] Wang W. and Daniels T. E, Building evidence graphs for network forensics analysis. In Proceedings of the 21st Annual Computer Security Applications Conference (ACSAC), Tucson, Arizona, December 2005.
[14] Wang W. and Daniels T. E, Diffusion and Graph Spectral Methods for Network Forensic Analysis, NSPW 2006, September 19–22, 2006, Schloss Dagstuhl, Germany.
[15] Wang W. and Daniels T. E, A graph based approach toward network forensics analysis, ACM Transactions on Information and Systems Security 12 (1) (2008).
About Authors
Mr. Sridhar Neralla is a research scholar in the Department of Computer Science and Systems Engineering of Andhra University, under the supervision of Prof.P.S.Avadhani and Dr.D.Lalitha Bhaskari. He received his M.Tech (IT) from Andhra University and presently working as Associate Professor in IT Department of GMRIT. He is a Life Member of CSI and ISTE. He has coauthored 4 books. His research areas include Network Security, Cryptography, Multimedia, Cyber Forensics and Web Security.