INTERNATIONAL RESEARCH JOURNAL OF PHARMACY
www.irjponline.com
ISSN 2230 – 8407
Research Article
ANALYTICAL METHODS DEVELOPMENT & VALIDATION FOR SIMULTANEOUS ESTIMATION OF
LOPINAVIR & RITONAVIR IN PHARMACEUTICAL FORMULATION BY SIMULTANEOUS EQUATION
METHOD USING UV SPECTROPHOTOMETRY
Sarika R. Jadhav
1*, Hemant P. Alhat
2, Suhas Joshi
21
Rasiklal M. Dhariwal Institute of Pharmaceutical Education and Research, Chinchwad Station, Pune, India
2PES’s, Modern College of Pharmacy (For Ladies), Moshi, Pune, India
*Corresponding Author Email: [email protected]
Article Received on: 04/07/18 Approved for publication: /07/18
DOI: 10.7897/2230-8407.098165
ABSTRACT
The present work deals with the simultaneous estimation of Lopinavir and Ritonavir in bulk and pharmaceutical dosage form using the UV method. Shimadzu UV system was used for analysis. The solvent selected for analysis was acetonitrile: water (30:70v/v). The wavelength of Lopinavir and Ritonavir were found 257.5 nm and 240.0 nm respectively. The Linearity for simultaneous equation method was studied by plotting a graph Conc. Vs. absorbance, Linearity was observed in the concentration range 80-180µg/ml for Lopinavir and 10-60 µg/ml of Ritonavir Coefficient of correlation (R2)
was found to be 0.997 and 0.998 for Lopinavir and Ritonavir respectively. The LOD was found to be 2.379µg/ml and 0.66 µg/ml for Lopinavir and Ritonavir respectively. LOQ was found to be 7.21µg/ml and 2 µg/ml for Lopinavir and Ritonavir respectively. The developed method was employed for the analysis of marketing formulation. The amount of drug obtained was in accordance with label claim. The recovery studies were carried out at three levels, i.e.80 %, 100% and 120% by the standard addition method. The precision of the proposed method was also established. The method was found to be accurate and precise.
Keywords: Lopinavir, Ritonavir, Simultaneous Equation Method, UV Spectrophotometer, Validation.
INTRODUCTION
Lopinavir and Ritonavir are antiretroviral drugs from a protease inhibitor class. The drugs have been proved to be effective in anti-HIV treatment. Chemically Lopinavir is (2S)-N-[(2S,4S,5S)
-5-[2- (2,6dimethylphenox acetamido]
-4-hydroxy-1,6-iphenylhexan-2-yl] -3-methyl-2-(2-oxo-1,3-diazinan-1-yl) butanamide and its empirical formula is C37H48N4O5 with a
molecular weight of 628.80 (Figure 1 A) 1-3 and Ritonavir (5s,
8s, 10s,11s)-10-hydroxy-2-methyl-5-(1-methylethyl) 1[2(1methylethyl)4thiazolyl]3,6dioxo8,11is (phenylmethyl) -2,4,7,12-etraazatridecan-13-oic acid 5-thiazolyl methyl ester of molecular formula C37H48N6O5S2 and its molecular weight is
720.95 (Figure 1 B) 1-3. Ritonavir is the most potent protease
inhibitor, it has an ability to inhibit CYP-450 and efflux pump-P-glycoprotein as a result the potential for severe drug interaction is quite great because of strong CYP-450 the inhibiting effect of ritonavir. The drug has found value when used in fixed dosage form combination with other Pharmaceutical Ingredients to block their metabolism and acts as a booster for these drugs. In these cases, ritonavir is used in a sub therapeutic dose, but boosts the effectiveness of theco administered drug. 4-7
Literature survey of lopinavir and ritonavir either single or in combination with ritonavir shows that several methods based on UV- spectrophotometry, HPLC and HPTLC were developed and validated. However, there are few UV- spectrophotometric method for simultaneous determination are available which are costly and time consuming. The present method was validated as per ICH guideline.
MATERIALS AND METHODS8-17
Instrument
An UV –visible double beam spectrophotometer of make JASCO, model V-530 with a pair of 1cm matched quartz cell, spectral bandwidth of 2cm and Shimadzu balance, AUX-220 were used for experimental purpose.
Chemicals
Acetonitrile-AR, Distilled water
Method
The stock solutions were prepared as follows-
Preparation of stock solution of Lopinavir
Preparation of stock solution of Ritonavir
An accurately weighed 5mg of Lopinavir was transferred to 50ml volumetric flask. Dissolved and made up to the volume with a mixture of Acetonitrile: water (30:70v/v) which is previously prepared and sonicated for 10min., obtain the concentration of 100µg/ml. Stock solution was sonicated for 15 min and filtered it. From this stock solution pipette out 1ml,2ml,3ml,4ml,5ml in 10ml volumetric flasks and made the volume with a mixture of Acetonitrile : water (30:70v/v) to get final concentration range 10-50µg/ml.
Selection of Wavelengths
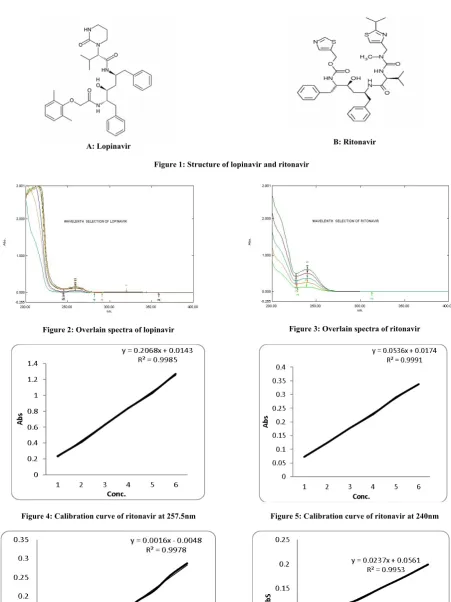
The stock solution of Lopinavir and Ritonavir were prepared separately in the mixture of Acetonitrile: water (30:70v/v) having concentration 1000µg/ml and 100µg/ml, respectively, diluted with the same to get concentration range 80µg/ml-160µg/ml for Lopinavir and 10-50µg/ml for Ritonavir they were scanned in the wavelength range of 200-400 nm, the λmax of both the drug were found it was 257.5nm for Lopinavir and 240nm for Ritonavir. Figure 2 and Figure 3.
METHOD VALIDATION
Linearity
Preparation of standard calibration curve and selection of analytical linearity ranges
The stock solution of Lopinavir and Ritonavir were prepared separately in the mixture of Acetonitrile: water (30:70v/v) having concentration 1000µg/ml and 100µg/ml, respectively, diluted with the same to get concentration range 80µg/ml-160µg/ml for Lopinavir and 10-50µg/ml for Ritonavir respectively. The absorbances of the different concentration of Lopinavir were measured at 257.5nm and the absorbances of the different concentration of Ritonavir were measured at 240nm respectively. Six replicates analysis was carried out. Absorbance Vs concentration was plotted to obtain the calibration graph. Both the drugs obeyed Beer’s law with the above concentration range with the range R2 value of 0.997 and 0.998 for Lopinavir and Ritonavir.
For simultaneous equation method, Lopinavir was also measured at 240nm and Ritonavir was also measured at 257.5nm respectively. Table 1-4, Figures 4-7.
Optical and regression characteristics
Optical and regression characteristics of the calibration curves are given in table 5.
Limit of detection (LOD) and limit of quantification (LOQ)
The LOD and LOQ were separately determined based on the standard deviation of the response of the calibration curve. The standard deviation of the y intercept and slope of calibration curve was used to calculate the LOD and LOQ. The results of the same are shown in the table 6.
LOD calculated from the formula
LOD =
where, SD = Standard deviation, S = Slope
LOQ calculated from the formula LOQ=
where, SD = Standard deviation S = Slope
Assay
Analysis of standard mixture of Lopinavir and Ritonavir
The stock solution containing a mixture of Lopinavir and Ritonavir in the ratio 4:1 was taken, different dilution from stock solution were prepared having concentration range 50 - 250µg/ml for Lopinavir (12.5-62.5µg/ml for Ritonavir). The concentration range 80 µg/ml for Lopinavir and 20 µg/ml for Ritonavir was selected as a reference standard. The absorbance of the reference standard solution was taken. The results of analysis of reference standard are given in the table 7.
Analysis of tablet formulation
Conventional tablet of Lopinavir (200mg) and Ritonavir (50mg) procured from the local market (Lopimune from Cipla Ltd) the tablet powder equivalent to 10mg of Lopinavir and 2.5mg of Ritonavir was weighed accurately, dissolved in an ACN: H2Oin
a 25 ml volumetric flask, Sonicate the solution for 20 min to complete dissolution. The solution was diluted up to the mark to get 400µg/ml of Lopinavir and 100µg/ml of Ritonavir and filtered through Whatman filter paper no. 40. The sample stock solution was suitably diluted with selected solvent to get 80µg/ml of Lopinavir and 20µg/ml of Ritonavir. The resulting stock solution was filtered using Whatman filter paper No.40, the absorbance of the solution was taken, and the amount drug was calculated. The results of analysis of tablet formulation are given in table no. 8.
Precision
A) Repeatability
The repeatability of sample applications and measurement of absorbance were expressed in terms of % R. S. D. and was found to be less than 2% and results of the same are given in the table 10.
B) Intermediate precision
The intermediate precision was determined by six replicate absorbance of the prepared sample solutions. The repeatability of the sample application and measurement of absorbance’s for the drug was calculated by repeating the assay six times for each concentration in the same day for intraday precision. The inter-day precision was obtained by assay of six sample sets on different days. The results of the analysis are shown in the table 10.
Accuracy
Ruggedness
The same experiment was carried out by different analyst. Limit: Overall RSD for twelve results obtained from two different systems should not be more than 2.0 %. Overall RSD for twelve results obtained from two different analysts should not be more than 2.0 %.
Overall RSD for twelve results obtained from two different analysts were found to be within limits. Therefore, the UV Spectroscopic method for the determination of both drugs is rugged. Table 13.
RESULT
A simple, precise and accurate UV-Spectrophotometric method was developed for Simultaneous estimation of Lopinavir and Ritonavir in bulk and marketed tablet formulation, using solvent of Acetonitrile: water (AR grade), in the ratio 30: 70. The absorbances were taken at 257.5 nm and 240 nm for Lopinavir
and Ritonavir respectively. The stock solution of Lopinavir and Ritonavir were prepared separately in the mixture of Acetonitrile: water (30:70v/v) having concentration 1000µg/ml and 100µg/ml respectively, diluted with the same to get concentration range 80µg/ml-160µg/ml for Lopinavir and 10-50µg/ml for Ritonavir respectively. The absorbances of the different concentration of Lopinavir were measured at 257.5nm and the absorbances of the different concentration of Ritonavir were measured at 240nm respectively six replicate analyses were carried out. Absorbance Vs concentration was plotted to obtain the calibration graph. Both the drugs obeyed Beer’s law with the above concentration range with the range R2value of 0.997 and 0.998 for Lopinavir and
Ritonavir. Optical and regression characteristics of the calibration curves were carried out. The LOD and LOQ values for Lopinavir was 2.37 µg/ml and 7.21 µg/ml and for Ritonavir 0.66 µg/ml and 2 µg/ml respectively. 91.37 % w/w and 93.31 %w/w Assay values were for marketed formulation with respect to Lopinavir and Ritonavir respectively.
% R.S.D. of method was less than one.
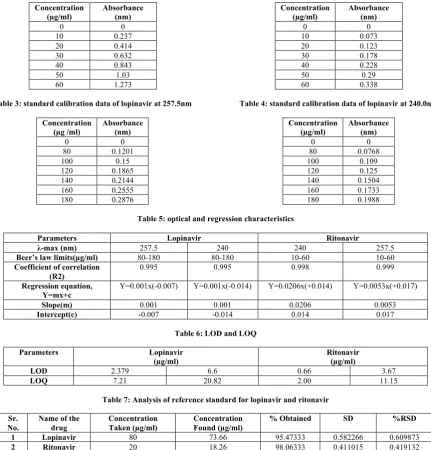
Table 1: Standard calibration data of ritonavir at 257.5 nm
Concentration (µg/ml)
Absorbance (nm)
0 0
10 0.237 20 0.414 30 0.632 40 0.843
50 1.03
60 1.273
Table 2: Standard calibration data of ritonavir at 257.5nm
Concentration (µg/ml)
Absorbance (nm)
0 0
10 0.073 20 0.123 30 0.178 40 0.228
50 0.29
60 0.338
Table 3: standard calibration data of lopinavir at 257.5nm
Concentration (µg /ml)
Absorbance (nm)
0 0
80 0.1201 100 0.15 120 0.1865 140 0.2144 160 0.2555 180 0.2876
Table 4: standard calibration data of lopinavir at 240.0nm
Concentration (µg/ml)
Absorbance (nm)
0 0
80 0.0768 100 0.109 120 0.125 140 0.1504 160 0.1733 180 0.1988
Table 5: optical and regression characteristics
Parameters Lopinavir Ritonavir
λ-max (nm) 257.5 240 240 257.5
Beer’s law limits(µg/ml) 80-180 80-180 10-60 10-60
Coefficient of correlation (R2)
0.995 0.995 0.998 0.999
Regression equation,
Y=mx+c Y=0.001x(-0.007) Y=0.001x(-0.014) Y=0.0206x(+0.014) Y=0.0053x(+0.017)
Slope(m) 0.001 0.001 0.0206 0.0053
Intercept(c) -0.007 -0.014 0.014 0.017
Table 6: LOD and LOQ
Parameters Lopinavir
(µg/ml)
Ritonavir (µg/ml)
LOD 2.379 6.6 0.66 3.67
LOQ 7.21 20.82 2.00 11.15
Table 7: Analysis of reference standard for lopinavir and ritonavir
Sr. No.
Name of the drug
Concentration Taken (µg/ml)
Concentration Found (µg/ml)
% Obtained SD %RSD
1 Lopinavir 80 73.66 95.47333 0.582266 0.609873
2 Ritonavir 20 18.26 98.06333 0.411015 0.419132
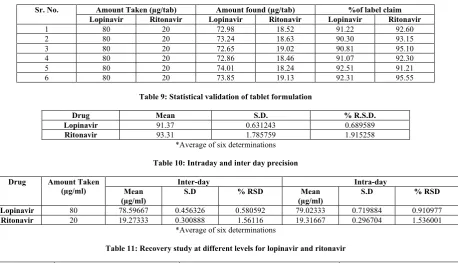
Table 8: Analysis of tablet formulation
Sr. No. Amount Taken (µg/tab) Amount found (µg/tab) %of label claim Lopinavir Ritonavir Lopinavir Ritonavir Lopinavir Ritonavir
1 80 20 72.98 18.52 91.22 92.60
2 80 20 73.24 18.63 90.30 93.15
3 80 20 72.65 19.02 90.81 95.10
4 80 20 72.86 18.46 91.07 92.30
5 80 20 74.01 18.24 92.51 91.21
6 80 20 73.85 19.13 92.31 95.55
Table 9: Statistical validation of tablet formulation
Drug Mean S.D. % R.S.D.
Lopinavir 91.37 0.631243 0.689589
Ritonavir 93.31 1.785759 1.915258
*Average of six determinations
Table 10: Intraday and inter day precision
Drug Amount Taken
(µg/ml) Mean Inter-day Intra-day
(µg/ml)
S.D % RSD Mean
(µg/ml)
S.D % RSD
Lopinavir 80 78.59667 0.456326 0.580592 79.02333 0.719884 0.910977
Ritonavir 20 19.27333 0.300888 1.56116 19.31667 0.296704 1.536001
*Average of six determinations
Table 11: Recovery study at different levels for lopinavir and ritonavir
Level of % Recovery
Amount present (mg)
Amount of standard added (mg)
% recovery
Lopinavir Ritonavir Lopinavir Ritonavir Lopinavir Ritonavir
80 80 20 64 16 87.23 86.01
80 20 64 16 86.21 86.53
80 20 64 16 87.63 85.96
100 80 20 80 20 91.56 91.56
80 20 80 20 90.23 91.46
80 20 80 20 91.26 90.75
120 80 20 96 24 91.85 90.97
80 20 96 24 91.48 90.68
80 20 96 24 92.14 91.21
*Average of three at each level of recovery
Table 12: Statistical validation of recovery studies
Level of % recovery
% mean recovery Standard deviation % R.S.D. Lopinavir Ritonavir Lopinavir Ritonavir Lopinavir Ritonavir 80 87.02 86.16 0.7322 0.3156 0.8413 0.3663
100 91.01 91.25 0.6975 0.4416 0.7664 0.4839
120 91.82 90.95 0.3308 0.2653 0.3602 0.2919
Table 13: Ruggedness-analysis of formulation
Sr.no. Amount taken (µg/ml) Amount found (µg/ml) % Amount Found Lopinavir Ritonavir Lopinavir Ritonavir Lopinavir Ritonavir
1 80 20 72.95 18.60 91.18 93.01
2 80 20 73.23 18.41 91.53 92.05
3 80 20 73.64 19.13 92.05 95.65
4 80 20 72.86 18.34 91.07 91.70
5 80 20 73.91 18.35 92.38 91.75
A: Lopinavir B: Ritonavir
Figure 1: Structure of lopinavir and ritonavir
Figure 2: Overlain spectra of lopinavir Figure 3: Overlain spectra of ritonavir
DISCUSSION
The given methods were validated as per the ICH guidelines. The given method followed the Beers Lamberts law (linearity) in the range of 80µg/ml-160µg/ml for Lopinavir and 10-50µg/ml for Ritonavir respectively. Optical and regression characteristics of the calibration curves showed Coefficient of correlation was within the limit. From LOD and LOQ method showed the sensitivity. Assay value showed the accuracy of method. Precision and recovery study were carried out which shows the method is précised. Ruggedness study shows that the given method was stable.
CONCLUSION
The developed method was validated as per ICH guidelines. The method follows all validation parameters and the developed method is easy, simple, follows accuracy and precision. The ruggedness indicates the developed method was stable.
ACKNOWLEDGMENT
The authors are grateful to Emcure Pharmaceutical Ltd., Bhosari, Pune, for providing the gift samples. We are also sincerely thanks to PES’s, Modern college of Pharmacy (For Ladies), Moshi, Pune for providing necessary facilities. Authors sincerely thanks to Prin. Dhole S., Prof. Joshi S. and Mr. Alhat H. for their guidance in this work.
REFERENCES
1. Skoog DA, Holler FJ, Timothy A, Nieman NW. Principal of Instrumental Analysis. 6th ed. (New Delhi): Eastern Press;
2007.
2. Willard HH, Merritt LL, Dean JA and Settle FA. Instrumental methods of analysis 7th ed. (New Delhi): CBS Publishers and
Distributors; 2001.
3. Sethi PD. High Performance Liquid Chromatography
Quantitative Analysis of Pharmaceutical formulations.1st Ed.
New Delhi: CBS Publishers and Distributors; 2001. 4. Daharwa SJ. Methods of estimation of multicomponent
formulations: A review. Indian Drugs 2006; 3: 1-43. 5. ICH Harmonised Tripartite Guideline, validation of
analytical procedures: Text methodology, Q2 (R1) (2005). International Conference on Harmonization, Geneva, pp: 1-13.
6. Center for Drug Evaluation and Research: Reviewer Guidance Validation of chromatographic Methods. November 1994 p: 1-29.
7. Kataria S, Middha A, Sandhu P. Validation of Analytical Procedures: A comparison of ICH Vs Pharmacopoeia Vs FDA. Pharmatutor: 49-52.
8. Nandhakumar L., Dharmamaoorthy G., Rameshkumar S., Chandrasekaran S. An overview of pharmaceutical Validation: Quality Assurance view point. International Journal of Research in Pharmacy and Chemistry 2011; 1(4): 1003-14.
9. Suneetha A, Kathrivel S, Ramachandrika GA. Validated RP HPLC method for simultaneous estimation of Lopinavir and Ritonavir in combined dosage form. International Journal of Pharmacy and Pharmaceutical Sciences 2011; 3(1): 49-51. 10.Nagulwar VP, Bhusari KP. Simultaneous Estimation of
Ritonavir and Lopinavir by Absorption ratio (Q-analysis) UV Spectrophotometric Method in Combined Tablet Dosage Form. Der Pharmacia Lettre 2010; 2 (1): 196-200.
11.Hetal P. A First derivative spectrophotometric method for the estimation of Lopinavir in tablet dosage form. Chron Young Scientist 2010; 22-23.
12.Chiranjeevi K. Third order derivative spectrophotometric estimation of Ritonavir in bulk and pharmaceutical dosage forms. Journal of Pharmaceutical Sciences 2011; 3 (1): 1017-1020.
13.Varma SM, Lakshmi RV, Dhanaraju MD. Development and
Validation of a RP-HPLC Method for Determination of Lopinavir in Bulk and Pharmaceutical Dosage Form. International Journal of Research in Pharmacy and Chemistry 2012; 2 (2): 413-17.
14.Jagadeeswaran, Gopal N, Pavankumar K, Sivakumar T. Quantitative Estimation of Lopinavir and Ritonavir in Tablets by RP-HPLC Method. Pharmaceutica Analytica acta 2012; 3(5): 3-5.
15.Varaprasad L., Harinadha Baba B.K, Ravikumar A , Vijaykumar G. Development method validation of RP-HPLC method for simultaneous determination of lopinavir and Ritonavir in bulk and formulation dosage. International Research Journal of Pharmaceutical and Applied Sciences 2012; 2(4): 84-90.
16.Mardia RB, Suhagia BN, Pasha TY, Chauhan SP, Solanki SD. Development and Validation of HPTLC Method for Simultaneous Analysis of Lopinavir and Ritonavir in Their Combined Tablet Dosage Form. International Journal for Pharmaceutical Research Scholars 2012; 1 (1), 39-43. https://doi.org/10.31638/IJPRS.V1.I1.00017
17.Sulebhavikar AV, Pawar UD, Mangoankar KV,
Prabhu-Navelkar ND.HPTLC Method for Simultaneous
Determination of Lopinavir and Ritonavir in Capsule Dosage Form. E-Journal of Chemistry 2008; 5(4):706-12. https://doi.org/10.1155/2008/539849
Cite this article as:
Sarika R. Jadhav et al. Analytical methods development & validation for simultaneous estimation of Lopinavir & Ritonavir in pharmaceutical formulation by simultaneous equation method using UV spectrophotometry. Int. Res. J. Pharm. 2018;9(8):57-62 http://dx.doi.org/10.7897/2230-8407.098165
Source of support: Nil, Conflict of interest: None Declared