STUDIES ON COMPRESSION AND DRUG RELEASE CHARACTERISTICS OF XANTHIUM GUM PELLETS OF DIFFERENT COMPOSITIONS
8
0
0
Full text
(2) Suvarna Hause et al. Int. Res. J. Pharm. 2016, 7 (4) Preparation of tablets6. Evaluation of Prepared Tablets. Unlubricated pellets were compressed using a Cadmach single punch press was equipped with flat–faced punches of 8mm diameter. The punches and die were lubricated before every compaction with magnesium stearate suspension (1%w/w in ethanol) 200mg sample of pellets containing 20 mg of simvastatin of size fraction 1000-1400μm were accurately weighed and manually fill in to the die. The prepared tablets were stored in desecrator at room temperature for at least 48 hr before being subjected to any characterization to remove any residual humidity. Formulation Chart of Simvastatin tablets shown in Table 1.. Hardness12 Hardness of tablet was measured using Monsanto hardness tester. It is the pressure required to fracture diametrically placed tablets by applying the force. The hardness of 6 tablets, from each batch was determined and means hardness was taken into account, which was expressed in kg/cm2.. Evaluation of Prepared Pellets 5,7, 8, 9,18. Friability12 Roche friabilator was used for the purpose. This device subjects a number of tablets to the combined effect of abrasion and shock by utilizing a plastic chamber that revolves at 25 rpm dropping the tablets at distance of 6 inches with each revolution. Preweighed sample of tablets was placed in the friabilator, which was then operated for 100 revolutions. Tablets were re-weighed. The percentage friability was measured using the formula, % Friability = Initial weight-Final weight / Final weight × 100. Bulk density Blend was weighed and transferred to a measuring cylinder. Then bulk volume was noted. Bulk density was calculated by using formula. Df = M / Vp Where, Df = Loose bulk density, M = Weight of samples in grams, Vp = Final volumes of granules in cm3 Angle of repose A funnel was fixed at a height approximately of 2-4 cm over the platform. The loose powder was slowly passed along the wall of funnel, till the cone of the powder formed. Determine the angle of repose by measuring the height of the cone of powder and radius of the heap of powder q = tan –1 h / r True density The True density of the pellet was determined by solvent displacement method Dt = M / Vp Where, Dt = True density density, M = Weight of samples in grams, Vp = Final volumes of liquid in cm3 Degree of compression The degree of compression of the pellets was calculated by applying C% = (Ho-Hp / Ho) × 100 Where, Ho is the estimated height of pellet bed in-die before compression, Hp is the height of the compact. Specific surface area Specific surface area of pellet was determined by mathematical calculation method SA =6 / рdvs Where, SA = Specific Surface Area, dvs = mean volume surface diameter, р = true density In- vitro drug release studies of formulated pellets 10, 11 In-Vitro drug release studies of simvastatin were carried out using USP type II Dissolution Testing Apparatus (6 vessel assembly, Paddle type) at 50 rpm. The dissolution medium consisted of 900 ml of PH 7.0 buffer solution containing 0.5% SLS in 0.01M sodium phosphate. Temperature maintained at 37±0.50C. Aliquots of 5ml was withdrawn at predetermined time intervals & an equivalent amount of fresh dissolution fluid equilibrated at the same temperature was replaced. Aliquots were filtered through whatman filter paper, suitably diluted using phosphate buffer pH 7.0 and analyzed spectrophotometrically at 238 nm.. Weight variation test12 Weighing 20 tablets individually, calculating the average weight and comparing the individual tablet weight to the average USP weight variation test.. Content uniformity 12 For this at least 30 tablets were randomly selected. Out of 30 tablets, 10 tablets were crushed into fine powder and assayed individually; the tablet should be within 85% to 115% of the labeled claim. Thickness 12 The thickness of the tablet was measured using Vernier caliper. Thickness of five tablets from each batch was measured and mean was calculated. In- vitro drug release studies of formulated tablets 13,14 In-Vitro drug release studies of simvastatin were carried out using USP type II Dissolution Testing Apparatus (6 vessel assembly, paddle type) at 50 rpm. The dissolution medium consisted of 900 ml of pH 7.0 buffer solution containing 0.5%SLS in 0.01M sodium phosphate. Temperature was maintained at 37±0.50C. Aliquot of 5ml was withdrawn at predetermined time intervals & an equivalent amount of fresh dissolution fluid equilibrated at the same temperature was replaced. Aliquots were filtered through whatman filter paper, suitably diluted using phosphate buffer pH 7.0 and analyzed spectrophotometrically at 238 nm. Model fitting15, 16 The model fitting for % cumulative release was done using Microsoft excel 2003 to find the best fits kinetic equation for the dissolution profile. Kinetics of drug release In order to understand the mechanism and kinetics of drug release, the results of the in-vitro dissolution study of the optimized batch of microspheres (batch) was fitted with various kinetic equations like i. Zero order (% release =K t), ii. First order (log Unreleased =Kt), iii. Higuchi’s model (%Release =Kt0.5) and iv. Pappas Korsmeyer Equation (% Release=Ktn) (Or) empirical equation (Power law expression) of Mt / Mµ = K tn Where, Mt = amount of drug release at time t, Mµ = amount of drug release at infinite time, K = constant characteristics, and n = Diffusional exponent. 47.
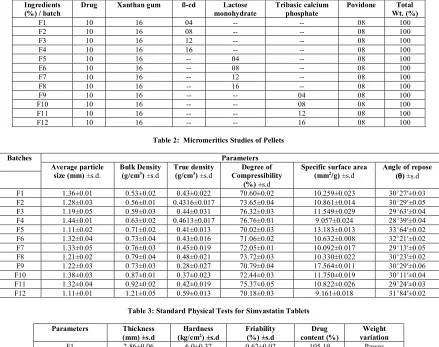
(3) Suvarna Hause et al. Int. Res. J. Pharm. 2016, 7 (4) Stability studies of simvastatin tablets 17 In the present study, stability studies were carried out on selected formulation. The tablets were stored at temp 400C & RH 75 % for duration of one month. After an interval of fifteen and thirty days each sample was withdrawn and tested for drug release.. If n = 0.5 indicates Fickian diffusion mechanism (Higuchi matrix) n = 0.5 to 1indicates Anomalous Transport or Non Fickian transport. n = 1 indicates Case II Transport (Zero order release) n > 1indicates Super case –II transport Coefficient of correlation (R2) values were calculated for the linear curves obtained by regression analysis of the above plots. Table 1: Formulation Chart of Simvastatin Tablets Ingredients (%) / batch F1 F2 F3 F4 F5 F6 F7 F8 F9 F10 F11 F12. Drug. Xanthan gum. ß-cd. 10 10 10 10 10 10 10 10 10 10 10 10. 16 16 16 16 16 16 16 16 16 16 16 16. 04 08 12 16 ---------. Lactose monohydrate ----04 08 12 16 -----. Tribasic calcium phosphate --------04 08 12 16. Povidone. Total Wt. (%) 100 100 100 100 100 100 100 100 100 100 100 100. 08 08 08 08 08 08 08 08 08 08 08 08. Table 2: Micromeritics Studies of Pellets Batches. F1 F2 F3 F4 F5 F6 F7 F8 F9 F10 F11 F12. Average particle size (mm) ±s.d.. Bulk Density (g/cm3) ±s.d. 1.36±0.01 1.28±0.03 1.19±0.05 1.44±0.01 1.11±0.02 1.32±0.04 1.33±0.05 1.21±0.02 1.22±0.03 1.38±0.03 1.32±0.04 1.11±0.01. 0.53±0.02 0.56±0.01 0.59±0.03 0.63±0.02 0.71±0.02 0.73±0.04 0.76±0.03 0.79±0.04 0.73±0.03 0.87±0.01 0.92±0.02 1.21±0.05. Parameters Degree of Compressibility (%) ±s.d 0.43±0.022 70.60±0.02 0.4316±0.017 73.65±0.04 0.44±0.031 76.32±0.03 0.4613±0.017 76.76±0.01 0.41±0.013 70.02±0.03 0.43±0.016 71.06±0.02 0.45±0.019 72.05±0.01 0.48±0.021 73.72±0.03 0.28±0.027 70.79±0.04 0.37±0.023 72.44±0.03 0.42±0.019 75.37±0.05 0.59±0.013 70.18±0.03 True density (g/cm3) ±s.d. Specific surface area (mm2/g) ±s.d. Angle of repose (qq) ±s.d. 10.259±0.023 10.861±0.014 11.549±0.029 9.057±0.024 13.183±0.013 10.632±0.008 10.092±0.017 10.330±0.022 17.564±0.011 11.750±0.019 10.822±0.026 9.161±0.018. 30○27′±0.03 30○29′±0.05 29○63′±0.04 28○39′±0.04 33○64′±0.02 32○21′±0.02 29○13′±0.05 30○23′±0.02 30○29′±0.06 30○11′±0.04 29○24′±0.03 31○84′±0.02. Table 3: Standard Physical Tests for Simvastatin Tablets Parameters F1 F2 F3 F4 F5 F6 F7 F8 F9 F10 F11 F12. Thickness (mm) ±s.d 2.86±0.06 2.55±0.04 2.30±0.07 2.28±0.03 2.70±0.01 2.62±0.05 2.87±0.03 2.42±0.02 2.83±0.04 2.88±0.05 2.31±0.02 2.15±0.03. Hardness (kg/cm2) ±s.d 6.0±0.37 6.2±0.54 6.2±0.43 6.5±0.32 6.1±0.18 6.2±0.35 6.2±0.24 6.2±0.28 6.0±0.12 6.2±0.65 6.1±0.31 5.7±0.33. Friability (%) ±s.d 0.62±0.02 0.84±0.04 0.59±0.01 0.77±0.03 0.51±0.04 0.63±0.02 0.48±0.03 0.69±0.04 0.63±0.02 0.71±0.01 0.83±0.03 0.69±0.02. Drug content (%) 105.19 105.0 101.47 100.05 97.36 96.69 101.13 98.36 102.83 104.37 99.47 103.52. Weight variation Passes Passes Passes Passes Passes Passes Passes Passes Passes passes passes passes. 48.
(4) Suvarna Hause et al. Int. Res. J. Pharm. 2016, 7 (4) Table 4: Percentage Cumulative Release of the Formulation F1, F2, F3 and F4 Time (hours) 0 1 2 3 4 5 6 7 8 9 10 11 12 13 14. f1 ±s.d. 0 17.76±0.231 24.58±0.289 36.29±0.342 42.63±0.621 55.72±0.183 63.79±0.267 71.42±0.374 79.84±0.422 82.47±0.238 86.82±0.376 86.82±0.376 86.82±0.376 86.82±0.376 86.82±0.376. Percentage Cumulative Release f2 ±s.d. f3 ±s.d. 0 0 21.83±0.145 24.81±0.235 28.69±0.365 35.36±0.147 43.82±0.258 50.49±0.364 52.39±0.439 58.63±0.347 61.53±0.647 67.4±0.439 73.57±0.243 79.23±0.160 78.39±0.375 84.36±0.299 83.71±0.143 87.64±0.231 85.92±0.249 90.3±0.378 88.38±0.342 90.3±0.378 88.38±0.342 90.3±0.378 88.38±0.342 90.3±0.378 88.38±0.342 90.3±0.378 88.38±0.342 90.3±0.378. f4 ±s.d. 0 28.02±0.243 44.89±0.344 54.81±0.482 62.73±0.619 75.88±0.490 83.62±0.451 89.53±0.388 91.02±0.417 91.02±0.417 91.02±0.417 91.02±0.417 91.02±0.417 91.02±0.417 91.02±0.417. Table 5: Percentage Cumulative Release of the Formulation F5, F6, F7 & F8 Time (hours) 0 1 2 3 4 5 6 7 8 9 10 11 12 13 14. f5 ±s.d. 0 18.13±0.125 32.29±0.378 45.85±0.241 54.63±0.433 66.17±0.359 71.19±0.723 78.81±0.611 81.23±0.424 83.37±0.538 85.15±0.394 85.15±0.394 85.15±0.394 85.15±0.394 85.15±0.394. Percentage cumulative release f6 ±s.d. f7 ±s.d. 0 0 16.28±0.562 12.73±0.246 29.67±0.243 27.86±0.334 37.82±0.254 34.59±0.313 45.63±0.447 43.65±0.484 53.71±0.272 51.82±0.218 59.76±0.412 57.38±0.313 66.83±0.309 62.84±0.220 71.36±0.222 66.39±0.586 76.21±0.327 71.32±0.551 81.18±0.368 73.16±0.458 83.27±0.436 78.2±0.328 85.84±0.460 81.93±0.432 89.59±0.402 84.72±0.354 91.87±0.156 87.54±0.236. f8 ±s.d. 0 10.81±0.430 23.84±0.183 28.36±0.249 36.39±0.618 44.57±0.427 51.42±0.382 58.67±0.176 61.34±0.477 64.56±0.541 67.59±0.362 73.62±0.401 75.91±0.267 76.83±0.173 78.38±0.188. Table 6: Percentage Cumulative Release of the Formulation F9, F10, F11 And F12 Time (hours) f9 ±s.d. 0 20.62±0.391 28.83±0.428 39.32±0.372 45.87±0.294 56.58±0.582 69.13±0.376 76.55±0.473 79.27±0.532 81.13±0.495 84.53±0.390 84.53±0.390 84.53±0.390 84.53±0.390 84.53±0.390. 0 1 2 3 4 5 6 7 8 9 10 11 12 13 14. Percentage cumulative release f10 ±s.d. f11 ±s.d. 0 0 36.27±0.614 37.29±0.416 43.86±0.283 53.82±0.335 53.28±0.522 62.38±0.447 66.87±0.450 76.42±0.528 72.34±0.501 81.28±0.415 76.41±0.514 86.92±0.291 83.26±0.620 86.92±0.291 87.42±0.623 86.92±0.291 87.42±0.623 86.92±0.291 87.42±0.623 86.92±0.291 87.42±0.623 86.92±0.291 87.42±0.623 86.92±0.291 87.42±0.623 86.92±0.291 87.42±0.623 86.92±0.291. f12 ±s.d. 0 49.22±0.210 58.36±0.44 67.15±0.300 79.87±0.289 84.32±0.445 87.23±0.512 87.23±0.512 87.23±0.512 87.23±0.512 87.23±0.512 87.23±0.512 87.23±0.512 87.23±0.512 87.23±0.512. Table 7: Percentage Cumulative Release of Batch F6 Pellets Time (min) 0 10 20 30. Percentage cumulative release ±s.d. 0 71.59±0.428 95.83±0.352 95.83±0.352. 49.
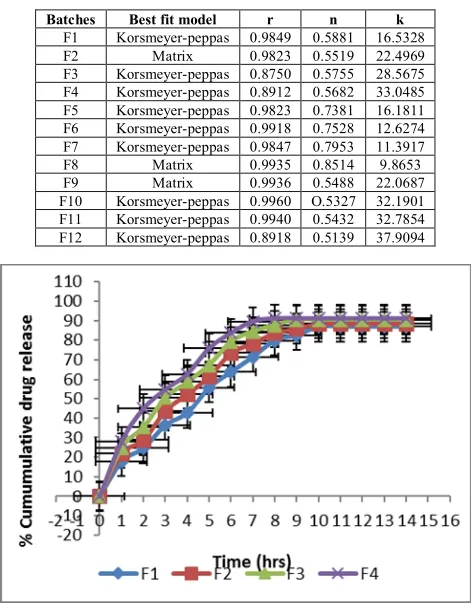
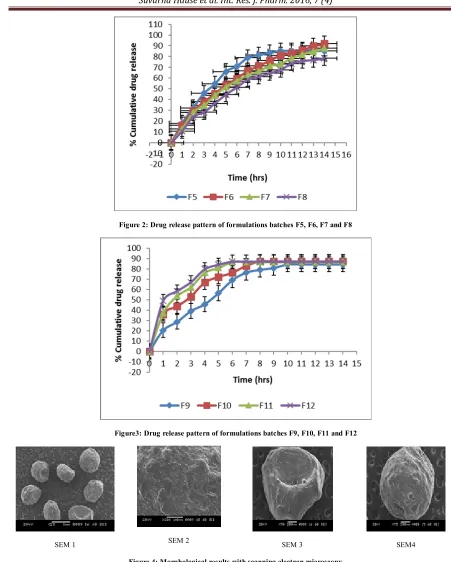
(5) Suvarna Hause et al. Int. Res. J. Pharm. 2016, 7 (4) Table 8: Drug Entrapment of Optimized Formulations after S.S. Parameters Thickness Hardness Drug content. Before stability study ±S.D. 2.62±0.02 6.2. ±0.03 96.69%. Stability study (After 15 days) ±S.D. 2.63±0.04 6.1. ±.0.04 95.83%. Stability study (After 30 days) ±S.D. 2.63±0.02 6.1±0.02 95.46%. Table 9: Dissolution Study of Optimized Formulations after Stability Study Time (hours) 0 1 2 3 4 5 6 7 8 9 10 11 12 13 14. Percentage cumulative release before s.s. ±s.d. (after 15 days) ±s.d. (after30 days)±s.d. 0 0 0 16.28±0.562 16.62±0.428 17.92±0.302 29.67±0.243 27.64±0.501 28.53±0.347 37.82±0.254 38.65±0.218 38.13±0.417 45.63±0.447 45.71±0.256 44.03±0.557 53.71±0.272 54.94±0.244 53.29±0.393 59.76±0.412 60.76±0.143 60.35±0.330 66.83±0.309 65.83±0.292 66.64±0.259 71.36±0.222 68.57±0.246 69.74±0.122 76.21±0.327 76.27±0.201 75.84±0.201 81.18±0.368 81.76±0.482 80.72±0.312 83.27±0.436 83.45±0.316 82.87±0.255 85.84±0.460 85.39±0.205 85.23±0.314 89.59±0.402 88.93±0.538 88.16±0.350 91.87±0.156 90.26±0.352 90.24±0.306. Table 10: Estimated Values of N and K By Regression of Log (Mt / M∞) On Log (T) Batches F1 F2 F3 F4 F5 F6 F7 F8 F9 F10 F11 F12. Best fit model Korsmeyer-peppas Matrix Korsmeyer-peppas Korsmeyer-peppas Korsmeyer-peppas Korsmeyer-peppas Korsmeyer-peppas Matrix Matrix Korsmeyer-peppas Korsmeyer-peppas Korsmeyer-peppas. r 0.9849 0.9823 0.8750 0.8912 0.9823 0.9918 0.9847 0.9935 0.9936 0.9960 0.9940 0.8918. n 0.5881 0.5519 0.5755 0.5682 0.7381 0.7528 0.7953 0.8514 0.5488 O.5327 0.5432 0.5139. k 16.5328 22.4969 28.5675 33.0485 16.1811 12.6274 11.3917 9.8653 22.0687 32.1901 32.7854 37.9094. Figure 1: Drug release pattern of formulations batches f1, f2, f3 and f4. 50.
(6) Suvarna Hause et al. Int. Res. J. Pharm. 2016, 7 (4). Figure 2: Drug release pattern of formulations batches F5, F6, F7 and F8. Figure3: Drug release pattern of formulations batches F9, F10, F11 and F12. SEM 1. SEM 2. SEM 3. SEM4. Figure 4: Morphological results with scanning electron microscopy. 51.
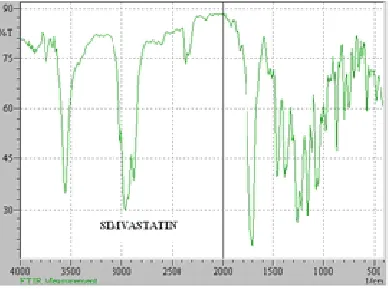
(7) Suvarna Hause et al. Int. Res. J. Pharm. 2016, 7 (4). Figure 5: Drug release pattern of f6 batch of pellets. Figure 6: IR of simvastatin drug. RESULTS AND DISCUSSION To study the effects of fillers on the release characteristics of model drug and production of tablets for the sustained delivery of the Simvastatin, a set of twelve formulations were prepared shown in table 1, The pellets of Simvastatin was prepared by using manual extrusion and spheronisation technique by varying the filler concentration, and keeping the other variables such as concentration of drug, xanthan gum and povidone was kept constant. Evaluation of pellets was done by Bulk density, True density, angle of repose, degree of compressibility and specific surface area. Various batches have the average particle size in the range of 1.11±0.002mm to 1.44±0.01mm. The bulk density value ranged from 0.53±0.02 to 1.21±0.05 g/cm3, true density in between 0.28±0.027 to 0.59±0.013 g/cm3, degree of compressibility in between 70.18±0.03 to 76.76±0.01%, from the analysis of results the matrix pellets of higher degree of compression have higher hardness and specific surface area within9.057±0.024 to 17.564±0.011mm2/g for all filler pellets. Angle of repose was found within the range of 28○39′±0.04 to 33○64′±0.02which is an appreciable limit for pellets. Results were shown in Table 2 formulated tablet were subjected to various quality control test. Examination of tablets from each batch showed flat circular shape with no cracks having white color. The thickness of tablets ranged from 2.15±0.03 to 2.88±0.05mm. All the formulations showed uniform thickness. In weight variation test the Pharmacopoeial limit for percent of deviation for tablets of 200 mg is 7.5%. The average percent deviation of all tablets was found to be within limit and hence all formulations pass the weight variation test. The drug content was found to be uniform among all formulations and ranged from 96.69 % to 105.19%. The hardness of tablets of all formulations was ranged from 5.7±0.3 kg/cm2 to 6.5±0.2kg/cm2. The friability of all tablets ranged from 0.48±0.to 0.84±0.04%. Results were shown in table 3, Dissolution was carried out in pH. Figure7: IR of simvastatin tablet. 7.0 buffer solution containing 0.5% of SLS in 0.01Msodium phosphate as drug is soluble in the media and also it mimics the alkaline environment of small intestine. Dissolution of optimized batch of pellets was carried out in pH 7.0 buffer solution containing0.5% of SLS in 0.01Msodium phosphate as drug is soluble in the media and also it mimics the alkaline environment of small intestine. The in-vitro dissolution was carried out on all the batches in pH 7.0 buffer solution, The release of drug from tablets of batches F1 to F4 was containing Simvastatin as model drug and xanthan gum as rate controlling polymer with ß-cyclodextrin as a filler was studied. As the concentration of ß-cyclodextrin increased the solubility of drug was found to increase and the released rate to increases. The released profiles of these batches are shown in Table 4 and Figure 1, The release of drug from batches F5 to F8 was containing Simvastatinas model drug and xanthan gum as a sustained released rate controlling polymer with lactose monohydrate as a filler was studied. In these batches release was linear with time. It could have concluded that batch F6 (91.87%) released approximately 100% drug over a period of 14 hours. Since it met the all requirement, that’s why it was chosen as the optimized formulation. The released profiles of these batches are shown in Table 5 and Figure 2, The release of drug from batches F9 to F12 containing Simvastatin as model drug and xanthan gum as a sustained released rate controlling polymer with tribasic calcium phosphate as a filler was studied. In the early incubation stage of batch F9, F10, F11 and F12 the dissolution rate of simvastatin was slightly faster especially during the first few hours. This was due to the porous nature of the tablets and the rapid penetration of aqueous solution into the tablets, which is also called burst effect. The released profiles of these batches are shown in Table 6 and Figure 3. Morphology of pellets was. 52.
(8) Suvarna Hause et al. Int. Res. J. Pharm. 2016, 7 (4) examined by scanning electron microscopy. The outer surface of the pellets was smooth and dense, while the internal surface was porous. The shell of the pellets also showed some porous structure as Shown in Figure 4 Percentage cumulative release of the formulation F6. Shown in table 7 and Drug release pattern of formulations batches F6 shown in figure 5, The stability studies were carried out on optimized formulation F6. The formulations were stored at 40 ± 20C and 75 ± 5 % RH for a period of 30 days. After interval at 15th and 30th days samples were withdrawn and retested for thickness, hardness, drug content and drug release studies. Show in table 8 and Drug entrapment of optimized formulations after stability studies were shown in table 9, Dissolution study of optimized formulations after Stability Study. From the above studies it was concluded that product may be stable up to fifteen months. The in vitro release data of all the formulation were fitted in Korsmeyerpeppas and Matrix model and the rate constant and correlation coefficient were compared to get trend in the release pattern of the drug from the formulation. Regression values r2 were found 0.875 to 0.994 from different formulation. The mean diffusional exponent values (n) was found to be ranged from 0.513 to 0.851 indicated all the formulation follows case II transport i.e. swelling and erosion simultaneously occur during the release. Since both swelling and erosion occurs simultaneously, zero order release is achieved from these matrices. This behaviour is responsible for maintaining zero order release in which the increase in diffusion path length due to swelling is balanced with the decrease in diffusion path length due to matrix erosion. Overall a constant diffusion path length is maintained. Thus it was found that drug release from simvastatin matrix tablet follows zero order model. Were shown in Table 10. IR interpretations for drug polymer interaction in formulation, Shown in Figure 6 and 7. The result shown that there was no incompatibility between drug Simvastatin and polymer used, as there was no significant change in the pattern of peaks of pure drug and formulation. REFERENCES 1. Issac Ghebre-Sellassie in; Pharmaceutical Pelletization Technology, Marcel Dekker series 1989: 37: 123-140. 2. Kokate C. K.,Purohit A. P., Gokhale S. B., Pharmacognosy, , 18th ed .Nirali Prakashan 2002. P.157. 3. Trapathi K.D., Essentials of Medical Pharmacology, 6th ed, Jaypee Bros. Medical Publishers, 2009. p. 612-623. 4. Drug information online, www.drug.com, Pg. no. 1-36. 5. Berggrn J., Alderborn G., Effect of drying on porosity and tabletting behaviour of cellulose pellets, Int. J. Pharma.2001 :227: 81-96.. 6. Santos H., Veiga F., Pina M. E., Souna J. J., Compaction, compression and drug release characteristics of xanthan gum pellets of different compositions; Euro. J. Pharma Sci., P. 271-281. 7. Raymond C.R., Paul J.S. Handbook of Pharmacetical Excipients. 4th ed, Pharmaceutical press, P.323 – 332. 8. Martin A., Swarbrick J., in Physical pharmacy, 3rd ed K.M.Verghese Company, Mumbai, 1999, p. 423-476. 9. Agrawal S.P., khanna R., Physical pharmacy, 2nd ed., CBS publishers and distributors new delhi. Bangalore, 2006. p.17-46. 10. Mazzo David J. Obetz C.L., Shuster J. ‘Simvastatin’; In: Klaus Florey’s, Analytical Profiles of Drug Substances and Excipients, Volume 23, p. 359-372. 11. Mehta A.M., Issac Ghebre-Sellassie eds., Pharmaceutical Pelletization Technology, 1989, 37. Marcel Dekker inc, 241-264. 12. Lachman Leon, Liberman H. A. and Kanig J.L., The Theory and Practices of industrial pharmacy. 3 rd ed, Varghese publishing House, P. 430-456. 13. USP 24 NF 19, C, Asian ed 1991, P.1521-1526. 14. Wang L.,Asgharnejad M., Second-derivative U V spectrometric determination of Simvastatin in its tablet dosage form, J. of Pharma. and biomedical Analysis 2000:21: P. 1243-1248. 15. Newton J.M., Blanque D., Sternagel H., Podczeck F., Some factors influencing the formation and in vitro drug release from matrix pellets prepared by extrusion/spheronization, Int. J. of Pharma. 1995: 119 :P.203-211. 16. Korsmeyer.R.W, Gurny.R, Doelker.E, Bur.P and Peppas .N.A, Int. J. of Pharmacy, 1983:15:p. 25-35. 17. Ritger PL, Peppas NA; Journal of controlled release, 1987: 5: P. 23-36. 18. Raghavendra Kumar Gunda, J.N. Suresh Kumar, V. Satyanarayana, K.V. Ramanjaneyulu, B. Satya Prasad. Formulation development and evaluation of carvedilol phosphate gastro retentive floating tablets. Int. Res. J. Pharm. 2016;7(1):44-51 http://dx.doi.org/ 10.7897/22308407.0718 Cite this article as: Suvarna Hause, Sachin Mitkare, Priyanka Patil. Reddy. Studies on compression and drug release characteristics of xanthium gum pellets of different compositions. Int. Res. J. Pharm. 2016;7(4):46-53 http://dx.doi.org/10.7897/2230-8407.07437. Source of support: Nil, Conflict of interest: None Declared Disclaimer: IRJP is solely owned by Moksha Publishing House - A non-profit publishing house, dedicated to publish quality research, while every effort has been taken to verify the accuracy of the content published in our Journal. IRJP cannot accept any responsibility or liability for the site content and articles published. The views expressed in articles by our contributing authors are not necessarily those of IRJP editor or editorial board members.. 53.
(9)
Figure

+2
Related documents
Based on the idea, we have put forward novel routing strategies for Barrat- Barthelemy- Vespignani (BBV) weighted network. By defining the weight of edges as
The most important contributions of this paper are (i) the proposal of a concern mining approach for KDM, what may encourage other groups to start researching on
It was possible to improve the production process by applying the simulation technique, which shows that the general objective was achieved. Also, it was possible to
Results: Serum copper and zinc were elevated in asthmatic children compared to controls with no relation to clinical manifestations or laboratory parameters .Serum lead
B.: Congenital atresia of the inferior vena cava, common iliac veins, and left innominate vein; a case with extensive development of superficial venous col-
A conventional accounting ap- proach, and a four-input translog cost function and as- sociated share equations are used to estimate total and partial factor productivities, own
There are infinitely many principles of justice (conclusion). 24 “These, Socrates, said Parmenides, are a few, and only a few of the difficulties in which we are involved if
on deeply held misconceptions and fears of people who hold different beliefs, strategies of conceptual change theory, most often found in science education, were
