Phase Resolved X-Ray Spectral Analysis of Intermediate Polars
EX Hya and FO Aqr
Yakup Pekön1,aand ¸Sölen Balman1,b
1Physics Department, Middle East Technical University, Ankara
Abstract.Intermediate Polars (IPs): EX Hya and FO Aqr whichs are a subclass of
Cata-clysmic Variables (CVs) where a white dwarf with magnetic field strength of about 1-10 MG accretes material from a main sequence companion through a truncated disc. In this talk we present orbital and spin phase-resolved X-ray spectroscopy of EX Hya and orbital phase-resolved X-ray spectroscopy of FO Aqr. We utilize XMM-Newton archive data of these objects for analysis. We investigate the change of the source spectrum over the spin and orbital periods. This analysis enhances our understanding about the accretion struc-ture in these systems, temperastruc-ture and composition of the X-ray emitting region together with the structure of the outer accretion disc and absorption in the system
1 Introduction
Intermediate Polars (IPs) are a subcategory of Cataclysmic Variables (CVs) where a white dwarf accretes Hydrogen rich material from the Roche-lobe filling main sequence companion. Since the white dwarf in the system has magnetic field strength of about 1-20 MG, the accretion happens through a truncated disc to the magnetic poles of the white dwarf via accretion curtains. The X-ray emission arises from the end of the accretion curtains near the surface of the WD, where the accreting material forms a strong shock, and the post shock region heats up to 10-20 keV and then cools via thermal Bremsstrahlung. IPs are asynchronous systems where the orbital period of the system Porbis larger
than the spin period of the white dwarf Pspin. Typically, most of the IPs have Pspin/Porb<0.1.
X-ray spectra of IPs are well characterized by high complex absorption in their which extends, where the spectra are available in some cases, out to 100 keV. They show modulation of the X-ray and/or optical light curves at Pspinand the appearance of the beat period (where 1/Pbeat=1/Pspin- 1/Porb) or its
sidebands. The hardest X-ray emission comes from the cooling post-shock region of IPs rather than Polars, since the strong magnetic field of Polars causes the cyclotron cooling to dominate the cooling post-shock region suppressing the Bremsstrahlung emission ([1]; [2]; [3]; [4]; [5]; ).
2 EX Hya
EX Hya is an unusual IP with an orbital period of 98 minutes and white dwarf spin period of 67 min-utes. Having a high inclination, it shows a partial eclipse in its light curves over the orbital period. The
ae-mail: [email protected] be-mail: [email protected] DOI: 10.1051/
C
Owned by the authors, published by EDP Sciences, 2014 ,
/
07004 (2014) 201
64
epjconf EPJ Web of Conferences
46407004
0 0.5 1 1.5
35
40
45
Count/sec
Phase
0.02 0.04 0.06
nH
10
2 5
LowT
0.5 1 1.5
20
HighT
Phase
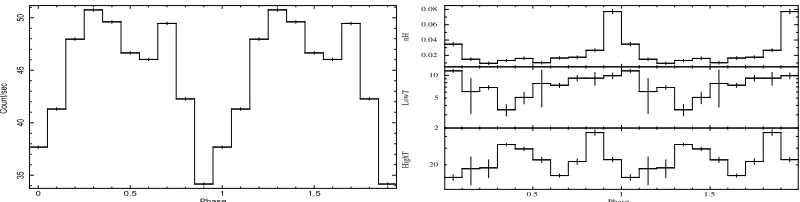
Figure 1.The light curve of EX Hya for the year 2000 data folded over the orbital period on the left and plots of
the spectral parameters derived from the orbital phase-resolved spectroscopy over the same orbital phase range on the right.
source is suggested to have an extended bulge on the outer accretion disc and extended/overflowing material originating from the hot spot. The X-ray spectrum of the post shock emission of EX Hya has been previously modeled with multi-temperature plasma emission models. One example uses four optically thin plasma emission models at four different temperatures ([8]). Another approach uses a cooling- flow model (MKCFLOW) assuming a multi-temperature thermal plasma emission with a relatively flat emission measure distribution indicating cooling gas from a steady-state condition. ([9]).
Two different archival observations of EX Hya obtained with XMM Observatory were used in this study. The first one was conducted on 01 July 2000 (OBS ID: 00111020101) with 30 ksec exposure time and the second one on 11 January 2003 (OBS ID:0057740301) with 57 ksec exposure time. For both observations, the standard pipeline processed data was used to perform the spectral and temporal analysis using the XMM Science Analysis Software SAS version 8.0.0 (See [6] for details)
Before phase resolved spectral analysis, a composite model was formed in order to fit the average spectra for 2003 and 2000 data. The model consists of two plasma emissions (MEKAL), a cooling flow emission (VMCFLOW), two cold absorbers and various Gaussian lines (See [6]). When the fits were compared from 2000 to 2003, the cooling flow temperature distribution increased, absorption decreased but the covering fraction increased.
For orbital phase resolved analysis, the light curve of the source was folded over the orbital period, and 10 spectra were extracted for each 0.1 orbital phase bin. The extracted spectra were fitted with the composite model and the variations of fit parameters over the orbital period were investigated for both 2000 and 2003 data. On both years the absorption column increased during the eclipse, indicating that the orbital modulation is due to absorption. In 2003 data there is also a clear modulation on the temperatures, so that the spectrum hardens during the orbital minimum flux. In 2003, there also exists 6.4 keV Fe line visible only during the orbital minimum phases, which may indicate reflection from the structures on the disc.
10−3
0.01 0.1 1 10
normalized counts s
−1 keV
−1
1
0.5 2 5
−2 0 2 χ Energy (keV) 10−3 0.01 0.1 1
normalized counts s
−1
keV
−1
1
0.5 2 5
−2 0 2
χ
Energy (keV)
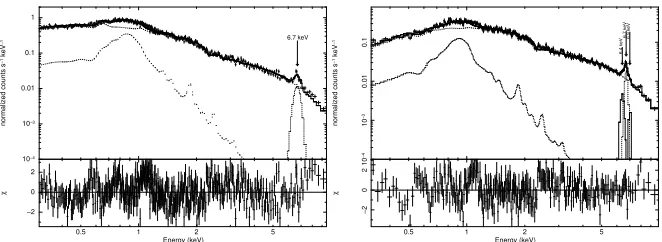
Figure 2.The left panel shows the composite model fitted to the spectrum of EX Hya at orbital maximum (phase
0.3) and the left panel shows the same composite model fitted to the spectrum of the orbital minimum (phase 0.9) for the year 2000 data.
0 0.5 1 1.5
5 6 7 8 9 Count/sec Phase 0.05 0.1 0.15 nH 10 20 30 LowT
0.5 1 1.5
100
50
HighT
Phase
Figure 3.The light curve of EX Hya for the year 2003 data folded over the orbital period on the left and plots of
the spectral parameters derived from the orbital phase-resolved spectroscopy over the same orbital phase range on the right.
10−4
10−3
0.01 0.1 1
normalized counts s
−1 keV
−1
6.7 keV
1
0.5 2 5
−2 0 2 χ Energy (keV) 10 −4 10 −3 0.01 0.1
normalized counts s
−1 keV
−1
6.4 keV
6.7 keV 6.9 keV
1
0.5 2 5
−2
0
2
χ
Energy (keV)
Figure 4.The left panel shows the composite model fitted to the spectrum of EX Hya at orbital maximum (phase
0.4) and the right panel shows the same composite model fitted to the spectrum of the orbital minimum (phase 0) for 2003 data.
3 FO Aqr
spectrum of the source can be represented with a complex absorption, multiple plasma emission and Gaussian lines (See [7] and references therein)
Fo Aqr was observed with XMM-Newton on 12 May 2001 for 35 ks and after standard pipeline was followed for data preparation, EPIC pn data was utilized since it has a better sensitivity. Standard tools and packages such as SAS, XRONOS and XSPEC were used in order to perform the spectral and timing analysis (See Pekon & Balman 2012 for full analysis).
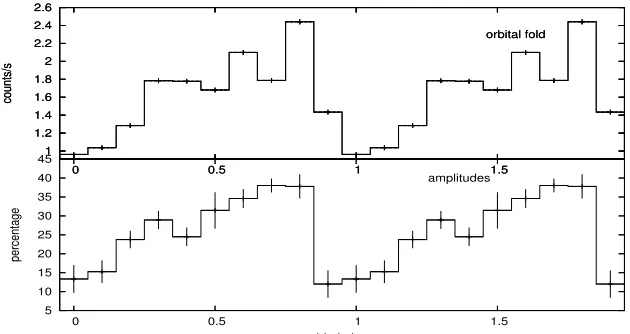
For the purpose of investigating the variations in spin pulse shape over the orbital phase, light curves from each 0.1 phase interval over the orbital period were extracted then folded these over the spin period. Each orbital-phase bin consists of 1745.8 s, greater than spin period, so that at least one pulse is contained in a bin. Generally, all the spin pulse shapes are similarly sinusoidal and each has minimum flux at around phase 0.8. We made a comparison of the orbital phase resolved spin pulse amplitude changes with the orbital folded light curve. Spin pulse in each orbital bin was fitted with a simple sine curve, and percentage variations of semi-amplitudes of the sine fit was plotted against the orbital phase. The semi-amplitude variations change from (13.3±3.7)% at the orbital minimum to (38.0±1.8)% at the orbital maximum.
5 10 15 20 25 30 35 40 45
0 0.5 1 1.5
percentage
orbital phase
amplitudes 1
1.2 1.4 1.6 1.8 2 2.2 2.4 2.6
0 0.5 1 1.5
counts/s
orbital fold
1 1.2 1.4 1.6 1.8 2 2.2 2.4 2.6
0 0.5 1 1.5
counts/s
orbital fold
Figure 5.The amplitude variation of the spin pulses (below), and orbital flux variation (above) for FO Aqr.
In order to investigate the spectral modulations of the system over the orbital period, we extracted spectra for each 0.1 orbital phase interval from the data. We fitted the composite spectral model intro-duced in [10] to each phase resolved spectra. The composite model have various components such as a cold absorption column (wabs), two partial covering absorption columns (pcfabs); plasma emission
models at three different temperatures (mekal) and an emission line (Gaussian) at 6.4 keV (Fe Kα). From this phase resolved analysis, a clear correlation of the spectral components with the orbital phase flux was observed. One of the three components of the plasma emission showed spectral hardening during the orbital minima; and one of the absorption components showed significant increase in the absorption column during the orbital minima. These findings indicate the presence of absorption from the structures on the disc.
0.5 1 1.5 2
0
20
40
60
80
100
kT3
(keV)
phase
0.5 1 1.5 2
5
10
15
20
NH
2 (10
22 cm −22)
phase
Figure 6.The variation over the orbital period of FO Aqr of kT parameter for one of the emission components
on the left; and nH parameter for one of the absorption components on the right.
1 10
0.5 2 5
10
−4
10
−3
0.01
0.1
normalized counts s
−1
keV
−1
Energy (keV)
1 10
0.5 2 5
10
−4
10
−3
0.01
0.1
normalized counts s
−1
keV
−1
Energy (keV)
Figure 7. The orbital-phase resolved spectra of FO Aqr for each 0.1 phase bin interval. The left-hand panel
shows phases 0.8 (green) 0.9 (dark-blue), 0.0 (red), 0.1 (black) and 0.2 (light-blue). The right-hand panel shows the phases 0.8 (purple-pink) and the rest of the phases 0.3-0.7. Notice the spectral differences on the left-hand side during orbital minima and how the spectra are different for the rest of the phases.
order to investigate this feature we have extracted two spectra from orbital maximum and minimum regions (phases between 0.55-0.85 and 0.9-1.2 respectively), and fitted them with the composite model this time replacing the second partial covering absorber and one of the plasma emission components with a warm absorber model (i.e. warmabs model implemented intoxspec). The fit to the orbital minima and maxima yielded results withχ2
ν of 1.39 and 1.24; with values of NH =2.09+−01..98091022
cm−2 and 0.56+0.26
−0.15 ×10
22 cm−2; and log(ξ)=0.23+0.37
−0.26and<0.30 erg cm s
−1, respectively. HereN H
is the equivalent hydrogen column density of ionized absorption andξ = L/ner2 is the ionization
parameter where L is the luminosity of the ionizing source,nethe electron density of the plasma and
r the distance between the absorber and the ionizing source. The fitted spectra of the orbital minima and the model is presented in Figure 6.
4 Summary
We have presented a summary of phase resolved spectral analysis performed for two IPs. This phase resolved analysis is especially useful for IPs in order to determine the accretion geometry, absorption features and detailed underlying emissions components for such complex objects.
0.01 0.1
normalized counts s
−1 keV
−1
1 10
0.5 2 5
−2 0 2
χ
Energy (keV)
1 10
0.5 2 5
10
−6
10
−5
10
−4
Photons cm
−2 s −1 keV
−1
Energy (keV)
Figure 8. The composite spectral fit for FO Aqr including a warm absorber fitted to the spectrum at orbital
minima of the source (phases between 0.9 and 1.2) is shown on the left. On the right, a plot of the composite model alone without the data is presented.
the disc. The spin variations confirm the absorption arising from the curtains. And the spectral differences between 2000 and 2003 indicate the source getting harder over the years, and absorption is lower and the accretion curtain is more spread out. Hence the accretion mode of the system changed over the years.
For FO Aqr we have presented X-ray orbital-phase resolved analysis of the intermediate polar FO Aqr. The distinction between the absorbing components are clarified and the values are explicitly calculated. The absorption originating from the polar regions of the white dwarf can be resolved from the absorption by structures on the accretion disk. The shape of the spin pulse profile is unaffected by the orbital motion, however the semi-amplitude of the profile change over the orbital phase. The X-ray orbital variation over the orbit in the system arises from absorption by the bulge material on the disk spread well over the disk. Moreover, we have modeled the absorption from the orbital dip with a warm absorber model for the first time for this source and also for CVs, confirming the ionized nature of the material on the disk causing the absorption.
References
[1] Balman ¸S, Memorie della Societa Astronomica Italiana83, 585 (2012) [2] Patterson J., PASP106, 209 (1994)
[3] Hellier C., Cataclysmic Variables and Related Objects, Evans A., Wood J.H., eds, Kluwer Academic Publishers, Dordrecht, (1996) p. 143
[4] de Martino D. et al., A&A,481, 149 (2008)
[5] Brunschweiger J., Greiner J., Ajello M., and Osborne J., A&A,496, 121 (2009) [6] Pekön Y., Balman ¸S., MNRAS,411, 1177 (2011)
[7] Pekön Y., Balman ¸S., AJ,144, 53 (2012)
[8] Allan A., Hellier C., Beardmore A., MNRAS,295, 167 (1998)