O R I G I N A L R E S E A R C H
Enhancing Slow Oscillations and Increasing N3
Sleep Proportion with Supervised,
Non-Phase-Locked Pink Noise and Other Non-Standard
Auditory Stimulation During NREM Sleep
This article was published in the following Dove Press journal: Nature and Science of Sleep
Margeaux M Schade1,* Gina Marie Mathew1,* Daniel M Roberts2 Daniel Gartenberg2
Orfeu M Buxton 1
1Biobehavioral Health, Pennsylvania State
University, University Park, PA, USA;
2Proactive Life, Inc., New York, NY, USA
*These authors contributed equally to this work
Purpose:In non-rapid eye movement (NREM) stage 3 sleep (N3), phase-locked pink noise
auditory stimulation can amplify slow oscillatory activity (0.5–1 Hz). Open-loop pink noise auditory stimulation can amplify slow oscillatory and delta frequency activity (0.5–4 Hz). We assessed the ability of pink noise and other sounds to elicit delta power, slow oscillatory power, and N3 sleep.
Participants and Methods: Participants (n = 8) underwent four consecutive inpatient
nights in a within-participants design, starting with a habituation night. A registered poly-somnographic technologist live-scored sleep stage and administered stimuli on randomized counterbalanced Enhancing and Disruptive nights, with a preceding Habituation night (night 1) and an intervening Sham night (night 3). A variety of non-phase-locked pink noise stimuli were used on Enhancing night during NREM; on Disruptive night, environ-mental sounds were used throughout sleep to induce frequent auditory-evoked arousals.
Results:Total sleep time did not differ between conditions. Percentage of N3 was higher in
the Enhancing condition, and lower in the Disruptive condition, versus Sham. Standard 0.8 Hz pink noise elicited low-frequency power more effectively than other pink noise, but was not the most effective stimulus. Both pink noise on the “Enhancing” night and sounds intended to Disrupt sleep administered on the “Disruptive” night increased momentary delta and slow-wave activity (ie, during stimulation versus the immediate pre-stimulation period). Disruptive auditory stimulation degraded sleep with frequent arousals and increased next-day vigilance lapses versus Sham despite preserved sleep duration and momentary increases in delta and slow-wave activity.
Conclusion: These findings emphasize sound features of interest in ecologically valid,
translational auditory intervention to increase restorative sleep. Preserving sleep continuity should be a primary consideration if auditory stimulation is used to enhance slow-wave activity.
Keywords:electroencephalographic spectral analysis, neurobehavioral performance,
slow-wave sleep, sleep fragmentation, delta power, slow oscillation
Plain Language Summary
Deep sleep, considered the most restorative stage of sleep, decreases with advancing age. This work demonstrates the potential utility of auditory stimulation, not precisely timed to brain wave activity, to increase deep sleep among mid-life adults. Both pink noise (less high-frequency content than white noise) on an“Enhancing”night and sounds without standard Correspondence: Orfeu M Buxton
The Pennsylvania State University, 221 Biobehavioral Health Building, University Park, PA 16802, USA
Tel +1 814 867-5707 Email [email protected]
Nature and Science of Sleep
Dovepress
open access to scientific and medical research
Open Access Full Text Article
Nature and Science of Sleep downloaded from https://www.dovepress.com/ by 118.70.13.36 on 27-Aug-2020
pink noise features administered on a “Disruptive” night pro-duced increases in momentary slow-wave brain activity, charac-teristic of deep sleep. Alerting sounds, such as an IV alarm, were momentarily effective in increasing slow-wave activity, but the all-night proportion of deep sleep (versus a Sham control night) increased only on the Enhancing night. After the Disruptive night, next-day attention performance was impaired (versus Sham) despite preserved sleep duration and momentary increases in slow-wave activity. The current work indicates the potential utility of auditory stimulation presented below the arousal thresh-old to increase restorative deep sleep without the need for precise timing of sounds to brain waves. Preserving sleep continuity should be a primary consideration if auditory stimulation is utilized to enhance slow-wave activity and deepen sleep.
Introduction
Auditory stimulation during sleep can increase the power of delta-frequency electroencephalographic (EEG) activity by either eliciting K-complexes or increasing amplitude in the low-frequency spectral range.1,2Auditory stimulation administered both in phase with endogenous delta activity (“phase locking”with EEG detection) and without phase locking (“open-loop”) enhances slow oscillatory (SO; 0.5– 1 Hz) power, while the phase-locked effect on broader delta-frequency power (0.5–4 Hz) is equivocal.3–6 Whether low-frequency activity is ontogenically or neuro-chemically similar to that in endogenous non-rapid eye movement (NREM) stage 3 (N3) sleep is not yet eluci-dated, but evoked SO waves demonstrate similar electrical field topography as those produced endogenously.4
The non-phase-locked, open-loop approach to auditory stimulation has a translational advantage in ultimate ecolo-gical implementation, because of phase locking’s EEG requirement. Open-loop stimulation literature is sparse partly because auditory stimulation synchronous with the SO up-state is the more effective elicitor of momentary SO power,4despite the marginal or suppressive effect of phase-locked stimulation on broader-spectrum delta activity that occurs during deep sleep.3,4Open-loop stimulation that is supervised and limited to N3 sleep fails to improve word pair memory,6 which was observed in phase-locked studies,4,5 but open-loop stimulation can elicit a modest increase in N3 sleep proportion4,6 in addition to both SO and delta enhancement.6This N3 and transient power spec-tral increase is accomplished when open-loop stimulation is constrained to the early sleep period.6With such open-loop constraints to endogenous deep sleep, and phase-locked constraints to endogenous SO activity, it remains unclear
how auditory-induced low-frequency enhancement might improve sleep architecture on the whole where other non-auditory stimulus modalities have been successful.7 The viability of open-loop stimulation in thefield is dependent upon not only the magnitude of the effect, however, but also of open-loop’s tolerability and ability to preserve sleep qual-ity (eg, to not induce awakenings).
Sleep fragmentation reduces behavioral, physiologic, and perceived restoration by sleep.8Phase-locked auditory stimulation appears to preserve microarousal frequency,9but impact on sleep continuity remains unreported for auditory open-loop approaches where sleep disruption is more likely. Sleep architecture (the distribution of sleep stages and wake-fulness) appears largely unaffected by auditory intervention,10–14 excepting one study15 that improved sleep efficiency. However, microarousals (as defined in part by their brevity) do not always lead to neurocortical waking activity of≥15 sec, and therefore may not lead to increases in wake time even if frequent.16,17
The ability of a sound to produce sleep disruption varies by pressure level (ie, loudness), threat valence, and sleep stage during presentation.18 Pink noise, timed to coincide with up-states of SO activity, is the only auditory stimulation reported to enhance SOs.3,4,6,14,19The extent to which envir-onmental or noise pollution effects might differ from those of low-frequency enhancing audio, either momentarily or across a whole night, is unclear.
We aimed to replicate open-loop stimulation’s momen-tary enhancement of both delta- and SO-frequency activ-ity, and to evaluate the specificity of auditory stimulus characteristics, by exploring whether momentary increases in low-frequency activity could be accomplished with a wider variety of stimulation types (including variants of pink noise and ecological sounds that might otherwise be considered noise pollution). We further evaluated supervised, non-phase-locked stimulation’s proclivity to disrupt sleep continuity (including microarousals) while pushing the boundaries of N3 enhancement by delivering stimulation throughout NREM stage 2 (N2) and N3. Finally, we evaluated next-day psychomotor vigilance.20,21
Participants and Methods
Participants
Participants were recruited through the University’s publicly available online research recruitment webpage, withflyers, and using word of mouth. Healthy adults between 35–50 with an auditory pure-tone detection threshold of no greater
Nature and Science of Sleep downloaded from https://www.dovepress.com/ by 118.70.13.36 on 27-Aug-2020
than 30 decibels sound-pressure level (A-weighted, dBA) were eligible to enroll. Chronic or acute medical conditions requiring use of medication with reasonable likelihood to interfere with sleep or circadian structure (eg, chronobiologic disorders, sleep disorders, diseases of the cardiovascular system, disorders of the respiratory system, disorders of the kidney and urinary tract, infectious diseases, disorders of the gastrointestinal system, disorders of the immune system, disorders of the connective tissue/joints, disorders of the hematopoietic system (including anemia), endocrine and metabolic diseases, neurological disorders, prior brain trauma/injury, and conditions that prevent safely walking without assistance), smoking (within the past year), nocturnal shift work (within the last 6 months), travel more than 3 time zones outside of Eastern (within the last 3 months), or illicit recreational substance use warranted exclusion.
Screening
All participants provided written informed consent. All procedures were conducted in accordance with the Declaration of Helsinki and the protocol was IRB approved. Initial screening was conducted to evaluate typical participant sleep for a minimum of four nights at home using a sleep diary and wrist actigraphy (Spectrum/ Plus, Philips-Respironics, Murrysville, PA) and a pulse oximeter (Nonin Medical, Plymouth, MN). Physical exam and medical history were obtained by a physician or nurse practitioner at follow-up screening. Nocturnal oxygenation fluctuations that resulted in substantial time spent below 88% and ≥5 oxygen fluctuations per hour warranted exclusion, although no participants met these criteria.
Protocol
For each of the 3 nights before lab admission, participants received instruction to sleep for 8 hrs or their average sleep duration, whichever was longer (corroborated by actigraphy) and refrained from caffeine and alcohol. No data were excluded for non-adherence. Details about habi-tual, pre-inpatient, and inpatient sleep measured by acti-graphy are inSupplementary Table S1.
Participants reported to the Clinical Research Center at the Pennsylvania State University main campus. No partici-pants were excluded on the basis of urine toxicology, pro-vided on arrival. Participants were instrumented with polysomnography monitoring equipment (PSG; TrackIt MK3, v.2.8.0.8, Lifelines Neurodiagnostic Systems Inc., Nr. Stockbridge, UK; Polysmith, v.10.0 build 7422 and
7956, Neurotronics Inc. - Nihon-Kohden America, Irvine, CA). The AASM-compliant16,17 PSG-EEG montage included exploratory electrode sites F3/4, C3/4, O1/2, and reference electrode sites M1/2 and Cz. A ground electrode at FPz, 2-lead EKG, bilateral anterior tibialis EMG, right and left EOG, 3-lead (2 bilateral exploratory/1 reference) menta-lis/sub-mentalis EMG, and an additional Fz exploratory elec-trode were also included. Data were sampled at a rate of 200 Hz, with impedances, display sensitivity, and frequencyfi l-ters consistent with clinical recommendations16,17(7µV/mm EEG and 10µV/mm EMG; .03 Hz HPF and 35 Hz LPF on EEG/EOG channels, and 10 Hz HPF and 100 Hz LPF on EMG channels). Earbuds were connected to an iPhone (Supplementary Figure S1) with audio controlled by staff outside the participant’s sound-attenuated, light-restricted room. Between arrival in the laboratory and scheduled bed-time (22:30–23:30), participants completed cognitive assess-ments. Participants were scheduled for 9 hrs sleep opportunity each night. Outside of the scheduled sleep oppor-tunity, participants were not permitted to nap, sit, or recline in bed.
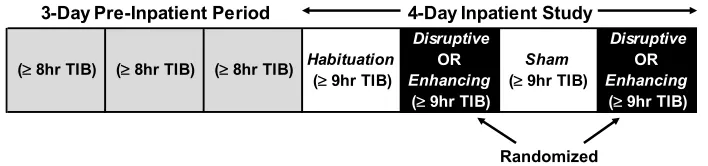
A temporally-aligned auxiliary stimulus channel was included in the PSG montage to record and display, in real time, stimulus delivery. Pink noise was played through the earbuds worn by participants each night prior to bedtime and again after awakening each morning to blind partici-pants to study condition. Two auditory intervention condi-tions (Disruptive and Enhancing), preceded by an acclimatization night (Habituation) and separated by a Sham night, were administered in a randomized counter-balanced order (study protocol inFigure 1).
Auditory Stimulation
The registered polysomnographic technologist (RPSGT, MMS) identified sleep stages in real time and systemati-cally presented participants with sequences of auditory stimuli during sleep on the Disruptive and Enhancing nights. Within an auditory stimulation sequence, each sti-mulus was presented for up to 10 sec, separated from the previous stimulus in the sequence by 5 sec (inter-stimulus interval of 15 sec). Each stimulus could be presented at one of 9 presentation levels, from 15–55 dBA. Stimulation was initiated at 15 dBA. The RPSGT immediately paused sound presentation when an arousal or awakening was detected. Decision-making sound delivery algorithms spe-cific to each study condition are in Supplementary Figure S2.
Nature and Science of Sleep downloaded from https://www.dovepress.com/ by 118.70.13.36 on 27-Aug-2020
Within the Disruptive condition, stimuli were adminis-tered in an attempt to induce a minimum of two sequential arousals17or maximum of a brief awakening. Presentation loudness increased with each stimulus in a sequence, with each sequence continuing until either the sequence was com-pleted (maximum of 9 stimuli) or the RPSGT detected evi-dence of a sleep disruption (see “Polysomnography processing”section in Supplementary Informationfor dis-ruption criteria). The Disruptive condition included four sounds intended to vary in their degree of salience for response urgency: an intravenous pump machine alarm, a physician being paged by surname, a jetflying overhead, and ocean waves.18Stimuli were presented during stages N2, N3, and REM.
Within the Enhancing condition, stimuli were adminis-tered in an attempt to evoke sustained delta wave enhance-ment during stages N2 and N3 and to reduce the number of sleep disruptions related to sound presentation. The RPSGT set a maximum dBA presentation loudness for stimuli (maximum of 12 stimuli per sequence in the Enhancing condition), which was adjusted throughout the night and was based on the most recent dBA level that induced a disruption (eg, maximums were generally 5 dBA lower than those observed to consistently cause dis-ruption in previous presentation). The Enhancing condi-tion included six sound variacondi-tions previously reported to enhance SO activity,3,4 here referred to as “0.8 Hz pink noise,”composed of pink noise 50 ms in duration with 5-ms linear onset and offset ramps. Within each 10-sec sound presentation, the 50-ms bursts were repeated every 1.25 sec, yielding a 0.8 Hz presentation rate. Two varia-tions were constructed with pitched elements (“Hi” and
“Low”) by replacing the pink noise with an equal mix of pink noise and a sine wave, with the sine wave frequency set to either 800 or 1200 Hz. A third variation was con-structed by amplitude-modulating pink noise with a 0.4 Hz sine wave (0.8 Hz pulsing). Within the Enhancing condi-tion, the 10th stimulus in each sequence was one of two
“variants” on the inter-stimulus interval. Variants were presented at the same sound pressure level as other stimuli, with 50-ms pulse duration, but the inter-stimulus interval was either randomly shorter (uniform distribution between 125−500 ms) or longer (uniform distribution between 2–5 sec). Additional auditory stimulation delivery details are available inSupplementary Information, the characteristics of each stimulus are available inSupplementary Figure S3, and a general schematic of stimulus administration based on sound type, sleep stage, and study condition is in Supplementary Table S2.
Psychomotor Vigilance Task (PVT)
Participants completed a neurobehavioral task battery (Joggle Research®; www.admin.joggleresearch.com) approximately every 3 hrs during scheduled wake time, including a 10-min psychomotor vigilance test (PVT) assessing sustained attention based on reaction time (RT) to stimuli with random inter-stimulus intervals ranging from 2–10 sec. For each neurobehavioral test, participants were seated at the same desk in a quiet room and com-pleted the test on a touchscreen tablet. The tablet rested on a stand that was angled at approximately 120° and was 32 cm from the desk edge. Participants were continuously monitored to ensure adherence and to document test validity.
Subjective Sleep Measures
Within 1 hr of wake in the morning following each inpa-tient night, participants completed a short sleep survey, the Post-Sleep Questionnaire (PSQ). Participants were asked to report,“How long do you think it took you to fall asleep last night?”(in hours and minutes),“How many times did you wake up during the night?”, and“How much sleep do you think you got last night?”(in hours and minutes). On a 7-point Likert scale, participants were also asked to rate,
“How would you evaluate your sleep last night?” (1, Extremely bad; 7, Extremely good),“How sleepy do you
(≥ 8hr TIB) (≥ 8hr TIB) (≥ 8hr TIB) Habituation (≥ 9hr TIB)
Disruptive
OR
Enhancing
(≥ 9hr TIB)
Sham (≥ 9hr TIB)
Disruptive
OR
Enhancing
(≥ 9hr TIB)
3-Day Pre-Inpatient Period 4-Day Inpatient Study
Randomized
Figure 1Study protocol. Abbreviations; TIB (time in bed).
Nature and Science of Sleep downloaded from https://www.dovepress.com/ by 118.70.13.36 on 27-Aug-2020
feel right now?” (1, Not sleepy at all; 7, Extremely sleepy), and “How refreshed do you feel right now?”(1, Not refreshed at all; 7, Extremely refreshed).
Polysomnography (PSG) and Actigraphy
Processing
PSG data were staged and scored for neurocortical dis-ruptions by an RPSGT (MMS) blinded to auditory sti-mulation information (and thus blinded to condition). The arousal index included both American Academy of Sleep Medicine (AASM)-qualifying17 microarousals and awakenings, and reflected disruption of the sleep stage during which an arousal began. Neurocortical arousal in response to auditory stimulation typically occurs at a latency of 5.6 sec, with arousals out of NREM occur-ring slightly earlier than arousals out of REM.22 To avoid overlap with the next scheduled stimulus, sleep disruptions beginning within 15 sec following onset of an auditory stimulus were considered associated with that stimulus. Arousal index included both spontaneous and induced arousals. Among nights across all partici-pants, unscorable data resulted in one night of data loss (Habituation night, not included in analyses).
Average actigraphy sleep duration was determined according to a previously described algorithm using 15-sec epochs of movement count.23 Consecutive low-movement epochs were used to approximate sleep onset and awakening, and therefore sleep time each night. Actigraphy was corroborated with sleep diaries.
Delta Power Spectral Density
Delta (0.5–4 Hz) and SO (0.5–1 Hz) power spectral den-sity (PSD) were calculated across whole-night sleep over-all and also proximover-ally around each auditory stimulus on Enhancing and Disruptive nights. Spectral analysis was implemented using MATLAB (Natick, MA) in conjunc-tion with the EEGLAB toolbox and custom scripts.24EEG recordings were re-referenced to the average of the left and right mastoid electrodes. Electrode Fz was selected a priori for power analyses, as its location is sensitive to stimulation-induced low-frequency power changes.3
For whole-night delta and SO PSD, data were epoched into 30-sec periods corresponding to each RPSGT-labelled sleep epoch and then screened for artifact. Across the 24 nights used in this analysis, a mean of 0.84% (SD = 0.67%) sleep epochs were excluded. The mean base-10 logarithm (log10) delta and SO PSD were computed for
each participant within each study condition (Enhancing, Sham, and Disruptive) via the Welch method (MATLAB function“pwelch”; details inSupplementary Information). Specifically, PSD was extracted from each epoch by aver-aging the fast Fourier transform (FFT) bins corresponding to the frequency range of each frequency band (0.5–4 Hz for delta; 0.5–1 Hz for SO). Because the distribution of power values across epochs tends to be right skewed, PSD values for each epoch were subsequently transformed to the log10 of their original values, to more closely
approx-imate a normal distribution prior to averaging across epochs.25
For stimulation-proximal PSD change, data were epoched from −10–15 sec (“stimulus-locked”) around each auditory stimulus onset. Stimulus-locked epochs were screened for artifact using parameters similar to those in the analysis of whole-night PSD. Across the 16 stimulation nights used in this analysis, a mean of 1.14% (SD= 1.01%) stimulus-locked epochs per recording were excluded. Only stimuli that were immediately preceded by stage N2 or stage N3 were further analyzed. Additional artifact rejection, arousal association, and PSD processing details are inSupplementary Information.
Statistical Analyses
PSD, PSG, and subjective sleep analyses were conducted using IBM SPSS 25.0 (SPSS Inc., Chicago, IL). PVT analyses were conducted using SAS 9.4 (SAS Institute Inc., Cary, NC). All analyses were performed as 2-tailed tests and were interpreted using a statistical significance threshold of p < .05. Distributions met assumptions of normality (skew < |3|, kurtosis < |10|), and outliers (SD≥ |3|) were excluded on a case-wise basis. For linear mixed models (LMM), the decision to include a random effect to account for individual variation (Subject, with intercept) was determined for each model separately, based on a residual variance of at least 10% or a significant χ2 difference in Akaike information criterion corrected for small sample size (AICC) between mixed/standard models
(maximum likelihood). Order and interaction effects were dropped from LMMs in the absence of a significant χ2 difference in AICC to achieve model parsimony and to
retain maximal power given the study’s small sample size.
Actigraphy Analyses
Actigraphy-scored total sleep time (TST) was compared between screening and pre-inpatient actigraphy data, and between pre-inpatient and inpatient actigraphy data,
Nature and Science of Sleep downloaded from https://www.dovepress.com/ by 118.70.13.36 on 27-Aug-2020
using paired-samples t-tests. Mean TST for screening data was calculated using the total number of valid nights available (between 4–7). All 3 pre-inpatient nights were included in mean TST for pre-inpatient data. Inpatient mean TST did not include the first night in the lab (Habituation).
Whole-Night PSD, PSG, and Subjective
Sleep Analyses
Delta and SO PSDs were averaged across all nocturnal recording epochs staged as sleep, irrespective of the pre-sence or abpre-sence of auditory stimulation. LMM analyses were used to conduct within-participants analyses between Sham and Disruptive or between Sham and Enhancing conditions. The study condition (Disruptive, Sham, or Enhancing), order of condition presentation (either Disruptive on night 2 or Enhancing on night 2), and an interaction between condition and order effects werefixed.
Momentary PSD Change Analyses
Power within each frequency range was calculated across all stimuli initiated during stages N2 and N3 within a study condition (Enhancing or Disruptive). The log10 delta and
SO PSD change from the pre-stimulation baseline to sti-mulation periods within each condition (Enhancing and Disruptive) was assessed using paired-samples t-tests. Differences in baseline PSD between conditions, and base-line-corrected changes in PSD between conditions, were assessed using paired-samplest-tests.
Momentary PSD Stimulus Analyses
To evaluate delta and SO PSD elicitation by individual sounds momentarily during sound presentation, LMM ana-lysis was used. The delta and SO power changes from pre-stimulation baseline (outcome) that were elicited by each individual stimulus, separated by sound type (fixed effect) relative to a sound of known efficacy (0.8 Hz pink noise), and net of changes in dBA level (random effect), were examined. Participant identity was also included in the model as a random effect.
Neurobehavioral Analyses
RTs ≥ 500 ms are considered lapses of attention, indi-cating reduced behavioral alertness (errors of omission).26 Median RT within each trial was analyzed due to the non-normal distribution of RT and included
lapses but not RTs < 100 ms, or false starts.27 PVT lapses and false starts were analyzed with generalized linear models using Poisson distribution. PVT continu-ous metrics (RT) were analyzed with LMM. Statistical tests on PVT outcome measures compared Disruptive and Enhancing conditions to Sham in separate analyses and included additional fixed effects for Time of Day and Condition*Time of Day.
Results
Participants
Eight participants (5 female) completed the full, 4-night protocol. One participant’s earbud rotated in their ear canal during the Disruptive condition; the individual’s data fol-lowed expected patterns for effective disruption and were retained. Post-hoc observation of the live-stimulation audi-tory channel revealed a technical issue that slightly trun-cated all auditory stimuli on 3 nights (2 Disruptive and 1 Enhancing night), such that the maximum stimulus length reached 9.2 rather than 10 sec; these data were also retained.
Participants were adherent in maintaining their typical sleep schedule during the pre-inpatient period relative to screening, according to actigraphy (p = .374, d = 0.34). Although scheduled for 9 hrs, actual sleep opportunity ran-ged from 8 hrs 41 mins to 9 hrs 13 mins on any given night (according to PSG, from“lights out”to“lights on”). Sleep opportunity on the Disruptive condition night was outlying for a single participant (8.7 hrs), but minutes of sleep oppor-tunity did not significantly differ between Disruptive and Sham (p = .315, b = −2.51) or between Enhancing and Sham (p= .514,b=−1.56) condition nights. There was no significant difference between inpatient and pre-inpatient TST according to actigraphy (p= .407,d= 0.31). For TST descriptive statistics during the screening, pre-inpatient, and inpatient periods, refer toSupplementary Table S1.
Whole-Night Low-Frequency Power
A similar overall number and frequency of stimuli were initiated during sleep between the Enhancing and Disruptive conditions (p = .423, d = 0.38 and p= .474, d = 0.35, respectively). Whole-night (restricted to sleep) log10 delta (0.5–4 Hz) and SO (0.5–1 Hz) PSD did not
differ between Enhancing (delta:M= 1.54,SD= 0.10; SO: M = 1.87, SD = 0.09) and Sham (delta: M = 1.57, SD = 0.11; SO: M = 1.89, SD = 0.11) conditions (delta:t(7) = 1.58, p= .158, d = 0.21; SO:t(7) = 1.64,p= .145, d =
Nature and Science of Sleep downloaded from https://www.dovepress.com/ by 118.70.13.36 on 27-Aug-2020
0.24), but were significantly lower within the Disruptive (delta: M = 1.49, SD = 0.16; SO: M = 1.79, SD = 0.16) condition versus Sham (delta: t(7) = 2.94, p= .022, d= 0.57; SO: t(7) = 2.30, p = .020, d = 0.77). Whole-night low-frequency power results are depicted in Supplementary Figure S4.
Momentary Low-Frequency Power
Between Conditions
Stimulation-proximal mean log10delta and SO PSD in both
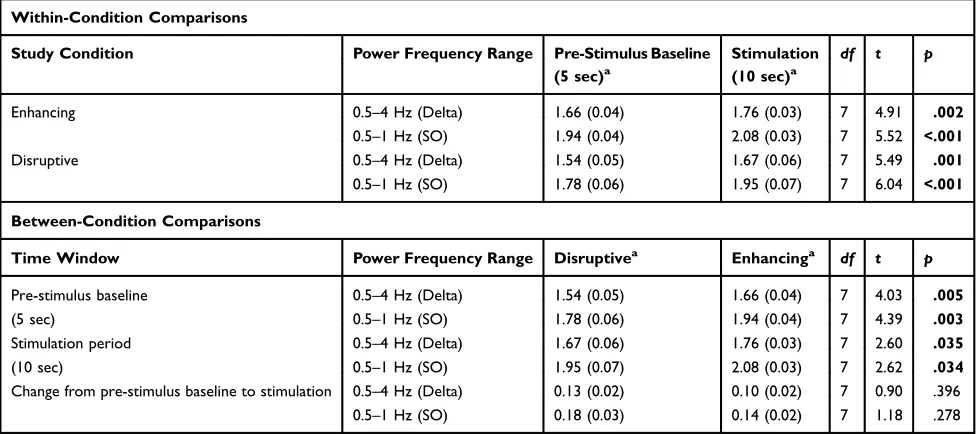
the Enhancing and Disruptive conditions were significantly greater during the 10-sec interval of auditory stimulation versus the 5-sec baseline period preceding auditory stimula-tion (delta:p= .001,d= 0.83 in Disruptive andp= .002,d= 1.00 in Enhancing, Table 1–upper panel,Figure 2A; SO: p= .0005,d= 0.92 in Disruptive andp= .0009,d= 1.40 in Enhancing;Table 1–upper panel,Figure 2B).
For both the stimulation and baseline periods, log10delta
and SO PSD were greater within the Enhancing condition, versus the Disruptive condition (delta: p= .035,d = 0.67 stimulation andp= .005,d= 0.94 baseline,Table 1–lower panel,Figure 2A; SO:p= .034,d= 0.85 stimulation andp= .003, d= 1.11 baseline, Table 1, upper panel, Figure 2B). However, the stimulation-proximal change from baseline in
log10 delta (d = 0.53) and SO (d = 0.55) PSD did not
significantly differ between Enhancing and Disruptive con-ditions (Table 1, lower panel).
Momentary Low-Frequency Power by
Stimulus, Relative to 0.8 Hz Pink Noise
The primary analysis was the momentary effect of a 0.8 Hz pink noise stimulus predominantly used in other audi-tory stimulation literature. Pink noise 0.8 Hz significantly increased delta (0.5–4 Hz) PSD from pre-stimulation base-line (5 sec;M= 1.66,SD= 0.13) to during the stimulation window (10 sec; M = 1.81, SD = 0.11; t(7) = 4.60, p= .002, d = 1.25). Pink noise 0.8 Hz also significantly increased SO (0.5–1 Hz) PSD from pre-stimulation base-line (M = 1.95,SD= 0.16) to during stimulation (10 sec; M= 2.13,SD = 0.12;t(7) = 4.68,p= .002,d= 1.27).
Net of the auditory stimulation sound pressure level (dBA), momentary PSD change analyses indicated a greater enhancing effect of a human-vocal paging announcement on delta (b= 0.14) and SO (b= 0.20) activity (bothp< .001) and a similar enhancing effect of IV alarm (delta and SO activity both n.s.) versus 0.8 Hz pink noise during NREM sleep. Other stimuli (ocean, jet, pink hi, pink lo, and pink sine) induced significantly smaller PSD change than thefield standard 0.8
Table 1Mean Log10Delta and Slow-Oscillatory Power Spectral Density Relative to Auditory Stimulation
Within-Condition Comparisons
Study Condition Power Frequency Range Pre-Stimulus Baseline Stimulation df t p
(5 sec)a (10 sec)a
Enhancing 0.5–4 Hz (Delta) 1.66 (0.04) 1.76 (0.03) 7 4.91 .002
0.5–1 Hz (SO) 1.94 (0.04) 2.08 (0.03) 7 5.52 <.001
Disruptive 0.5–4 Hz (Delta) 1.54 (0.05) 1.67 (0.06) 7 5.49 .001
0.5–1 Hz (SO) 1.78 (0.06) 1.95 (0.07) 7 6.04 <.001
Between-Condition Comparisons
Time Window Power Frequency Range Disruptivea Enhancinga
df t p
Pre-stimulus baseline (5 sec)
0.5–4 Hz (Delta) 1.54 (0.05) 1.66 (0.04) 7 4.03 .005
0.5–1 Hz (SO) 1.78 (0.06) 1.94 (0.04) 7 4.39 .003
Stimulation period (10 sec)
0.5–4 Hz (Delta) 1.67 (0.06) 1.76 (0.03) 7 2.60 .035
0.5–1 Hz (SO) 1.95 (0.07) 2.08 (0.03) 7 2.62 .034
Change from pre-stimulus baseline to stimulation 0.5–4 Hz (Delta) 0.13 (0.02) 0.10 (0.02) 7 0.90 .396
0.5–1 Hz (SO) 0.18 (0.03) 0.14 (0.02) 7 1.18 .278
Notes:Upper panel: mean log10delta (0.5–4 Hz) and slow-oscillatory (0.5–1 Hz) power spectral density within each study condition, during auditory stimulation (10 sec) relative to the 5-sec baseline period preceding stimulation. Lower panel: differences in power spectral density between Disruptive and Enhancing study condition nights, within the 5-sec pre-stimulus baseline period, 10-sec stimulus period, and the pre-stimulus to stimulation change. Power within a frequency range was calculated across all stimuli initiated during stages N2 and N3 within a study condition (Enhancing or Disruptive) and at all sound pressure levels.a
Mean (standard error of the mean).p-values in boldare interpreted as significant (p< .05).
Abbreviation:SO, slow oscillation.
Nature and Science of Sleep downloaded from https://www.dovepress.com/ by 118.70.13.36 on 27-Aug-2020
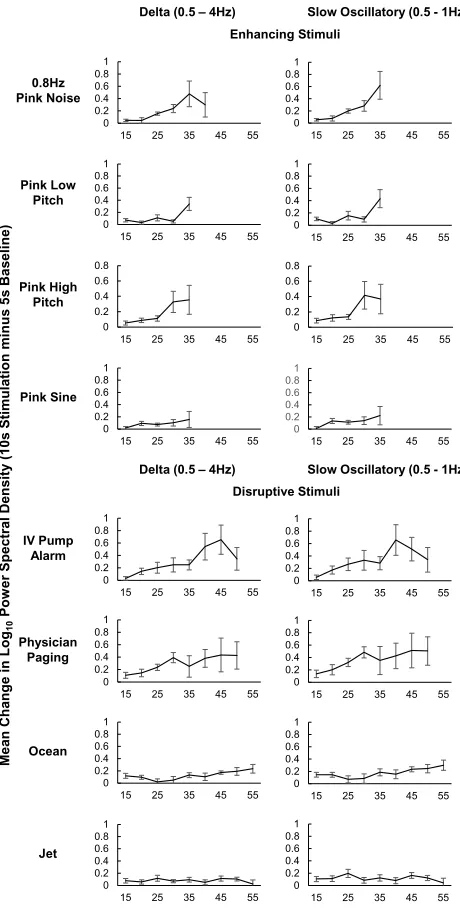
Hz pink noise for delta (ocean:b= -0.02; jet:b=−0.06; pink hi:b=−0.01; pink lo:b=−0.02; pink sine:b=−0.02; allp< .005) and SO (ocean:b= 0.01; jet:b=−0.04; pink hi:b= 0.02; pink lo:b=−0.004; pink sine:b=−0.01; allp≤.01) activity. See Supplementary Table S3 for the change in momentary delta and SO PSD across stimulus types,Figure 3for change by each stimulus type at different dBA levels, andTable 2for change by stimulus type, net of dBA.
Sleep Architecture and Continuity
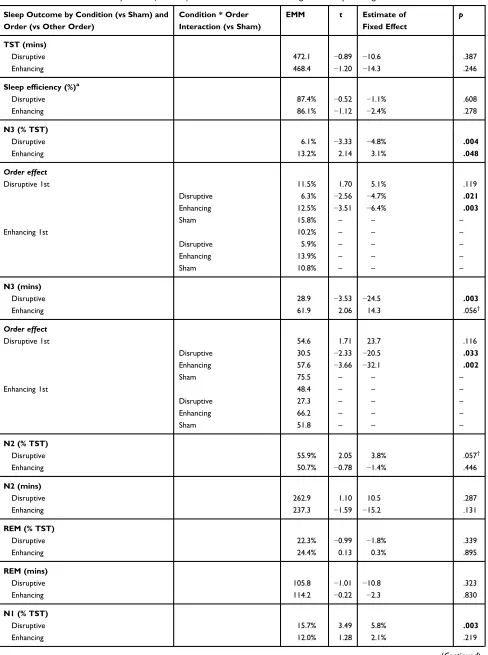
A summary of linear model details and omnibus outcomes for PSG is in Supplementary Table S4. Post-hoc pairwise comparisons are in Table 3. There were no differences in TST in Disruptive or Enhancing conditions versus Sham (between 7.2–8.8 hrs TST, Figure 4A) and sleep efficiency did not differ (76.4–96.4% sleep efficiency). The proportion of, and time spent in, N3 were both lower in the Disruptive condition than in the Sham condition (p= .004 andp= .003,
respectively; Figure 4A), particularly when the Disruptive condition was randomized to occur on night 2 (immediately following the first night, Habituation) instead of night 4 (immediately following the third night, Sham); see Figure 4B for percent differences in N3 sleep between the Disruptive or Enhancing condition nights and Sham night.
The percentage of N3 was higher in the Enhancing condition than in the Sham condition (p = .048, Figure 4A), but the greater time spent in N3 on the Enhancing night versus Sham was only marginally significant (p = .056). A significant order*condition interaction indicated that N3 was lower in the Enhancing condition relative to Sham only when the Disruptive condition was randomized to presentation on night 2 (immediately following thefirst night, Habituation) instead of night 4 (immediately follow-ing the third night, Sham; Figure 4B). N2 did not differ between Disruptive or Enhancing and Sham. Neither REM sleep quantity nor proportion differed from Sham in
*
0.0 0.5 1.0 1.5 2.0
5-Second Pre-Stimulus Baseline 10-Second Stimulation Period Mean Log10
Delta Power Spectral Density
Time Window
Disruptive
Enhancing
*
**
**
0.0 0.5 1.0 1.5 2.0 2.5
5-Second Pre-Stimulus Baseline 10-Second Stimulation Period Mean Log10
Slow-Oscillation Power Spectral
Density
Time Window
Disruptive
Enhancing
**
**
**
*
A
B
Figure 2(AandB) Mean log10delta (0.5–4 Hz;A) and mean log10slow-oscillation (0.5–1 Hz;B) power spectral density (PSD) within the 5-sec pre-stimulus baseline and 10-sec post-stimulus period, separately for auditory stimulation delivered within the Disruptive and Enhancing conditions. Auditory stimulations were included in analyses if delivered out of stages N2 and N3, did not lead to an arousal, and were not ended early by the experimenter. Within each condition, log10delta and slow-oscillation PSD in the post-stimulus period were significantly increased relative to the pre-stimulus period. In addition, during both the 5-sec baseline and the 10-sec stimulation period, log10 delta and slow-oscillation PSD in the Enhancing condition were greater than log10PSD in the Disruptive condition. Error bars represent standard error of the mean. *p< .05, **p< .005.
Nature and Science of Sleep downloaded from https://www.dovepress.com/ by 118.70.13.36 on 27-Aug-2020
Disruptive or Enhancing conditions. The proportion of, and time spent in, NREM stage 1 sleep (N1) were both lower in the Disruptive condition than in the Sham condi-tion (p= .003 and p= .002, respectively;Figure 4A), but were retained in the Enhancing condition. Disruptive audi-tory stimulation, therefore, decreased N3 and N1 sleep
time and percentage and affected sleep architecture, while preserving TST. In contrast, Enhancing auditory stimulation increased N3 proportion.
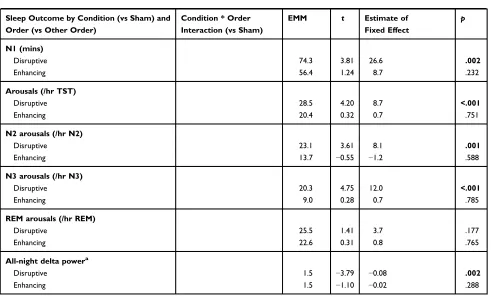
As designed, the overall arousal index (per hour of TST) was significantly higher and sleep more fragmented in the Disruptive condition versus Sham (p< . 001,Figure 5). Arousal indices during N2 and N3 both were higher in the Disruptive condition than in Sham (p= .001 and p< .001, respectively), while REM arousal index did not differ (Table 3). Neither overall nor sleep stage-specific arousal indices differed between the Enhancing and Sham condi-tions. Order*condition interactions were non-significant. Figure 5 illustrates independent contributions from each arousal type to total arousal index.
Neurobehavioral Results (PVT)
Descriptive statistics for PVT performance after Sham, Disruptive, and Enhancing conditions are available in Supplementary Table S5. Statistical comparisons of PVT
Me an Change in Log 10 Pow er Spec tral Dens ity (10s Stimulation minus 5 s Base li ne)
Delta (0.5 – 4Hz) Slow Oscillatory (0.5 - 1Hz)
0 0.2 0.4 0.6 0.8 1
15 25 35 45 55
0 0.2 0.4 0.6 0.8 1
15 25 35 45 55 0 0.2 0.4 0.6 0.8 1
15 25 35 45 55
0 0.2 0.4 0.6 0.8 1
15 25 35 45 55
0 0.2 0.4 0.6 0.8
15 25 35 45 55 0 0.2 0.4 0.6 0.8
15 25 35 45 55
0 0.2 0.4 0.6 0.8 1
15 25 35 45 55
Delta (0.5 – 4Hz) Slow Oscillatory (0.5 - 1Hz)
0 0.2 0.4 0.6 0.8 1
15 25 35 45 55
0 0.2 0.4 0.6 0.8 1
15 25 35 45 55
0 0.2 0.4 0.6 0.8 1
15 25 35 45 55
0 0.2 0.4 0.6 0.8 1
15 25 35 45 55 0 0.2 0.4 0.6 0.8 1
15 25 35 45 55
0 0.2 0.4 0.6 0.8 1
15 25 35 45 55
0 0.2 0.4 0.6 0.8 1
15 25 35 45 55
0 0.2 0.4 0.6 0.8 1
15 25 35 45 55
0 0.2 0.4 0.6 0.8 1
15 25 35 45 55
Sound Pressure Level of Auditory Stimulus (dBA) 0.8Hz Pink Noise Pink Low Pitch Pink High Pitch Pink Sine IV Pump Alarm Physician Paging Ocean Jet Disruptive Stimuli Enhancing Stimuli
Figure 3 Mean change in delta (0.5–4 Hz) and slow oscillatory (0.5–1 Hz) frequency power spectral density between baseline (5 sec preceding stimulation) and auditory stimulation (10 sec during stimulation; y-axes) for stimuli initiated during N2 and N3 sleep that did not result in sleep disturbance. Participants must have had at least 2 qualifying instances of a stimulus (panels) at a given dBA level (x-axes) to contribute to each data point average. Averages across fewer than 3 participants are not presented; however, all data were included in the linear mixed model analysis. PSD, power spectral density; dBA: decibel.
Table 2 Change in Momentary Delta and Slow Oscillatory
Power Spectral Density for Each Stimulus Type (vs Pink Noise 0.8 Hz)
Stimulus Power
Frequency Range
EMM t p
Jetflying overhead
0.5–4 Hz (Delta) −0.06 −6.03 <.001
0.5–1 Hz (SO) −0.04 −4.92 <.001
Ocean waves 0.5–4 Hz (Delta) −0.02 −3.84 <.001
0.5–1 Hz (SO) 0.01 −2.68 .007
Physician being paged
0.5–4 Hz (Delta) 0.14 3.86 <.001
0.5–1 Hz (SO) 0.20 4.30 <.001
IV pump alarm 0.5–4 Hz (Delta) 0.09 1.44 .151
0.5–1 Hz (SO) 0.12 1.68 .093†
High pitcha pink noise
0.5–4 Hz (Delta) −0.01 −3.10 .002
0.5–1 Hz (SO) 0.02 −2.58 .010
Low pitchb pink noise
0.5–4 Hz (Delta) −0.02 −4.07 <.001
0.5–1 Hz (SO) −0.004 −3.52 <.001
Pink noise sinec
0.5–4 Hz (Delta) −0.02 −4.05 <.001
0.5–1 Hz (SO) −0.01 −3.54 <.001
Pink noise 0.8 Hz
0.5–4 Hz (Delta) 0.05 – –
0.5–1 Hz (SO) 0.08 – –
Notes:Linear mixed model outcomes of the delta (0.5–4 Hz) and slow oscillatory (SO, 0.5–1 Hz) power spectral density change between baseline (5-sec window) and stimulation (10-sec window) for each auditory stimulus, relative to the change elicited by afield-standard 0.8 Hz pink noise auditory stimulus. Paging elicited a significantly greater delta and SO power change than did 0.8 Hz pink noise, the IV pump alarm elicited similar delta and SO power relative to 0.8 Hz pink noise, and other stimuli elicited significantly smaller delta and SO power changes than 0.8 Hz pink noise.a
1200 Hz.b
800 Hz.c
Amplitude-modulated pink noise with a 0.4 Hz sine wave.p-values in boldare interpreted as significant (p< .05).†p< .100 (marginally significant). Abbreviations:EMM, estimated marginal means (net of dBA); SO, slow oscillation.
Nature and Science of Sleep downloaded from https://www.dovepress.com/ by 118.70.13.36 on 27-Aug-2020
Table 3Post-Hoc Pairwise Comparisons (vs Sham) of PSG Features on Enhancing and Disruptive Nights
Sleep Outcome by Condition (vs Sham) and Order (vs Other Order)
Condition * Order Interaction (vs Sham)
EMM t Estimate of
Fixed Effect
p
TST (mins)
Disruptive 472.1 −0.89 −10.6 .387
Enhancing 468.4 −1.20 −14.3 .246
Sleep efficiency (%)a
Disruptive 87.4% −0.52 −1.1% .608
Enhancing 86.1% −1.12 −2.4% .278
N3 (% TST)
Disruptive 6.1% −3.33 −4.8% .004
Enhancing 13.2% 2.14 3.1% .048
Order effect
Disruptive 1st 11.5% 1.70 5.1% .119
Disruptive 6.3% −2.56 −4.7% .021
Enhancing 12.5% −3.51 −6.4% .003
Sham 15.8% – – –
Enhancing 1st 10.2% – – –
Disruptive 5.9% – – –
Enhancing 13.9% – – –
Sham 10.8% – – –
N3 (mins)
Disruptive 28.9 −3.53 −24.5 .003
Enhancing 61.9 2.06 14.3 .056†
Order effect
Disruptive 1st 54.6 1.71 23.7 .116
Disruptive 30.5 −2.33 −20.5 .033
Enhancing 57.6 −3.66 −32.1 .002
Sham 75.5 – – –
Enhancing 1st 48.4 – – –
Disruptive 27.3 – – –
Enhancing 66.2 – – –
Sham 51.8 – – –
N2 (% TST)
Disruptive 55.9% 2.05 3.8% .057†
Enhancing 50.7% −0.78 −1.4% .446
N2 (mins)
Disruptive 262.9 1.10 10.5 .287
Enhancing 237.3 −1.59 −15.2 .131
REM (% TST)
Disruptive 22.3% −0.99 −1.8% .339
Enhancing 24.4% 0.13 0.3% .895
REM (mins)
Disruptive 105.8 −1.01 −10.8 .323
Enhancing 114.2 −0.22 −2.3 .830
N1 (% TST)
Disruptive 15.7% 3.49 5.8% .003
Enhancing 12.0% 1.28 2.1% .219
(Continued)
Nature and Science of Sleep downloaded from https://www.dovepress.com/ by 118.70.13.36 on 27-Aug-2020
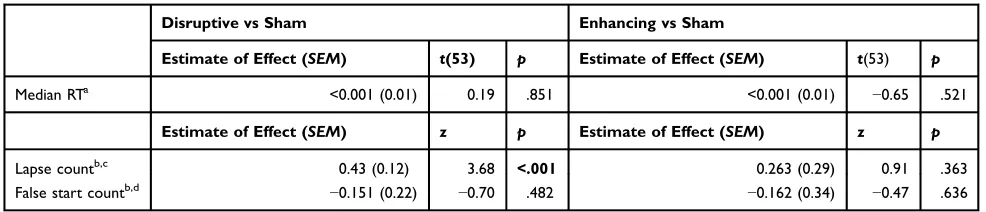
performance after Disruptive and Enhancing conditions (vs Sham) are available in Table 4. Only PVT lapses after the Disruptive night (M = 0.82, SD = 0.25) were significantly higher compared to Sham (M= 0.39,SD =0.30;b= 0.43,p< .001;Figure 6).
Subjective Sleep Outcomes
A summary of linear model details and omnibus out-comes for subjective sleep measures is accessible in Supplementary Table S6. Post-hoc pairwise analyses are presented in Table 5. Participants indicated lower perceived TST in retrospect the morning after the Disruptive condition than after the Sham condition (p = .002; Figure 7), but did not indicate a perceived difference in TST between Enhancing and Sham condi-tions. The percentage of total sleep disruptions recalled by participants in a morning survey (both AASM-qualifying arousals or awakenings that were associated with auditory stimulation and that were spontaneous), relative to those later identified by the RPSGT, occurred at a rate of about 6.5% (±3.7%) after the Disruptive
condition, in contrast to recall for 2.3% (±1.1%) and 2.4% (±1.4%) of total disruptions after the Sham and Enhancing conditions, respectively. Participants recalled more awakenings after the Disruptive condition than after Sham (p < .001) but again did not differ in their awakening recall between Enhancing and Sham nights (Figure 7). Perceived sleep quality did not differ between Enhancing and Sham conditions on the morn-ing after, but sleep quality on the Disruptive night was accurately (as measured by arousal index) perceived as worse than Sham (p < .001; Figure 7).
Sleep was considered less restorative by participants after the Disruptive night than after Sham (p< .001), but not after the Enhancing night versus Sham (Figure 7). Residual slee-piness in the morning did not differ from Sham after the Enhancing night, but was significantly greater after the Disruptive condition relative to Sham (p= .029,Figure 7).
Discussion
The purpose of this study was to examine the effects and specificity of supervised and systematic non-phase-locked
Table 3(Continued).
Sleep Outcome by Condition (vs Sham) and Order (vs Other Order)
Condition * Order Interaction (vs Sham)
EMM t Estimate of
Fixed Effect
p
N1 (mins)
Disruptive 74.3 3.81 26.6 .002
Enhancing 56.4 1.24 8.7 .232
Arousals (/hr TST)
Disruptive 28.5 4.20 8.7 <.001
Enhancing 20.4 0.32 0.7 .751
N2 arousals (/hr N2)
Disruptive 23.1 3.61 8.1 .001
Enhancing 13.7 −0.55 −1.2 .588
N3 arousals (/hr N3)
Disruptive 20.3 4.75 12.0 <.001
Enhancing 9.0 0.28 0.7 .785
REM arousals (/hr REM)
Disruptive 25.5 1.41 3.7 .177
Enhancing 22.6 0.31 0.8 .765
All-night delta powera
Disruptive 1.5 −3.79 −0.08 .002
Enhancing 1.5 −1.10 −0.02 .288
Notes:Stage N3 sleep rebound is evident from N3% and minutes on the Sham condition night between the two different orders of condition presentation. N3 sleep was increased in Enhancing compared to Sham only when the Enhancing condition was presented two nights prior to the Disruptive condition. TST and efficiency were preserved across study conditions. The Disruptive condition effectively increased the rate of arousals (sleep disruption) in stages N2 and N3, and overall.aLog-transformed values were used in analysis.p-values inboldare interpreted as significant (p< .05).†p< .100 (marginally significant).
Abbreviations:EMM, estimated marginal mean; N1, non-REM stage 1; N2, non-REM stage 2; N3, non-REM stage 3; REM, rapid eye movement; TST, total sleep time.
Nature and Science of Sleep downloaded from https://www.dovepress.com/ by 118.70.13.36 on 27-Aug-2020
pink noise auditory stimulation on sleep depth. Both Enhancing (pink noise sounds) and Disruptive (environ-mental sounds) conditions increased delta (0.5–4 Hz) and SO (0.5–1 Hz) EEG proximal to stimulation while preser-ving TST. The Enhancing condition stimulation further preserved sleep efficiency and sleep quality (microarousal fragmentation), while increasing N3 proportion. Standard 0.8 Hz pink noise increased low-frequency activity in both delta and SO ranges more effectively than other pink variants, but these effects were similar to or exceeded by stimuli without pink noise characteristics in the Disruptive condition. Whole-night delta and SO activity were unchanged in the Enhancing condition and were reduced in the Disruptive condition compared to Sham despite momentary increases with stimulation presentation. The Disruptive condition degraded neurobehavioral perfor-mance (more PVT lapses versus Sham). These outcomes
support the notion that nocturnal auditory stimulation with either enhancing or disruptive properties3,4,18 can signifi -cantly increase momentary delta power when played below the auditory arousal threshold, but that disruptive sounds can also degrade sleep quality (both objectively through higher arousal index, and subjectively through self-report) and next-day performance (through vigilance lapses).
Whole-night power (across all sleep epochs) in the delta and SO frequency ranges was reduced on the Disruptive night versus Sham; this outcome was expected by design, as the Disruptive condition decreased the dura-tion and propordura-tion of N3 and degraded sleep continuity in stages N2 and N3. Unexpectedly, versus the 5 sec of EEG activity immediately preceding each stimulus presentation, stimulation-proximal delta and SO power were momenta-rily increased in both Enhancing and Disruptive
15.7% 10.0% 12.0%
55.9%
52.0% 50.6%
6.2%
13.9% 13.0%
22.3% 24.1% 24.3%
0 60 120 180 240 300 360 420 480 540
DISRUPTIVE SHAM ENHANCING
Sleep Time (mins)
Study Night Condition
N3
N2
N1 †
**
REM**
†
A
-20% -15% -10% -5% 0% 5% 10%
DISRUPTIVE ENHANCING
Percent Difference in N3 (vs. Sham)
Study Night Condition B
Figure 4(A) Mean time (in minutes, y-axis) and percentage of TST (data labels) spent in each sleep stage on the Disruptive and Enhancing condition nights relative to Sham night across eight participants. The ordinate is in 1-hr (60-min) intervals. Error bars represent standard deviation. Participants spent significantly less time in N3 on the Disruptive night than Sham that included a significant Condition*Order interaction. N1 time was significantly greater on the Disruptive night than on Sham. **p< .005,†p< .100 (marginally significant), in comparisons of stage percentage. (B) Mean percent difference in N3 sleep between the Disruptive and Enhancing condition nights versus the Sham night, with markers indicating individual participant differences. Filled markers represent participants randomized to the Enhancing condition on Night 2 (two nights prior to Disruptive) and open or letter markers represent participants randomized to the Disruptive condition on Night 2 (two nights prior to Enhancing). Error bars represent standard deviation. Percent N3 was greater in the Enhancing condition than Sham only when Sham did not coincide with a rebound effect following a Disruptive night (ie, only when Enhancing was presented on Night 2, two nights prior to Disruptive).
Nature and Science of Sleep downloaded from https://www.dovepress.com/ by 118.70.13.36 on 27-Aug-2020
conditions. Further examination of each stimulus type revealed that despite having lower auditory arousal thresh-old properties,3,4,18 when played below arousal threshold in this supervised non-phase-locked paradigm, some intui-tively disruptive sounds were more or equally effective in eliciting a momentary increase in low-frequency PSD than the field standard (0.8 Hz pink noise). Pink noise 0.8 Hz increased momentary SO activity to a similar extent (log-scaled, ~9%) as in phase-locked work4with our non-phase -locked approach, but to a lesser extent than we observed with a paging announcement stimulus containing human vocal characteristics intended to be disruptive. We also
Arousals/Hr of Sleep (Stage)
51.6%
61.9% 48.4%
38.1%
15.1% 11.0%
84.9%
89.0% 39.3%
99.2% 60.7%
0 10 20 30 40
DISRUPTIVE SHAM ENHANCING
REM Induced
REM Spontaneous
N3
N2 N3 REM N2 N3 REM N2 REM
DISRUPTIVE SHAM ENHANCING
Auditory arousals
Spontaneous arousals
***
***
Figure 5Mean arousal index (arousals out of a given sleep stage per hour of that sleep stage) in each study condition (Disruptive night, Sham night, or Enhancing night), split by arousal association with sound presentation (spontaneous or associated with auditory stimulation). Sounds were not played during sleep on Sham night; therefore, only spontaneous arousals (empty bars) are indicated in that condition (center column). Arousals associated with auditory stimulation (occurring up to 15 sec after sound presentation onset; shaded bars) are shown for Disruptive and Enhancing nights, with data labels indicating the percentage of arousals in a condition and sleep stage temporally related to stimulation and temporally independent of stimulation (“spontaneous”). Error bars represent standard error of the mean. N3 arousal indexn= 7 due to one outlying value that was excluded. Despite the presence of auditory-associated arousals in the Enhancing condition, total arousal indices in stages N2, N3, and REM were similar to arousal indices on Sham night. Arousals were significantly more frequent in the Disruptive condition relative to Sham, except for during REM sleep. ***p< .001 in a comparison of overall arousal indices.
Table 4Results from Analyses Comparing PVT Outcomes in Disruptive and Enhancing Conditions Compared to Sham
Disruptive vs Sham Enhancing vs Sham
Estimate of Effect (SEM) t(53) p Estimate of Effect (SEM) t(53) p
Median RTa <0.001 (0.01) 0.19 .851 <0.001 (0.01) −0.65 .521
Estimate of Effect (SEM) z p Estimate of Effect (SEM) z p
Lapse countb,c 0.43 (0.12) 3.68 <.001 0.263 (0.29) 0.91 .363
False start countb,d −0.151 (0.22) −0.70 .482 −0.162 (0.34) −0.47 .636
Notes:Differences in performance on psychomotor vigilance testing (PVT) the day after study intervention nights (Disruptive or Enhancing) and Sham. All models include order (of condition presentation), condition*order, time of task administration, and condition*time.a
Analyzed using linear mixed model; includes RT≥500 ms (lapses) but not RT < 100 ms (false starts).b
Analyzed using generalized linear model with Poisson distribution.c
Reaction time≥500 ms.d
Reaction time < 100 ms. Differences in performance on psychomotor vigilance testing (PVT) the day after study intervention nights (Disruptive or Enhancing) and Sham. Analyses interpreted as statistically significant are indicated withp-values inbold(p< .05).
Abbreviations:RT, reaction time; SEM, standard error of the mean.
DISRUPTIVE ENHANCING
0.0 0.2 0.4 0.6 0.8
Lapses (vs. Sham)
***
Figure 6Mean difference in lapse sum (estimated marginal means) across the 10-min PVTafter the Disruptive and Enhancing conditions (vs after Sham). Error bars represent standard error of the mean. Lapse count per administration was significantly higher after the Disruptive night than after the Sham night (p< .001); there was no difference in lapses between Enhancing and Sham. ***p< .001 compared to Sham.
Nature and Science of Sleep downloaded from https://www.dovepress.com/ by 118.70.13.36 on 27-Aug-2020
increased delta PSD with pink noise 0.8 Hz (log-scaled, ~9%) and other stimuli, consistent with open-loop litera-ture using pink noise stimulation6 and in contrast to some – but not all – phase-locked literature using pink noise stimulation.3,4The larger effect of paging announce-ment and similar effect of IV alarm sounds on PSD versus pink noise occurred in both the delta and SO frequency ranges. Although the temporal specificity of phase-locked 0.8 Hz pink noise stimulation benefits memory consolidation,3–6 phase locking’s equivocal impact on higher-frequency delta activity may constrain its broader ability to increase deep sleep (which, clinically, encom-passes both rhythms). For increasing deep sleep, emphasis may not rest on temporal specificity but on other sound features. Effects on the higher-frequency delta range may
also indicate elicitation of K-complexes, whose slow com-ponent is within delta range.28,29
Overall, literature using pink noise 0.8 Hz stimulation indicates consistent enhancement of the narrower, SO EEG bandwidth when phase locked. Our work supports that both the SO and a wider, delta-encompassing (0.5–4 Hz) bandwidth are increased even when pink noise stimu-lation is not phase locked, and that other sounds are cap-able of eliciting this effect when presented below auditory arousal threshold. The momentary SO power increase
Table 5Post-Hoc Pairwise Comparisons (vs Sham) of Subjective
Sleep Assessmenta the Morning After Enhancing or Disruptive Nights.b
Subjective Assessment by Condition
EMMc
t Estimate of
Fixed Effect p
Number of awakenings
Disruptive 10.9 5.17 8.0 <.001
Enhancing 2.6 −0.16 −0.3 .873
Total sleep time (mins)d
Disruptive 408.8 −3.71 −82.5 .002
Enhancing 476.9 −0.65 −14.4 .527
Sleep qualitye
Disruptive 2.3 −5.35 −2.5 <.001
Enhancing 4.5 −0.54 −0.3 .598
Residual sleepinessf
Disruptive 1.9 2.33 1.1 .029
Enhancing 1.0 0.52 0.3 .609
Sleep’s
restorative valueg
Disruptive 2.0 −4.09 −2.3 <.001
Enhancing 4.3 0.00 0.0 1.000
Notes:Differences in subjectively assessed sleep on the day after study intervention nights and Sham. Omnibus effect of condition was significant for all outcomes except Residual Sleepiness (seeTable S6), which was marginally significant (p= .069). No order or interaction effects were significant for subjective measures.a
As reported through survey the morning after awakening from a given condition.b
General linear model. -c
Estimated marginal mean.d
Not including awakenings; participants were asked to report in hours and minutes, and data were converted to minutes.e
1, Extremely bad; 7, Extremely good.f
1, Not sleepy at all; 7, Extremely sleepy.g
1, Not refreshed at all; 7, Extremely refreshed. Analyses interpreted as statistically significant are indicated with p-values inbold.
A
B
C
D
E
Figure 7 Panel offigures summarizing the mean difference in subjective sleep measures between the Disruptive or Enhancing condition nights versus Sham night in a morning survey. Number of Recalled Awakenings (A) indicates the number of times a participant reported awakening between sleep onset and their final morning awakening, Perceived Total Sleep Time (TST;B) indicates the total amount of time participants thought they slept (depicted here in minutes), and Perceived Sleep Quality (C), Perceived Residual Sleepiness (that morning;D), and Perceived Restoration (that morning;E) were participant responses to a 7-point Likert scale. Error bars represent standard deviation. For all measures, subjective sleep was rated significantly worse after the Disruptive night compared to Sham. The Enhancing condition did not differ for any sleep rating relative to Sham. ***p< .001, **p< .005, *p< .05.
Nature and Science of Sleep downloaded from https://www.dovepress.com/ by 118.70.13.36 on 27-Aug-2020
observed in this study further suggests that supervised, non-phase-locked pink noise 0.8 Hz and other stimulation notfitting standard pink noise characteristics are not exclu-sively affecting K-complexes, whose slow-component fre-quency range is higher in the delta frefre-quency window than the SO (0.5–1 Hz) analysis would be expected to detect.28,29
Auditory event-related potential (ERP) components likely also contributed to low-frequency power elicited by stimulation within both the Enhancing and Disruptive conditions. Auditory stimulation during sleep generates a sequence of late auditory evoked potentials with rela-tively high amplitude that are not observed during wake-fulness, including the N350, N550, P450, and P900,30and a P2 component of greater magnitude than is observed during wakefulness.30–32Some of these later ERP compo-nents, particularly between 300–600 ms, have been likened to K-complex activity31 and distinguished from it.30,33 The exclusion of arousal-related auditory stimuli, which are associated with enhanced late ERP components,22 and of stimuli delivered during REM sleep, from our stimulation-proximal momentary PSD ana-lyses prevented conflation of these ERP features with the condition-based and stimulus type analyses in this work. Our further inclusion of stimulus dBA as a fixed factor accounted for amplitude differences of late ERP compo-nents that are related to loudness in the comparisons of individual stimulus types.31However, the necessary inclu-sion of sleep-disrupting stimuli in our whole-night power analyses may have transiently increased low-frequency power in the Disruptive condition, while the necessary inclusion of stimuli delivered during REM sleep may have contributed to the decrease in whole-night low-frequency power. Furthermore, the N550 ERP component is responsive to stimulus salience,34 which differed between Enhancing and Disruptive study conditions and thereby may have contributed to momentary PSD differ-ences in whole-night and individual stimulus analyses.
Delta and SO enhancement may instead be attributable to more specific sound features, namely salient ones. For example, the most effective stimulus in this work con-tained human speech and included a surname, and the penultimate comparative stimulus might be considered salient in terms of response urgency (IV alarm). These outcomes are consistent with the observation that during stage N2, K-complexes are evoked in response to names,35 and sound features with threat valence or intrinsic rele-vance continue to be processed during N2 sleep18,35,36(see
Figure 3for supporting evidence). Late, slow ERP com-ponents like the N550 also demonstrate sensitivity to sti-mulus salience during sleep.34 Together, differences in K-complex and auditory ERP component response may have contributed to differences in momentary, stimulus-proximal PSD between stimuli. If stimulus properties that maximize enhancement while minimizing disruption are identified, future work could optimize the low-frequency increases accomplished here and elsewhere.3–5,18,37,38
The modest increase (~3%) in N3 in the Enhancing condition is comparable to increases observed in other open-loop stimulation work.6 Our effect depended on the order of condition presentation: there was less N3 sleep in the Enhancing condition versus Sham when the Disruptive condition was presented two nights before the Enhancing night (Sham before Enhancing), but greater N3 sleep on the Enhancing night when it was presented two nights before the Disruptive night (Sham after Enhancing). The N3 condition by order interaction effect likely caused by this study design is consistent with a rebound of N3 sleep on the Sham nights that followed Disruptive nights. These Sham nights would have effectively been “enhanced” by an endogenously driven increase in N3, compensating for reduced N3 during the preceding Disruptive night.39 The N3 increase caused by the Enhancing condition is thereby put into context: for participants whose Enhancing condi-tion occurred two nights after Disruptive, the N3 increase caused by Enhancing intervention did not exceed N3 rebound that occurred on the preceding Sham night.
Among midlife and older adults, transient arousals are predictive of sleep propensity even though transitions from sleep to wakefulness or to lighter sleep stages are not.40As few as 5–9 auditory tones presented per hour of sleep across two nights is sufficient to reduce nap latency on the multiple sleep latency test (MSLT), even with retained TST and N3 sleep proportion.41 Here, sleep continuity (measured by arousal index) was preserved in the Enhancing condition, whether by our supervised stimulus delivery method or by the qualitative features of stimuli. While sleep disruption and related adverse sequelae may still occur even without overt EEG evidence,42 measure-ment of such covert disruptions is largely based on infer-ence from those sequelae and outside of standard clinical measurement techniques. The apparent resilience of sleep to supervised non-phase-locked, delta-enhancing auditory stimulation emphasizes its potential clinical utility in the improvement of adult sleep quality or quantity. Sleep continuity is pivotal in the regulation of sleep propensity,
Nature and Science of Sleep downloaded from https://www.dovepress.com/ by 118.70.13.36 on 27-Aug-2020
and thereby in sustained attention,41 which was corrobo-rated in the Disruptive condition’s degradation of psycho-motor vigilance.
Although we reduced sleep continuity without com-promising TST or sleep efficiency in the Disruptive condition, we did not preserve N3 time or proportion. Previous work aiming to reduce sleep continuity was able to preserve both N3 and TST,41 but the magnitude of disruption accomplished by auditory stimulation in such work is unclear because no arousal indices were reported. Here, effects of the Disruptive condition on PVT are not attributable to changes in TST, REM frag-mentation, or REM time, which did not differ versus Sham. However, the general maintenance of REM fea-tures in the Disruptive condition does not rule out the possibility that the presence of auditory stimulation dur-ing REM may itself have contributed to differences undetectable at the whole-night, sleep architecture level. Therefore, we implicate either increased NREM fragmentation, a loss of N3 sleep, or possibly less overt effects of stimulus delivery (like qualitative differences between stimuli) as impairing psychomotor vigilance in the Disruptive condition. PVT performance was also degraded by auditory stimulation in other supervised open-loop6 work, but we did not observe similar degra-dation after our supervised, non-phase-locked Enhancing auditory stimulation approach. Our live-supervised open-loop algorithm permitted individualization and adaptability of auditory stimulation intensity; therefore, these algorithm features are of potential importance in the maintenance of N3 and sleep quality, which did not differ between Enhancing and Sham. We further observed a reduction in subjective sleep quality after the Disruptive condition (possibly impacted by partici-pants’ awareness of their own awakenings) that was not present after the Enhancing condition. If open-loop Enhancing auditory stimulation is presented with suffi -cient supervision, it may permit retention of perceptual satisfaction with sleep’s restorative value.
The primary limitation of the present pilot work is that the limited power due to small sample size was further parsed by an order effect of condition presentation in our analyses, limiting ability to detect group differences. We also likely diluted the effects of our Enhancing auditory stimulation by including some less effective sounds (variants on standard 0.8 Hz pink noise). Therefore, future work should replicate of
our findings, which suggest that systematic non-phase -locked auditory stimulation may enhance sleep.
Conclusions
Here, we demonstrated that disruptive auditory stimula-tion presented during sleep increased sleep fragmenta-tion and next-day lapses of vigilance on a task with known sensitivity to sleep loss, while preserving total sleep time. We additionally demonstrated the utility of non-phase-locked pink noise auditory stimulation during sleep in enhancing momentary slow and delta oscillatory power and increasing the proportion of time spent in N3. Encouragingly, the systematic presentation of non-phase-locked sounds below arousal threshold suggests beneficial translational applications of auditory (ie, non-pharmacological) stimulation to enhance sleep. Potential applications include developing auditory sti-mulation specifically to improve N3 sleep quantity and sleep depth, or to potentially improve next-day function-ing in those with reduced sleep amount and/or quality, such as midlife and older adults.40
Abbreviations
AASM, American Academy of Sleep Medicine; AICC,
Akaike information criterion (corrected for small sample size); EEG, Electroencephalographic; ERP, Event-related potential; FFT, Fast Fourier transform; LMM, Linear mixed model; MSLT, Multiple sleep latency test; NREM, Non-rapid eye movement sleep; N1, Non-Non-rapid eye movement sleep, stage 1; N2, Non-rapid eye movement sleep, stage 2; N3, Non-rapid eye movement sleep, stage 3; PSD, Power spectral density; PSG, polysomnography; PSQ, Post-Sleep Questionnaire; PVT, Psychomotor vigilance task; REM, Rapid eye movement; RPSGT, Registered Polysomnographic Technologist; RT, Reaction time; SO, slow oscillation/oscillatory; TST, Total sleep time.
Data Sharing Statement
Published data are available by request pending approval of a data sharing and transfer agreement with the Pennsylvania State University.
Ethics Approval and Informed
Consent
The Office for Research Protections (IRB office) at the Pennsylvania State University reviewed and approved this study (#5094).
Nature and Science of Sleep downloaded from https://www.dovepress.com/ by 118.70.13.36 on 27-Aug-2020
Acknowledgments
We would like to thank the participants for providing their data. Work was funded by the National Science Foundation (NSF) under grant #1622766, awarded to Gartenberg (PI; CEO Proactive Life Inc, formerly Mobile Sleep Technologies LLC (DBA SleepSpace)).
Author Contributions
OMB and DG conceived of the study, obtained funding, and supervised the project and manuscript preparation. DG and DMR created the software and coordinated the hard-ware used for auditory stimulus delivery. MMS and GMM collected and managed study data. MMS, GMM, and DMR processed, analyzed, and interpreted study data. All authors made substantial contributions to conception and design, acquisition of data, or analysis and interpreta-tion of data; took part in drafting the article or revising it critically for important intellectual content; gave final approval of the version to be published; and agree to be accountable for all aspects of the work. All authors approved the final submission.
Funding
The current work was supported by the National Science Foundation (NSF) under grant #1622766 awarded to Gartenberg (PI; CEO Proactive Life Inc, formerly Mobile Sleep Technologies LLC (DBA SleepSpace)). Work was conducted at Pennsylvania State University (via subcon-tract) and further supported by the Pennsylvania State University Clinical and Translational Sciences Institute (funded by the National Center for Advancing Translational Sciences, National Institutes of Health, through Grant UL1TR002014) and institutional funds from the College of Health and Human Development of the Pennsylvania State University to Dr. Buxton. Collaboration also included a separate project: NIH/NIA SBIR R43AG056250 to Gartenberg (PI; CEO Proactive Life Inc) “Non-pharmacological improvement of sleep structure in midlife and older adults” via subcontract to Pennsylvania State University. The content is solely the responsibility of the authors and does not necessarily represent the official views of the NSF or NIH.
Disclosure
Dr Margeaux M. Schade reports grants, non-financial sup-port from Proactive Life Inc, formerly Mobile Sleep Technologies LLC (DBA SleepSpace)/NSF, during the
conduct of the study; grants, non-financial support from Proactive Life Inc/NIH, outside the submitted work.
Ms Gina Marie Mathew reports grants from National Science Foundation during the conduct of the study.
Dr Daniel M. Roberts reports personal fees from Proactive Life Inc, formerly Mobile Sleep Technologies LLC (DBA SleepSpace), grants from National Institutes of Health, grants from National Science Foundation, during the conduct of the study.
Dr Daniel Gartenberg reports personal fees from Proactive Life Inc, formerly Mobile Sleep Technologies LLC (DBA SleepSpace), grants from National Institutes of Health, and grants from National Science Foundation, during the conduct of the study. In addition, Dr Daniel Gartenberg has a patent, 10524661: Sleep Monitoring and Stimulation, issued to Proactive Life Inc.
Professor Orfeu Buxton reports grants from Proactive Life Inc, formerly Mobile Sleep Technologies LLC (DBA SleepSpace), during the conduct of the study; grants from Proactive Life Inc, outside the submitted work and Dr. Buxton reports current grant support from the National Institutes of Health (NIA, NIMH, NHLBI, NIMHD, NICHD, NIDDK, NCATS, NLM). Dr. Buxton received honoraria/travel support for lectures from Boston University, Boston College, Tufts School of Dental Medicine, and Allstate, and receives an honorarium from the National Sleep Foundation (sleepfoundation.org) for his work as Editor in Chief (designate) ofSleep Health.
References
1. Davis H, Davis PA, Loomis AL, Harvey EN, Hobart G. Electrical reactions of the human brain to auditory stimulation during sleep.
J Neurophysiol.1939;2(6):500–514. doi:10.1152/jn.1939.2.6.500 2. Tononi G, Riedner B, Hulse B, Ferrarelli F, Sarasso S. Enhancing
sleep slow waves with natural stimuli. Medicamundi. 2010;54 (2):73–79.
3. Ngo HV, Claussen JC, Born J, Molle M. Induction of slow oscillations by rhythmic acoustic stimulation. J Sleep Res. 2013;22(1):22–31. doi:10.1111/j.1365-2869.2012.01039.x
4. Ngo HV, Martinetz T, Born J, Molle M. Auditory closed-loop stimula-tion of the sleep slow oscillastimula-tion enhances memory.Neuron.2013;78 (3):545–553. doi:10.1016/j.neuron.2013.03.006
5. Papalambros NA, Santostasi G, Malkani RG, et al. Acoustic enhance-ment of sleep slow oscillations and concomitant memory improveenhance-ment in older adults. Front Hum Neurosci. 2017;11:1–14. doi:10.3389/ fnhum.2017.00109
6. Weigenand A, Molle M, Werner F, Martinetz T, Marshall L. Timing matters: open-loop stimulation does not improve overnight consolida-tion of word pairs in humans.Eur J Neurosci.2016;44(6):23572368. doi:10.1111/ejn.13334
7. Perrault AA, Khani A, Quairiaux C, et al. Whole-night continuous rocking entrains spontaneous neural oscillations with benefits for sleep and memory. Curr Biol. 2019;29(3):402–411 e403. doi:10.1016/j. cub.2018.12.028
Nature and Science of Sleep downloaded from https://www.dovepress.com/ by 118.70.13.36 on 27-Aug-2020