INTRODUCTION
Water is the important natural source,
which is abundant in nature and cover about 2/3rd
of earth surface. However, only 1% of the water resource is available as fresh water (i.e., surface water, rivers, Lakes, streams, and ground water) for human consumption and other activities. The water quality indicator value is based on quality and quantity of fresh water (especially ground water), wastewater treatment facilities, legalities like application of pollution regulations, India’s quality indicator value stood at - 3.1 while for best ranked country,
In India studies of physico-chemical characteristics of water have been carried out by http://www.orientjchem.org
Oriental Journal of Chemistry 2011, Vol. 27, No. (2): Pg. 703-711
Limnological Studies of Upper Lake of Bhopal (India)
VANDANA MAGARDE¹, S.A. IQBAL², NILOFAR IQBAL³ and ISHAQ ZAAFARANY
4¹Department of Chemistry, Rajeev Gandhi College, Bhopal - 462 008 (India)
³SPECTRUM, A Scientific Research, Training & Testing Centre, Idgah Hills, Bhopal - 462 001 (India)
4Department of Chemistry, Faculty of Applied Science, Umm Al-Qura University,
P.O. Box 118, Makkah Al Mukaramha (Saudia Arabia).
(Received: April 12, 2011; Accepted: June 04, 2011)
ABSTRACT
Limnological study of Upper Lake includes comparison of water quality parameters of four different sites in every month at surface and bottom level of Upper Lake, Bhopal during 2008. Water sample collected were analyzed for their Limnological characters viz. Temperature, pH, conductivity, Total hardness, Total dissolved solids, Dissolved Oxygen, BOD, COD, Total alkalinity, Chloride, Sulphate, Nitrate, Nitrite, orthophosphate, data obtained from these analysis were statistically analyzed to determine the correlation between various water quality parameters.
Key words: Limnological studies, Water pollution, Upper Lake.
various workers. Agrawal1 (1993), Das and Kalita2
(1990), Hussainy3 (1965), Iqbal et al.,4. (1984) and
(2002)5 Kataria et al.,6 (1994), Kataria and Iqbal 7
(1995), Khan et al.,8(1978), Kumar and Saha9
(1989), Mathew10 (Govindgarh Lake, Rewa),
Magarde et al.,11 (2006), Mehra12 (Bhalaswa Lake,
Delhi), Munawer13 (1970), Pant and Sharma14
(1985), Pathak15 (1990), Prasad et al.,16 (1985).
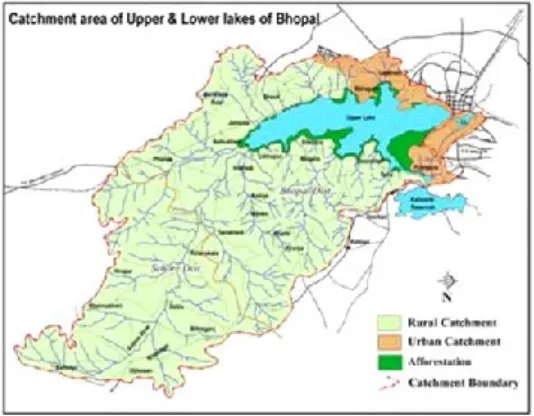
Study area
Bhopal city, the capital of the state of Madhya Pradesh, is endowed with several man-made Lakes created and constrcted through the centuries.
source of piped water supply to the city of Bhopal for over 75 years. Even now, the Lake accounts for some 40% of the city’s water supply. Until 1947 the water quality of Upper Lake was so good that it did not require any treatment before being supplied to the public. However, tremendous population growth of the city (about 70,000 in 1951 to about 1.4 million in 2001) These Lakes are of immense importance since they are inseparably linked with the socio, economical and cultural aspects of the people of Bhopal and are referred as lifelines of the city.
Objective of the study
During present investigation water quality of Upper Lake was assessed to evaluate the degree of pollution caused due to input of toxic as well as domestic wastewater from its catchment.
The physico - chemical study includes comparison of water quality parameters in different four stations of the Upper Lake during the year 2008.
East of the Lake Fategarh
West of the Lake Bhainsakheri
North of the Lake Bairagarh
South of the Lake Bhadbhada
Method and Methodology Water temperature
The water temperature was measured by
using a probe and also using a mercur y
thermometer graduated up to 100 oC with an
accuracy of 0.1 – 0.2 oC.
Turbidity
The turbidity was determined by Jackson turbidity tube. Results were expressed as Jackson Turbidity Unit (JTU).
Conductivity
Conductivity of the samples was measured by using conductivity meter having a conductivity cell containing platinum electrode.
TDS
TDS was determined by TDS meter, which gives reading directly in mg/L
pH
pH is the logarithm in base 10 of the reciprocal of the hydrogen ion concentration given in moles per liter.
Hydrogen ion concentration (pH) was measured by Water Analysis Kit by using hydrogen ion selective electrode.
Dissolved oxygen
parameter, because it regulates the metabolic processes of the organisms. Its acts as an indicator of water quality, tropic status and magnitude of eutrophication.
The dissolved oxygen concentration depends on the physical, chemical and biological activities in the water body, and its measurement provides a good indicator of water quality. Changes in dissolved oxygen concentration can be an early indication of changing condition in the water body.
Methodology
Dissolved oxygen is measured by a number of methods including electronic oxygen meters but the most commonly used and preferred method for DO determination is the Winkler’s method with azide modification. dissolved oxygen content was calculated by using the formula.
Where,
N = Normality of titrant
E = Equivalent weight of oxygen
Total alkalinity
The total alkalinity was obtained by adding carbonate and bicarbonate alkalinity.
The carbonate alkalinity was determined by titrimetric method using phenolphthalein as indicator
The bicarbonate alkalinity was determined by titrating sample with standard acid solution using methyl orange indicator.
Total hardness
Total hardness (as CaCO3) was
determined by EDTA tritrametric method using Erichrome Black-T indicator. Values were computed by following formula:
Chloride
Chloride ion is essential to the electrolytic
balance of essential ions, in our bodies. Because there is a continuous intake and excretion of chloride from all animals, it is one of the more abundant anions found in wastewater and are good indicator ion for pollution sources.
Chloride concentration was determined by argentometric titration method involving formation of reddish brown complex by adding potassium Chromate which is titrated against silver nitrate solution.
Biochemical oxygen demand (BOD)
The biochemical oxygen demand (BOD) is an empirical test, in which standardized laboratory procedures are used to estimate the relative oxygen requirements of wastewater’s, effluents and polluted waters.
Biochemical oxygen demand was determined by measuring the difference of the oxygen concentration (By modified Winkler’s method) between the sample and after incubating
it for five days at 20oC.
Chemical Oxygen Demand (COD)
The Chemical Oxygen Demand (COD) is the amount of the oxygen consumed by organic matter from boiling acid potassium dichromate solution
Reflux condensation method was used for the determination of Chemical Oxygen Demand.
Orthophosphate
Phosphate compounds are present in fertilizers and in many detergents. Consequently they carried into both ground and surface waters with sewage, industrial waste and agricultural runoff. High concentration of phosphorous compounds may produce a secondary problem in water bodies where algal growth is normally limited by phosphorous. In such situation the presence of additional phosphorous compounds can stimulate algal productivity and enhance eutrophication.
T
a
b
le 1:
W
ater quality parameter
s of Upper lake during the y
ear 2008 (F
atehgarh sampling station)
P a ram-Month Depth W ater p H Condu-T otal T otal Bicar - Carbo- Chlo-Nitrate Nitrite T otal Diss-BOD COD Sulp-Or th -eter s temp-tance solids alka-bonate nate ride har d-olved
phate opho
Station erature linity alkali-ness o xyg en spha (°C) nity nity (DO) te (East of J a n S 27.3 6 .5 0 .2 263 142 88 54 9.98 2.04 0.751 110 5 .6 0 2 6 1 4 1.98 the B 24.6 6.3 0.4 548 146 94 52 12 2.46 0.369 120 4.4 0 2 8 1 9 2.14 Lak e F eb S 27.6 7.2 0.1 463 118 80 38 15 2.4 0.245 98 8.8 2 2 0 1 1 1.77 (F ategarh) B 23.9 7.1 0.2 597 124 84 40 22 2.57 0.338 108 7.2 6 2 4 2 3 2.16 M a r S 28.3 8.2 0.4 246 126 100 26 7.98 1.99 0.475 120 10.8 0 2 4 1 7 1.84 B 24.3 8.1 0.1 756 132 112 20 12 2.04 0.658 128 1.2 4 3 0 4 5 2.47 Apr S 26.8 7.9 0.3 298 108 98 10 17 2.12 0.246 122 9.6 2 2 4 1 2 2.66 B 23.6 7.6 0.2 365 112 86 26 27 3.16 0.398 126 4.4 4 3 8 1 6 3.14 Ma y S 25.7 8.3 0.2 244 124 66 58 23 2.48 0.236 90 10.4 2 2 6 1 8 1.47 B 23.6 8.1 0.4 239 136 48 88 34 2.99 0.321 124 1.2 10 28 29 1.49 J une S 26.2 7.6 0.4 247 112 68 44 14 1.23 0.421 86 6 2 24 11 1.44 B 23.1 7.4 0.5 365 124 76 48 25 2.01 0.365 122 5.6 12 38 24 1.69 J u ly S 26.3 7.6 0.4 359 120 98 22 17 1.23 0.218 108 4.4 8 4 0 1 6 1.47 B 20.4 7.1 0.2 476 124 110 14 21 1.45 0.125 124 6.4 10 42 13 1.56 A u g S 26.5 7.9 0.4 386 116 84 32 28 1.37 0.442 112 8.4 2 3 6 2 6 1.28 B 22.4 7.1 0.3 469 120 68 52 35 1.43 0.362 118 4.4 6 4 6 1 2 1.74 Sep S 26.7 7.5 0.1 563 148 120 28 14 1.35 0.147 106 7.6 0 2 8 2 3 2.39 B 24.2 7.3 0.3 654 164 136 28 17 2.46 0.452 120 4 2 44 28 4.78 O c t S 26.1 7.4 0.2 256 124 88 36 21 1.95 0.365 98 6.4 6 2 6 2 2 1.22 B 20.7 7.2 0.3 369 136 64 72 25 2.36 0.754 102 5.6 8 2 8 1 9 1.56 N o v S 24.9 7.6 0.3 544 124 102 22 27 2.15 0.369 88 9.6 0 2 4 1 6 1.27 B 19.2 7.3 0.4 368 138 84 54 30 2.63 0.478 96 7.2 2 4 6 1 1 1.84 Dec S 24.8 7.4 0.3 532 142 36 106 15 2.18 0.452 104 8.4 0 2 6 2 9 1.34 B 18.2 7.1 0.3 634 146 88 58 18 2.57 0.366 120 1.2 2 2 8 2 2 1.55 S- Surf ace
T
a
b
le 2:
W
ater quality parameter
s of Upper of Bhopal during the y
ear 2008 (Bhainsakheri sampling station)
P a ram-Month Depth W ater p H Condu-T otal T otal Bicar - Carbo- Chlo-Nitrate Nitrite T otal Diss-BOD COD Sulp-eter s temp-tance solidsalka-bonate nate ride har d-olved phate Station erature linity alkali-ness o xygen (°C) nity nity (DO) (W
est of J
a n S 26.3 8 .6 0 .2 248 48 28 20 17.9 4.12 1.118 90 10.4 0 1 8 2.38 the lak e ) B 21.4 7.3 0.2 596 52 36 16 21.9 4.22 1.268 84 4.8 2 2 4 2.42 Bhains-F e b S 27.4 8 .2 0 .2 244 60 44 16 24.9 4.36 1.024 68 9 .6 0 1 6 2.14 akheri B 23.6 8.1 0.2 842 72 56 16 27.9 4.38 0.988 72 1.2 2 2 6 2.4 M a r S 27.3 8.3 0.4 366 44 34 10 16.9 4.98 0.184 60 8.8 0 1 8 2.15 B 24.6 7.4 0.4 485 56 26 30 19.9 3.67 0.147 84 6.4 2 2 2 2.31 Apr S 28.4 7.9 0.2 127 36 16 20 21.9 3.86 0.109 64 8.8 0 2 4 2.59 B 24.8 7.4 0.3 209 42 28 14 24.9 2.74 0.137 90 7.2 0 2 6 3.72 Ma y S 27.3 9.2 0.2 244 44 26 18 13.9 3.21 0.168 68 10.4 0 2 4 3.17 B 24.7 7.9 0.2 366 64 42 22 14.9 3.11 0.126 80 2.4 0.4 28 3.69 J une S 25.1 7.3 0.3 189 28 12 16 21.9 3.87 0.122 84 6.4 2 4 6 2.04 B 23.2 7.1 0.2 146 32 22 10 18.9 2.16 0.137 102 5.6 0.4 44 2.42 J u ly S 24.4 7.4 0.1 158 24 10 14 15.9 2.98 0.339 96 4.4 4 2 8 2.24 B 21.3 7.1 0.4 209 28 18 10 21.9 2.74 0.881 110 4.8 6 3 6 2.17 A u g S 24.8 7.4 0.2 470 32 20 12 12.9 3.21 1.028 84 6.4 4 2 8 2.05 B 21.6 7.2 0.2 960 46 28 18 9.9 2.17 0.98 90 4.4 6 6 6 2.15 Sep S 25.3 7.6 0.4 312 28 16 12 24.9 2.96 0.167 68 8.8 2 4 8 2.04 B 23.1 7.6 0.3 458 32 14 18 21.9 2.44 0.194 84 7.6 2.4 84 2.31 O c t S 24.2 7.1 0.3 249 38 14 24 20.9 3.16 0.954 66 5.6 2 2 2 2.15 B 20.1 7.3 0.3 378 44 22 22 23.9 2.87 1.004 80 6.4 2.4 26 2.46 N o v S 23.6 7.4 0.3 246 58 38 20 14.9 3.68 0.324 68 7.2 0 2 8 2.4 B 19.4 6.9 0.7 344 46 28 18 21.9 2.91 0.365 84 1.2 1.2 36 2.47 Dec S 21.6 7.3 0.1 298 42 26 16 23.9 2.44 0.098 60 6.4 2 2 4 2.8 B 17.9 7.1 0.3 328 46 24 22 24.9 2.98 0.268 78 2.4 1.6 28 3.12 S- Surf ace
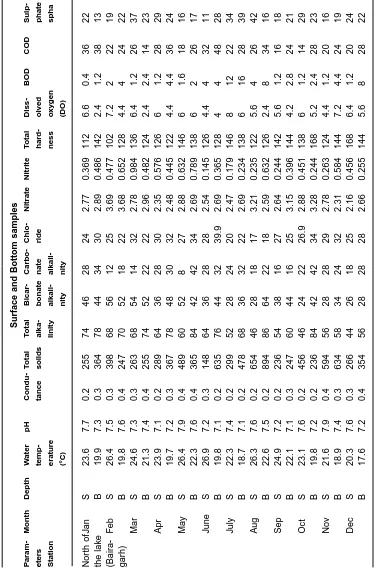
T
a
ble 3:
W
ater quality parameter
s of Upper lake of Bhopal during the year 2008 (Baira
garh sampling station)
Surface and Bottom samples
P a ram-Month Depth W ater pH Condu-T otal T otal Bicar - Carbo- Chlo-Nitrate Nitrite T otal Diss-B O D C O D Sulp-Or th -eter s temp-tance solids alka-bonate nate ride hard-olved phate opho Station erature linity alkali-ness o xyg e n spha spha (°C) nity nity (DO) te N o rt h o fJ a n S 23.6 7.7 0.2 255 74 46 28 24 2.77 0.369 112 6.6 0.4 36 22 1.39 the lak e B 19.9 7 .3 0 .3 364 78 44 34 30 2.89 0.486 142 2 .4 1 .2 38 13 1.46 (Bair a-F e b S 26.4 7.5 0.3 398 68 56 12 25 3.69 0.477 102 7.2 2 2 2 1 9 1.39 garh) B 19.8 7.6 0.4 247 70 52 18 22 3.68 0.652 128 4.4 4 2 4 2 2 1.42 M a r S 24.6 7.3 0.3 263 68 54 14 32 2.78 0.984 136 6.4 1.2 26 37 1.98 B 21.3 7.4 0.4 255 74 52 22 22 2.96 0.482 124 2.4 2.4 14 23 1.68 Apr S 23.9 7.1 0.2 289 64 36 28 30 2.35 0.576 126 6 1.2 28 29 1.88 B 19.7 7.2 0.3 367 78 48 30 32 2.48 0.445 122 4.4 4.4 36 24 2.24 Ma y S 26.4 7.9 0.4 489 60 52 8 2 7 2.88 0.632 146 6 1.6 18 16 2.36 B 22.3 7.6 0.4 365 84 42 42 34 2.69 0.789 138 6 2 26 17 2.18 J une S 26.9 7.2 0.3 148 64 36 28 28 2.54 0.145 126 4.4 4 3 2 1 1 1.29 B 19.8 7.1 0.2 635 76 44 32 39.9 2.69 0.365 128 4 4 48 28 1.44 J u ly S 22.3 7.4 0.2 299 52 28 24 20 2.47 0.179 146 8 1 2 2 2 3 4 1.39 B 18.7 7.1 0.2 478 68 36 32 22 2.69 0.234 138 6 1 6 2 8 3 9 4.56 A u g S 26.3 7.6 0.2 654 46 28 18 17 3.21 0.235 122 5.6 4 2 6 4 2 1.31 B 22.6 7.5 0.2 894 86 64 22 18 2.59 0.632 126 2.4 8 3 4 1 6 1.78 Sep S 24.9 7.2 0.2 236 54 38 16 27 2.64 0.244 142 5.6 1.2 16 18 1.29 B 22.1 7.1 0.3 247 60 44 16 25 3.15 0.396 144 4.2 2.8 24 21 1.44 O c t S 23.1 7.6 0.2 456 46 24 22 26.9 2.88 0.451 138 6 1.2 14 29 1.39 B 19.8 7.2 0.2 236 84 42 42 34 3.28 0.244 168 5.2 2.4 28 23 1.42 N o v S 21.6 7.9 0.4 594 56 28 28 29 2.78 0.263 124 4.4 1.2 20 16 1.36 B 18.9 7.4 0.3 634 58 34 24 32 2.31 0.584 144 7.2 4.4 24 19 1.58 Dec S 20.3 7.6 0.3 266 44 26 18 25 2.16 0.456 168 6.4 1.2 20 24 1.37 B 17.6 7.2 0.4 354 56 28 28 28 2.66 0.255 144 5.6 8 2 8 2 2 1.98 S- Surf
T
a
ble 4:
W
ater quality parameter
s of Upper lake of Bhopal during the year 2008 (Bhadbada sampling station)
(Surface and Bottom samples)
P a ram-M o n th Depth W ater pH Condu-T otal T otal Bicar - Carbo- Chlo-Nitrate Nitrite T otal Diss-B O D C O D Sulp-Or th -eter s temp-tance solids alka-bonate nate ride har d-olved phate opho Station erature linity alkali-ness o xyg e n spha spha (°C) nity nity (DO) te South J a n S 26.4 6.3 0.4 258 120 84 36 13.9 2.66 0.635 120 6.4 0 2 8 1 6 1.94 o f t h e B 24.9 6.3 0.4 367 124 66 58 18.9 3.58 0.149 126 4 0 14 18 1.88 Lak e F eb S 27.3 8.9 0.1 264 206 128 78 13 2.47 0.633 80 8.8 0 1 8 2 6 1.36 (Bhadbada ) B 23.7 8 .7 0 .2 122 240 124 116 16.9 3.18 0.251 110 6 .4 0 2 0 2 7 2.87 M a r S 24.6 7.6 0.3 87 156 136 20 17.9 2.44 0.312 120 7.2 0 2 6 4 9 1.45 B 22.8 7.5 0.4 456 184 144 40 16.9 3.76 0.333 140 6.6 4 2 8 1 8 1.69 Apr S 29.8 8.3 0.3 38 126 102 24 21.9 2.65 0.188 106 8.8 0 4 4 5 6 2.1 B 26.7 8.1 0.3 269 144 116 28 33.9 3.84 0.298 120 4.4 6 2 6 4 2 2.49 Ma y S 27.6 8.9 0.4 241 138 124 14 15.9 2.16 0.564 124 9.6 0 2 0 3 8 2.67 B 23.8 7.8 0.4 156 240 168 72 23.9 2.49 0.587 136 4.4 0 2 4 4 7 3.14 J une S 26.5 8.1 0.4 248 166 142 24 14.9 2.66 0.364 118 6 4 28 16 2.11 B 24.7 7.7 0.4 126 142 122 20 18.9 2.87 0.289 126 2.4 10 14 24 2.56 J u ly S 24.3 6.8 0.4 29 182 176 6 21.9 2.46 0.354 124 3.6 12 16 56 2.17 B 22.8 6.4 0.5 358 124 96 28 22.9 2.75 0.326 146 4.2 16 12 14 2.74 A u g S 27.6 7.8 0.4 265 122 112 10 16.9 2.36 0.521 128 8.8 0 1 8 1 8 1.77 B 24.5 7.6 0.4 344 136 104 32 21.9 2.93 0.399 130 7.2 0 2 0 1 2 1.92 Sep S 24.6 8.2 0.2 278 140 120 20 22.9 2.14 0.485 122 6.4 0 2 4 2 4 1.28 B 22.1 7.7 0.3 269 128 86 42 29.9 2.64 0.314 128 7.6 2 2 4 2 6 1.47 O c t S 25.6 7.4 0.4 245 166 106 60 17.9 2.56 0.268 130 8 0 28 23 1.66 B 23.1 7.1 0.4 163 148 122 26 19.9 2.39 0.355 142 4.4 0 2 0 2 7 2.14 N o v S 22.4 8.4 0.3 237 122 104 18 21.9 2.47 0.277 128 6.4 0 2 6 2 8 1.86 B 19.3 7.1 0.3 348 120 84 36 26.9 2.39 0.963 130 2.4 0 2 0 2 2 2.73 Dec S 21.7 7.3 0.3 196 142 98 44 21.9 2.16 0.312 126 5.6 0 2 4 1 9 1.44 B 17.6 7.1 0.6 79 156 124 32 24.9 2.94 0.359 134 3.6 0 2 8 2 6 2.09 S- Surf ace
Nitrate was deter mined spectrophometrically using the phenol disulphonic acid method on HACH DR 4000 UV-Vis spectrophotometer
Nitrite was analyzed using sulfanilamide method on HACH DR 4000 UV-VIS Spectrophotometer.
RESULT AND DISCUSSION Station – 1 (Fategarh)
Physicochemical characteristics
The water quality of this station is comparatively better. Although, this area is also affected by various anthropogenic activities (bathing, swimming etc.) but these activities do not have much significant role in Lake Pollution. This station is also the site of Tazias immersion, but the immersion activity has only temporary effect on water quality (since no silt is added). No remarkable change was observed during the year 2008.
Station - 2 (Bhaisakheri)
This sampling station has a major inflow channels. Prominent fluctuation in different parameters has been observed during monsoon and winter seasons. The western part of the Lake has a wide spread catchment area, which accumulates the water in the Lake through Kolans River.
Physicochemical characteristics
The fluctuations in the Lake water and turbidity are due to turbulence during monsoon season. Disturbance in most of the parameters was observed during the year. In summer season, the hypolimnetic water at the sampling point indicates the higher value of Biochemical Oxygen Demand. This may be as a result of higher decomposition rate, low depth of water enriched with chemical constituents. The situation was completely reversed
in the monsoon season where the external loading of suspended and dissolved solids increases the turbidity, decreases the transparency and dilutes the nutrient concentration. No remarkable changes noticed in the year 2008.
Station - 3 (Bairagarh)
This station is located near the Sehore Nalla, which has one of the major inlets that remain active through out the year.
Physicochemical characteristics
The continuous flow of domestic sewage from the northern residential area has resulted in
increase in BOD, COD, NO3, PO4 etc. This area is
also affected by the idol immersion activity through which huge quantities of nutr ients and decomposable materials are dumped into the Lake. The agricultural activities in the adjoining areas are also responsible for increasing the nutrient and silt load at this station.
Station - 4 (Bhadbhada)
At this station, the water quality parameters depicted considerable fluctuations in various parameters.
Physicochemical characteristic
During the period time when spill channel was opened (during / after monsoon) high turbidity was recorded at this station. Besides this, higher
concentrations of PO43-, NO
3
- were also observed
which lead to the profuse growth of algal population particularly Microcystis aeruginosa. The sudden increase in algal density can be related to the release of nutrients from the soil from overlying water during flushing on account of deepening and widening activity. In 2008 higher values of BOD were found as this site remains almost stagnant due to scanty rainfall which enhanced the decomposition activities.
1. Agrawal, A. studies on physico-chemical and
Biological Characteristics of river Betwa from Nayapura to Vidisha, Ph. D. Thesis (Chemistry) BU, Bhopal (1993)
2. Das H. B.; Kalita. H., Physico- chemical
quality of water, Mizoram JIWWA, 22(2): 203-204 (1990).
3. Hussainy, S.U. Limnological studies of the
depar tmental pond at Annamalainagar. Environ Health. 7: 24-31.(1965)
4. Iqbal, S. A.; Khan, S.S.; Chaghtai, S.A..;
Hussain, I. Assessment of pollution levels of river Betwa. J. Sci. Res. 6(3): 165-170 (1984)
5. Iqbal, S.A., Masood Alam, Mohd. Ibrahim
and Sadaf Farooqui.; Physico- chemical studies of Halali River Reservoir with special reference of water quality, Orient. J. Chem., 18(1): 151-154 (2002).
6. Kataria H.C., Gupta S.S., Jain O.P., Sandilya
A.K., Iqbal S.A and Ishrat Alion; Orient. J. Chem. 10(3): 267-270(1994)
7. Kataria H.C., Iqbal S.A.; Orient. J. Chem.
11(3): 288-289(1995)
8. Khan, A.A., Siddiqui, A.Q., Ali, M. and
Hameed, T., J. Zool. Res. 2(1):1 -13.(1978)
9. Kumar, S. Saha, L.C.: Physico-chemical and
bacteriological properties of drinking water at Bhagalpur. Ind. J. Appl. Pure Biol. 4: 89-92 (1989).
10. Mathew, P.M., Limnology and productivity of
Govindgarh Lake, Rewa (M.P.). J. India. Fish. Soc. (India). 7: 16- 24.(1975)
11. Magarde Vandana., Iqbal S. A. and Malik
Suman; Pollution parameters including toxic and heavy metals contamination studies of Upper Lake, Bhopal. Curr. World Environ. 1(2): 173-175 (2006).
12. Mehra, N.K.; Limnological studies in the lake
Bhalaswa, a shallow tropical lake in Delhi. Ph.D. Thesis. University of Delhi.(1976)
13. Munawar, M.; Limnological studies on Fresh
water ponds of Hyderabad, I. Biotope. Hydrobiologia, 35: 127-162 (1970).
14. Pant, M.C., Sharma, A.P.; physico-chemical
limnology of Lake Nanital, Kumaun, Himalaya (U.P.) India. Acta hydrochim. Hydrobiol. 13(3): 331-349 (1985).
15. Pathak A, Limnological study on Kaliasot
Dam & Chunabhati Lake with Special reference to zooplankton, Ph.D. Thesis. Barkatullah University, Bhopal (1990)
16. Prasad, B. N., Jaitly, Y.C. and Singh, Y.;
Periodicity and inter-relationship of physico-chemical factors in ponds; Proc. Nat. Symp. Pure & Appl. Limnology, (ed.) Adoni, A.D. Bull. Bot. Soc.Sagar, 32: 1-11 (1985).
17. Raj Kumari Singh, S.A. Iqbal and P.C.Seth.,