Qualitative and quantitative analysis of MRI data from
patients with epilepsy
by
Sanjay Mull Sisodiya
ROCKEFELLER : lAr:/ INSTITUTE o r rO jyyO O 'O A
THE NATiCH'/.L HCX: QUEEN SQiA OE,
LOAiDON,
A thesis submitted to
The University of London
in partial fulfilment of the requirements
for the degree of PhD.
1996
Department of Clinical Neurology
Institute of Neurology
ProQuest Number: 10105621
All rights reserved
INFORMATION TO ALL USERS
The quality of this reproduction is dependent upon the quality of the copy submitted.
In the unlikely event that the author did not send a complete manuscript and there are missing pages, these will be noted. Also, if material had to be removed,
a note will indicate the deletion.
uest.
ProQuest 10105621
Published by ProQuest LLC(2016). Copyright of the Dissertation is held by the Author.
All rights reserved.
This work is protected against unauthorized copying under Title 17, United States Code. Microform Edition © ProQuest LLC.
ProQuest LLC
789 East Eisenhower Parkway P.O. Box 1346
ABSTRACT
Cerebral dysgenesis is the second commonest cause of refractory epilepsy, but its identification and the definition of its anatomical boundaries, though clinically important, remain problematical. This thesis investigates new methodologies for analysis of structural MRI data in normal subjects and patients with partial epilepsy due to known or suspected focal abnormalities and examines the following hypotheses :
informative structural patterns and proportionalities in the normal brain should be quantitatively demonstrable.
structural abnormalities in the brain affected by cerebral dysgenesis may extend beyond visualised boundaries of the apparently focal lesion itself.
postprocessing of MRI data should reveal more abnormalities, qualitative and quantitative, than are found by visual inspection alone, including abnormalities in apparently normal scans of some patients with focal epilepsy.
Subjects studied were: healthy controls (33); patients with: dysgenesis (35); focal epilepsy and apparently normal scans (45); patients with a different cause for epilepsy, without obvious dysgenesis (hippocampal sclerosis; 16) .
Qualitative analysis was performed by reconstruction of data into three-dimensional surface renderings and inspection for surface gyral pattern abnormalities. Novel methodologies (grey, white matter volume distributions; surface areas; callosal areas; surface-volume relationships) were devised for the quantitative analysis of cerebral anatomy. Methodological problems and biases are considered.
brains from normal subjects; using the chief methodology devised, evidence supporting the hypothesis of widespread structural abnormality was found in 70% of patients with dysgenesis, no controls and no patients with isolated hippocampal sclerosis. More subtle abnormalities were also revealed in all patient groups using measures of surface- volume proportionalities. Using all methods some abnormality of structure was revealed in 56% of patients with apparently completely normal scans.
TABLE OF CONTENTS
Title 1
Abstract 2
Table of Contents 4
List of Tables 8
List of Figures 9
Glossary 11
Statement of Originality 12
Acknowledgements 13
Chapter 1: Introduction 14
1.1 Epilepsy and cerebral dysgenesis 14
1.2 The clinical problem 16
1.3 Normal cerebral development 19
1.4 Normal cerebral structural
properties: proportionalities 22
1.5 The abnormal adult brain: cerebral dysgenesis 25 1.6 Abnormalities in dysgenesis: localised or widespread 28 1.6.1 Evidence for extensive abnormalities in
dysgenesis: connectivity 29
1.6.2 Evidence for extensive abnormalities in
dysgenesis: causes of dysgenesis 33
1.7 Aims of thesis 34
Chapter 2 ; Magnetic resonance imaging of the brain 35 2.1 Application of hypotheses to MRI data 35
2.2 Segmentation 38
2.2.1 Intensity thresholding 40
2.2.2 Multispectral analysis 41
2.2.3 Choice of segmentation method for this study 42
2.3. Post-segmentation processing 45
2.3.1 Visualisation of surface-rendered images 45
2.3.2 Quantitative analyses 47
Chapter 3 : Methods 55
3.2 MRI data acquisition 57
3.3 Image visual review 57
3.4 Image analysis 58
3.4.1 Segmentation 58
3.4.2 Region-of-interest boundary definitions 63
3.5 Statistics 64
3.6 Validity 65
3.7 Reliability 67
3.8 Visualisation of surface renderings 73
3.9 Hemispheric volume analysis 73
3.10 Regional analysis of volume 73
3.10.1 Method 73
3.10.2 Head orientation effects 76
3.11 Corpus callosum area 86
3.12 Block pair analysis 86
3.13 Surface area measures and derivatives 87 3.13.1 Justification and head orientation effects 87 3.13.2 Predicted and extra subcortical matter areas 91
3.13.3 Mean cortical thickness 94
3.13.4 Surface area derivatives 96
3.14 Fractal analysis 96
Chapter 4: Results 100
4.1 Controls 101
4.1.1 Three-dimensional visualisation 101 4.1.2 Whole hemispheric volumes and areas 101
4.1.3 Block volumes and symmetry 103
4.1.4 Block pair ratios 103
4.1.5 Corpus callosum cross-sectional area (CCA) 106
4.1.6 Surface area derivatives 106
4.1.7 Fractal dimension 109
4.2 Patients with cerebral dysgenesis on routine
inspection 109
4.2.1 Three-dimensional visualisation 109
4.2.2 Whole hemispheric volumes H7
4.2.3 Block volumes and symmetry 117
4.2.5 CCA 121
4.2.6 Surface area derivatives 121
4.2.7 Fractal dimension 121
4.3 Patients with normal scans on routine inspection 123 4.3.1 Three-dimensional visualisation 123
4.3.2 Postprocessing results 123
4.3.3 Surface area derivatives and fractal dimension 141 4.4 Patients with subependymal heterotopia 142
4.4.1 Clinical and MRI details 142
4.4.2 Postprocessing results 142
4.4.3 Surface area derivatives and fractal dimension 143 4.5 Patients with hippocampal sclerosis 143
4.5.1 Clinical details 143
4.5.2 Postprocessing results 144
4.6 Mean cortical thickness 145
4.7 Summary of results across groups by analytic
technique 145
Chapter 5 : Discussion 148
5.1 The extensive nature of structural abnormalities
in dysgenesis 148
5 .2 The normal human brain 151
5.2.1 Hemispheric surface area measurements 152
5.2.2 Cortical thickness 158
5.2.3 Hemispheric symmetry 158
5.3 Interpretation of altered quantitative measures
in patients 160
5.3.1 Blocks 160
5.3.2 Surface area measures in patients 163 5.4 Subependymal heterotopia: a special case 172 5.5 The functional significance of extralesional
structural abnormalities in patients with dysgenesis 173
5.5.1 Hypothalamic hamartoma 174
5.5.2 Electrophysiology 175
5.6 Information extraction 178
References 186
Author's Bibliography 205
Appendices
Appendix 1 Region-of-interest boundary definitions 209 Appendix 2 Angles of rotation about anterior-posterior
axis 213
Appendix 3 Angles of rotation about vertical axis 215
Appendix 4 Choice of block size 216
Appendix 5 Repeat surface voxel counts for
repeat segmentations 217
Appendix 6 Patient clinical details 218 Appendix 7 Mathematical induction of hemispheric
neuron numbers 226
LIST OF TABLES
3.1 Variation in threshold settings with alteration
in windowing 59
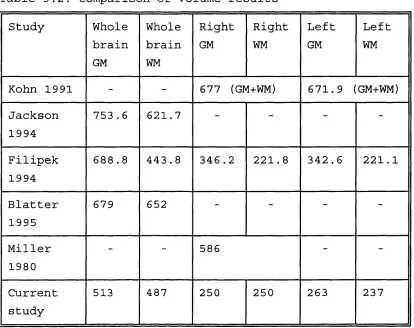
3.2 Comparison of volume results 67
3.3 Effect of threshold choice on resulting segmented area
in a control subject 68
3.4 Changes in total right SM area across brain with
change in lower threshold value 69
3.5 Interrater reliability coefficients 71 3.6 Intrarater reliability coefficients 72 4.1 Mean measured hemispheric surface areas and volumes
for males and females 102
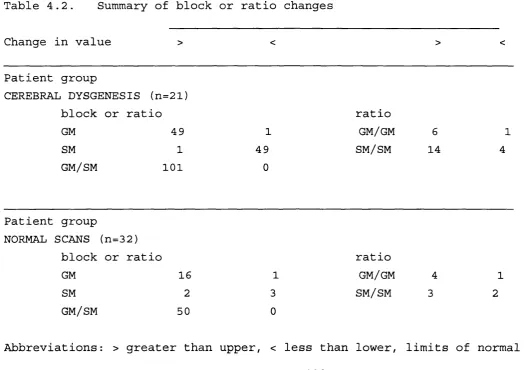
4.2 Summary of block or ratio changes 118 4.3 Abnormalities in patients with dysgenesis 120
4.4 Summary of results 146
X.l Block volumes in patient with blurring of the
grey-white interface 211
X.2 Coefficients of variation for volumes of blocks of
different anterior-posterior extents in 33 controls 216 X.3 Clinical details of patients with
subependymal heterotopia 223
X.4 Details of MRI and MRI postprocessing in patients
LIST OF FIGURES
2.1 Demonstration of value of
three-dimensional reconstruction 36
3.1 Application of region-of-interest mask to image prior
to segmentation 61
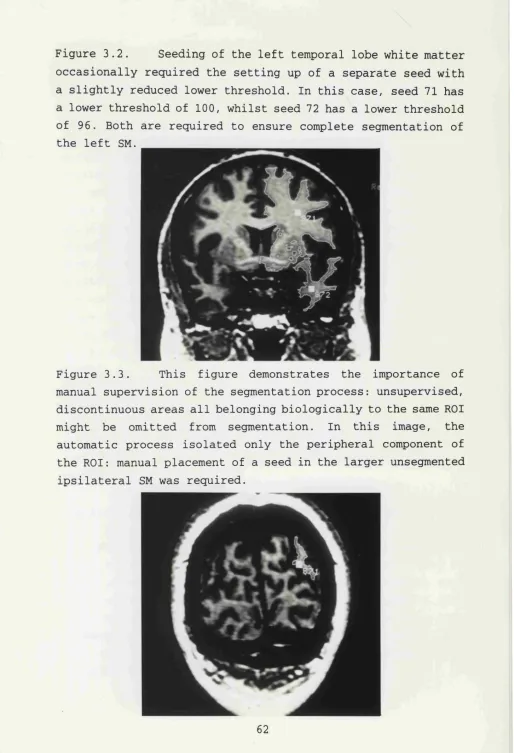
3.2 Occasional requirement of separate seed for left
temporal lobe 62
3.3 Seeding of discontinuous subcortical matter 62 3.4 Division of hemispheres into blocks for regional
analyses 75
3.5 Maximum rotations at which control subjects scanned 82 3.6 Generation of block ratio derivatives: grey-grey
and white-white ratios 84
3.7 Generation of grey-white ratio derivative 85 3.8 Allowance for ventriculomegaly in measurement of
surface voxel count 93
3.9 Template used for pruning of gyral white matter cores 95 3.10 Blocks before and after removal of gyral white
matter cores 95
3.11 Illustration of dilation logic on lines 98 3.12 Dilation of subcortical matter surface 99 4.1 Composite plot of coefficients of variation of
block parameters against block position for controls 104 4.2 Schematic illustration of grey matter blocks with
highly correlated volumes 105
4.3 Plot of surface voxel count versus hemispheric grey matter volume for left hemisphere in
control subjects 108
4.4 - 4.9 Surface renderings of MRI scans of patients
known to have cerebral dysgenesis 111 - 116 4.10 Distribution of abnormal blocks and ratios in
patients with known dysgenesis 122
4.12 - 4.28 Surface renderings of MRI scans of patients
with normal scans on routine inspection 124 - 140 5.1 Schematic illustration of interpretation of
5.2 Surface rendering of gyral pattern of right
hemisphere in patient 12 167
5.3 Coronal brain MRI image of patient 2 168 5.4 Vertical view of surface rendering of cerebral
GLOSSARY
CCA cross-sectional area of corpus callosum CH cerebral hemisphere/cerebral hemispheric CPS complex partial seizure(s)
CSF cerebrospinal fluid
extra subcortical matter surface area ECC ratio of to CCA
EEG electroencephalogram EGM ratio of to GM volume ESM ratio of E^^ to SM volume
GM grey matter (includes neocortex, archicortex and paleocortex, but excludes basal ganglia)
GMV volume of GM
HS hippocampal sclerosis
L left (alone, suffix or prefix) MRI magnetic resonance imaging
predicted SM surface area
PR ratio of volumes of a pair of blocks R right (alone, suffix or prefix)
ROI region-of-interest S.D. standard deviation
SEH subependymal heterotopia
SGS secondary generalised seizure(s)
SM subcortical matter (includes all hemispheric white matter, thalamus and basal ganglia except caudate)
SM^ surface area of subcortical matter SMV volume of SM
SPS simple partial seizure(s)
STATEMENT OF ORIGINALITY
The methodologies used to examine the hypotheses were all devised solely by the author: these include the derivation of measurement of total hemispheric volume ratio (TRAT) and the block technique of regional volume distribution analysis, the measurement of surface areas by voxel counting and the derivation of surface area measure ratios. The use of fractal dimension analysis to determine whether surface voxel counting could be used on any segmented brain was also devised by the author, as was the method of exclusion of brains from analysis by consideration of degrees of rotation.
The boundaries used for segmentation were all devised by the author. All segmentations used to generate and test hypotheses were performed by the author. Recording of all data and statistical and mathematical analyses were all performed by the author.
The interpretation of the data was originated by the author. This thesis was written entirely and solely by the author.
ACKNOWLEDGEMENTS
I would like to thank Professor Simon Shorvon for giving me a job, for his unfailing enthusiasm and support, and for the experience of his vision and humanity; Dr David Fish for his perspicacity, precision and demanding standards - leavened with wit; and both for their inspiring examples and kindness; Dr John Duncan for permission to study his patients; Dr John Stevens for always being willing to look at films and having a cheering anecdote in difficult times - 6i6#&KaAo< germanus; and Dr Samantha Free who gave so much and without whom none of this could ever have happened.
I would like to thank Dr. Raymond Ali whose dedication and hard work I have tried to emulate; Dr. Ley Sander for arranging things financial and always smiling; the radiographers at St. Mary's Hospital for their kind cooperation at all times; all the Fellows in the Epilepsy Research Group and Department of Neurophysiology with whom I have shared experiences and who gave their time to listen; Dr Louis Lemieux who helped with computing problems; ISG Technologies who tried their best to help when computers failed; the audiovisual department, and in particular Mr George Kaim, for hundreds of pictures, slides and the illustrations in this thesis.
I would like to thank The Wellcome Trust and the National Society for Epilepsy for the opportunities their support gave me; anonymous reviewers for robust criticisms; the staff at Chalfont and Queen Square for their assistance.
I would like to thank my parents to whom I owe most everything.
CHAPTER ONE ; INTRODUCTION
1.1. Epilepsy and cerebral dysgenesis
Epilepsy is the commonest serious neurological condition. About one person in fifty will have one or more afebrile
seizures during their lifetime and one in two hundred will endure chronic epilepsy (Cockerell et al.,1994). In Great Britain alone, this means that there are some 350,000 people with chronic epilepsy (Binnie et al.,1991). This is a major handicap for the sufferers, with associated social, psychological and financial handicaps and an increased standardised mortality rate (Cockerell et al.,1994). The control or abolition of seizures are the major goals for all physicians concerned with the care of patients with epilepsy.
Identifying the cause of epilepsy is becoming crucial for management and prognostication (Sander, 1993). The individual causes of epilepsy are legion: they may be divided into developmental (or dysgenetic), traumatic (birth, accidental, anoxic cerebral injury), sclerotic (hippocampal sclerosis), tumoural, infective (meningitic, encephalitic), vascular, metabolic (disturbances and diseases), degenerative, and perhaps the largest group (60-70%), cryptogenic: those for whom there is no apparent cause (Cockerell et al.,1995). The proportion of cases attributable to each of these causes varies with age (Sander et al.,1990), geography (Placencia et al.,1992) and also, now, history: as modern neuroimaging allows detailed study of the brain in vivo, it is likely that the large number of patients in whom no cause could previously be found will diminish.
cause of the epilepsy is being increasingly considered (Binnie et al.,1991). Histopathological studies have shown that hippocampal sclerosis (HS), a condition of unknown aetiology, is the commonest cause of chronic partial epilepsy in patients who undergo surgical treatment (Duncan and Sagar, 1987; Bruton, 1988; Wolf et al.,1993). It is not clear whether such studies accurately reflect the epidemiology of causes of refractory epilepsy in the population, as cases were usually selected, with selection criteria not always published.
Magnetic resonance imaging (MRI) has revolutionised the understanding of epilepsy (Shorvon et al.,1994). It enables detailed examination of the structure of the brain in vivo providing a degree of spatial resolution and imaging flexibility that is just beginning to be exploited, as witnessed by a number of recent workshops on imaging in epilepsy (London, 1992; Cleveland, 1994; Yale, 1994). With different and advancing MR techniques, different aspects of brain structure may be visualised and quantified. Serial and cohort studies can be performed, without the risks inherent in X-ray based imaging. MRI provides the means to perform epidemiological neuroimaging studies that may provide a more accurate picture of the causes of epilepsy in the population.
It is in the study of patients with refractory epilepsy that MRI has been most extensively applied to date. MRI can reliably detect and predict the presence of hippocampal sclerosis (Li et al., 1995) and is now recognised as a very important, if incompletely explored, presurgical investigation in patients with refractory epilepsy thought to arise from the mesial temporal structures (Spencer, 1995) . In addition, use in a research environment has increased our understanding of the nature of this condition and its associations and progression (Cendes et al.,1993; Trenerry et al.,1993; Kuks et a l . ,1993).
that there are other detectable causes of refractory epilepsy in the adult population. Selection bias should be acknowledged: the cost of MRI has limited its use so far mainly to patients referred to tertiary centres with
intractable epilepsy. In such patients, MRI has shown that whilst HS remains the commonest underlying diagnosis, abnormal development of the cerebral cortex (cerebral dysgenesis) may be the second commonest cause in adult patients (Li et al., 1995) . In the majority of such patients, CT scanning fails to reveal the underlying pathology - indeed, often even early MRI failed to reveal such changes (Stevens, 1995) .
1,2. The clinical problem
Cerebral dysgenesis has long been recognised as a cause of epilepsy. It first featured in postmortem studies on human fetuses and infants; these revealed pachygyria, polymicrogyria, schizencephaly and other dysgenetic changes
(Yakovlev and Wadsworth, 1946; Dekaban, 1965; Richman et al.,1974; Barth, 1987). Subsequently, the use of resective surgery as a treatment for refractory epilepsy provided further evidence that dysgenesis might be culpable (Taylor et a l . ,1971). The ability to demonstrate dysgenesis in vivo - preoperatively - using MRI, and its association with other neurological illnesses in the adult population (Barth, 1987), has stimulated research into dysgenesis.
lesion fundamental to understanding dysgenesis, but it is also probably of pivotal importance to the surgical management procedures that provide the samples themselves (Awad et al., 1991; Palmini et al.,1995).
Thus, there is surgical evidence showing that when dysgenesis is present in resection specimens, the extent of resection is a critical factor in outcome with respect to freedom from seizures postoperatively. Palmini et al. (1991) studied outcome in 2 0 patients with proven dysgenesis amongst a larger number of patients undergoing surgical treatment for epilepsy: they determined that the only significant prognostic factor was extent of lesional resection, 78% of those with a greater than 50% resection having a good outcome in comparison to none of the remainder. It is not clear how the extent of resection was judged in individual patients. Awad et al.
(1991) also reported that having complete resection of a lesion (dysgenetic in 20/47 of their cases) was associated with a higher chance of becoming seizure-free than if there was incomplete resection, though even complete resection was not necessarily associated with seizure-freedom. They postulated that in patients with proven dysgenesis (eg tubers,
"cytoarchitectural dysmorphism") there might be "widespread nonvisualised histopathology" . Unfortunately, their results do not allow outcome to be correlated for specific underlying histopathologies and resection extents. Surgical removal of an electrically-determined epileptogenic zone rather than a (complete removal of the) lesion is known to be associated with a poor outcome for a wide variety of lesional pathologies (Fish et al.,1991). It is now accepted that complete removal of a lesion is in general the best policy when operating for epilepsy on a patient with a lesion (Fried and Cascino, 1993).
tumours (Daumas-Duport et al.,1988); even in these cases, however, lesionectomy alone is associated with a smaller chance of rendering the patient seizure-free than if a wider excision is performed (Raymond et al.,1995). In most other types of dysgenetic pathology, the anatomical extent of the lesion is difficult to define (Fried and Cascino, 1993; Andermann, 1994) . That there are few studies of cortical histology beyond the visualised lesional margins, and that apparently normal adjacent (or distant) cortex is unlikely to be removed at operation, make it more difficult to study this problem. With the increasing revelation of dysgenesis as a probable underlying cause of refractory epilepsy and an increasing use and recommendation of surgery for treatment in these cases, it is important that the problem be addressed, especially if complete lesion excision is indeed the optimum surgical strategy.
This was the clinical impetus for the thesis, the hypothesis being that the extent of structural abnormalities associated with cerebral dysgenesis in patients with partial epilepsy was greater than the visible extent of such lesions. If evidence for this were available, a more rational approach to clinical investigation and management might become possible.
The possibility of addressing this question has been raised only because MRI has proved such a useful tool in the investigation of cerebral structure. Methods are required to demonstrate the existence of abnormalities outside a clearly visualised lesion where none are visible to the naked eye on M R I .
previously could not even be seen. The example par excellence is that of quantitative analysis of the hippocampal formation. It has been shown by numerous studies that quantitation of hippocampal MRI data is of importance in the clinical management of patients with mesial temporal sclerosis (Jack,
1994) . Quantitative postprocessing of data already acquired can furnish information that is not detected by inspection alone (Reutens et al.,1995; Van Paesschen et al.,1995). Currently, even with high resolution scanning and experienced neuroradiological review, 25% of all scans in refractory epilepsy cases may appear completely normal (Li et al.,1995), though it is likely from a biological standpoint that the majority of cases of partial epilepsy seen in adults are due to underlying structural cerebral abnormalities. Further quantitative postprocessing has not been applied extensively to the study of the cerebral hemispheres in epilepsy. Given the nature of dysgenesis and MRI, quantitative analysis of cerebral structure outside the hippocampus promises to be useful.
In order that methodologies appropriate to the MRI technology and the problem in hand be devised, further consideration of both the biological circumstances (see below) and the methodological and technological limitations is required (see Chapter 2).
1.3. Normal cerebral development
The study of abnormalities in human biology has always been richly rewarding in the understanding of normality, both in terms of structure and function. Quantitative analysis of cerebral structure for the investigation of abnormalities associated with development and epilepsy may cast light on normal structural properties of the cerebral hemispheres.
uniform in cellular structure, being composed of six layers, with local variations in fine detail that are related to
function. The outermost, subpial layer is composed mainly of fibres (axons and dendrites), with some synapses and very few cells: it is called the molecular layer, or layer 1. Passing progressively further inwards, five cellular layers are discernible on the grounds of cellular morphology and disposition: they are numbered 2 to 6 respectively. In certain regions, some layers are more prominent than others, but the essential laminar structure is always preserved in the normal brain.
Normal cerebral development is well described in many texts (see Sarnat, 1992) and is not repeated in detail here. Three salient features will be highlighted.
1. The inside-out gradient of normal development. A general principle of the development of neuronal structures is that neurons are generated at a distance from their final resting positions, to which they migrate along sometimes extensive pathways. Four pathways are recognised in human brain development: the cerebral, from the subventricular zone to the cortical plate; the corpus pontobulbare, forming the pontine and medullary nuclei; the corpus gangliothalamicus, forming the corpus striatum, globus pallidus and thalamus; and the cerebellar migrations (Sidman and Rakic, 1973). In the case of the development of the cortical plate, that gives rise to the adult neocortex, cells migrate in waves, each successive wave passing through previous migrations to lie more pial, so that layer 2 cells are those that migrated last and those of layer 6 migrated first (Angevine and Sidman, 1961) . Neurons in the developing hemispheres migrate along radial glial fibres. It appears that migration may be disturbed at any stage, leading to ectopic neuronal positioning (see below).
emphasised below (1.4.). Connectivity appears to be not only prolific, but also precocious. Axodendritic synapses between primordial corticopetal fibres from the mesencephalic tegmentum and Cajal-Retzius cells in the primordial molecular layer (layer 1) can be seen as early as day 43. Invading thalamic afferents synapse with subplate neurons (that underlie and predate the neurons migrating from the subventricular zone to the cortical plate) before they synapse on their eventual neocortical targets. The importance of such primordial connections to the final synaptic organisation of the neocortex is shown, for example, by selective ablation of cells regionally in the subplate leading to the failure of local thalamic afferents to pass eventually into the overlying cortical plate, even though their predestined targets are in their correct positions (Ghosh et al.,1990). Precocious and mature synaptic connectivity may not only be a fundamental cortical property, but also a cerebral morphogen (Purves et a l . ,1992) .
experimental results.
1.4. Normal cerebral structural properties: proportionalities
The magnitude of the achievement of normal cerebral development should not be underestimated. Stereological estimation suggests that there are at least fourteen billion neurons present in a single human hemisphere (Braendgaard et al. ,1990) , with up to four thousand synapses on a given neuron (Cherniak, 1990) . However, the entire human genome is thought to contain fewer than 100,000 genes (McKusick, 1979). Therefore general principles determining the structure and development of the cortex must exist. There is little knowledge of such rules for human brains. The study of the abnormal and, often, obscure, has provided much of the available information. The most widely held theory for cortical gyrogenesis, for example, arose from analysis of two brains affected by extensive dysgenesis (Richman et al.,1975).
Based on quantitative MRI work, it has been postulated that some regulation ensures that the two cerebral hemispheres are of very similar total volume (Filipek et al.,1994). Other structural principles have been noted in the adult cortex. Neurons are ordered into functional columns (Mountcastle, 1978), thought to be the basic processing units of the neocortex. Local variations in cerebral anatomy, which may be large enough to enable definition of regions on the basis of cytoarchitecture, are thought to be due to modulation of this basic functional element rather than to an alteration in its fundamental pattern (O'Leary, 1989) . Phylogenetic neocortical expansion is also thought to have occurred as a result of an increase in the number of such units rather than by an alteration in the fundamental building blocks (Rakic, 1995).
related to brain volume in man (Braendgaard et al.,1990) and across species (Haug, 1987), providing a surrogate for total neuron number in the normal brain. Thus, if a (grey) surface parameter can be shown to relate to a (grey) volume parameter, then total neuronal number in the normal brain should relate to the surface measure, as suggested by Mountcastle (1978).
Rockel et al. (1980) also suggested that the proportion of neurons in a given functional category for a given surface area was also constant. This proposition is less affected by the use of nonstereological methodology, and remains useful (O'Leary, 1989). It has also been shown that the proportions of pyramidal and nonpyramidal cells in widely differing cortical areas of different species are of the same order of magnitude (Winfield et al.,1980). Reliable determination of cortical surface area might thus provide a means of estimating total, regional and function-specific neuronal numbers. Such knowledge would further increase understanding of normal cerebral anatomy and its disruption in dysgenesis.
The number of fibres passing through the corpus callosum correlates with its cross-sectional area (Tomasch, 1954; Aboitiz et al.,1992). As the proportion of the total number of neurons extending interhemispheric axons is probably constant (Rockel et al.,1980), and the mean number of neurons underlying a given area of cortex in the normal brain may be fixed, then the cross-sectional area of the corpus callosum ought to correlate with a surface measure of the cortex, this measure estimating the total number of neurons.
responsible for the occurrence of a specific and extensive structural change (Reiner et al.,1993) allows further dissection of the structural developmental process, and the genetic control underlying its components. In order for such studies to be possible and directed, structural changes in the brain must first be detected, examined and quantified. The varieties of such disruption will now be discussed.
1.5. The abnormal adult brain: cerebral dysgenesis
Developmental structural changes in the brain are of many different pathological varieties, known collectively as cerebral dysgenesis (Sarnat, 1992). Before MRI, dysgenesis in the adult brain was considered to be rare. MRI, however, has demonstrated that cerebral dysgenesis (CD) occurs not only in severely affected children, but also that adults may have many forms of CD, possibly manifesting only as epilepsy (Raymond et al.,1995) or relatively minor developmental abnormality, such as dyslexia (Galaburda and Kemper, 1979). The prevalence of CD in the adult population is largely unknown. Only postmortem studies are available; the largest series suggests that CD may occur in 1.5% of normal adult brains, and in 14% of brains from individuals with epilepsy (Meencke and Veith, 1992). One population that has been studied in vivo is that of individuals with refractory epilepsy. In a large study from this institution, CD was seen in 12% of 341 such patients (Li et al.,1995); this is likely to be a minimum estimate.
Agyria or lissencephaly describes a brain in which gyration is absent and the cortical surfaces are smooth. Failure of migration affects extensively all but one of the four pathways: the corpus gangliothalamicus is unaffected, so that the thalamus and corpus striatum are singly uninvolved in the developmental disruption. There are at least two distinct histopathologies. In type I the affected cortex is four- layered: there is a subpial molecular layer, then a disorganised outer cellular layer (containing cells normally in layers 3,5 and 6), a cell-sparse zone and finally an inner cellular layer with numerous cells whose migration is believed to have been arrested and which normally would have constituted mainly layers 2 and 3. In type II lissencephaly there is little discernible layering, neurons instead being grouped in clusters and columns. In the underlying white matter, heterotopic neurons form nodules.
Pachygyria is the presence of broader and fewer gyri than normal. Histologically identical to agyria, the two often occur in different regions of the same brain (Friede, 1975) . Macrogyria is a purely descriptive term, applied to gyri that appear broadened, on inspection or imaging. It carries no histopathological implications, and indeed may be due to at least six different pathologies (Raymond et al.,1995) .
blurred, especially in terms of the timing of the cause.
Schizencephaly is the presence of a cleft extending across the wall of the hemisphere, from pia to ependyma. The cleft walls are lined by grey matter, which may be polymicrogyric. It is believed to result from a destructive influence that in less dramatic cases produces polymicrogyria. There may be abnormal cortex around the cleft; this is usually polymicrogyric. Recently, there has been a trend away from the use of the term "schizencephaly", in favour of a more complete description of the abnormality with the use of "cleft" instead
(Sarnat, 1992; Raymond et al.,1995).
Dysgenesis may be due to abnormal positioning of neurons (heterotopia). Heterotopic tissue may be described in terms of its extent, morphology and position. Subependymal heterotopia (SEH) is the presence of ectopic grey matter lying underneath the ventricular ependyma in the post-developmental brain. Overlying cortex appears normal. It may be due to a failure of migration or of apoptosis. SEH appears to be a distinct type of dysgenesis as judged by clinical phenotype (Raymond et al.,1994a). Females appear to be affected more commonly than males; an X-linked mode of inheritance with prenatal lethality for males has been postulated for the familial form of the condition (Huttenlocher et al.,1994).
Subcortical heterotopia is the presence of aggregations, in either laminar, band or nodular form, of neurons in the white matter, commonly in the centrum semiovale. It may be associated, especially if extensive, with abnormal gyration of the overlying cortical ribbon. It is believed to be due to a premature arrest of neuronal migration.
be diffuse and extensive, mimicking the appearance of macrogyria or even hemimegalencephaly (Harding, 1992) .
Of other forms of dysgenesis, two will be studied. Agenesis of the corpus callosum may be seen in association with other dysgenetic abnormalities of cerebral structure,
such as polymicrogyria, focal migrâtional disorders, tuberous sclerosis or as part of a recognised syndrome. Transcallosal axons originate mainly from layer 3 of the mature cortex (Innocenti, 1986): their interhemispheric passage requires the programmed cell death of glia in the dorsum of the lamina terminalis. In the presence of cells in layer 3, but without glial apoptosis, transcallosal axons are redirected within the hemisphere of origin, forming the longitudinal bundles of Probst. The presence of this bundle suggests that callosal agenesis is a secondary phenomenon.
Hypothalamic hamartoma is an uncommon dysgenesis, not neocortical, but which is associated with widespread functional changes in the hemispheres as manifest by retardation, epilepsy, behavioural disturbances and cognitive decline (Breningstall, 1985; Berkovic et al.,1988).
This survey of dysgenesis has highlighted abnormalities seen histopathologically in some forms of cerebral maldevelopment. Entities may occur together, and sometimes a single diagnosis cannot be made in vivo. Thus gyral abnormalities, subependymal heterotopia and full-thickness clefts may be seen in association. Such cases show that causative agents may act diffusely in time and space, and that it is the time at, and for, which such insults occur that dictates the resulting abnormalities, rather than the particular nature of the insult.
1.6. Abnormalities in dysgenesis: localised or widespread?
clinical features and relevance of each of the various types of dysgenesis. However, the detailed anatomy and pathophysiology of the diseases are rarely documented, and rarely too are clues available as to the actual cause of the anomaly (Raymond et al.,1995) , though many possible causes are recognised (Barth, 1987). Thus although the associations with epilepsy, developmental delay, neurological abnormalities and mental retardation are well documented, the pathogenesis remains mysterious.
Many reports of dysgenesis describe it as a localised abnormality of brain anatomy, for example as perisylvian polymicrogyria (Kuzniecky et al.,1994). This is based on visual inspection alone, whether on neuroimaging, at surgery or at postmortem. It is often inferred that structural abnormalities are limited solely to the visible extent of the lesion. Such localisation is unlikely, however, both because of the nature of the insults causing symptomatic dysgenesis, which are likely to act widely, and because of the high degree of connectivity in the human cerebrum, resulting in secondary disruption of cerebral structure. These factors will now be discussed in some detail.
1.6.1. Evidence for extensive abnormalities in dysgenesis: connectivity
Extensive changes in cerebral constitution following a focal neocortical lesion have also been shown in the fetal cat (Loopuijt et al.,1995). Changes in gyral patterns were seen in both the ipsilateral and contralateral hemispheres. In addition, there were volume reductions in the ipsilateral hemisphere, attributed to alterations in neuronal number outside the lesion. The alterations were thought to have been mediated by connectivity as targets for remaining neurons and projections from ablated neurons were both removed. Interestingly, volume reduction was associated with proposed connectional abnormalities.
In general, gyral changes are likely to reflect underlying changes in structural and functional cytoarchitecture (Rademacher et al.,1993), the greater proportion of the volume of gyri being connectional in nature (Haug, 1956). In all these animal experiments, interneuronal connectivity is altered and shown to have morphogenetic potency. Dysgenesis, in these cases experimental rather than accidental, in one area is seen to have effects on distant areas of the brain.
hypothalamic hamartomata (Cascino et al.,1993), often with unchanged semiology, also supports this, and further evidence comes from reoperation series (Salanova et al.,1994). These observations suggest that functional abnormality, whatever its basis, extends over more of the brain than the lesion itself appears t o .
brain
Cowan et al. (1984) have demonstrated that cells in the central nervous system are unlikely to remain alive unless they are connected. Areas of CD are alive and functional (eg Palmini et al.,1995); thus, given the high degree of connectivity in the brain and the presence of abnormalities in the apparatus of this connectivity in CD, it would seem likely that there might be abnormalities in other regions in dysgenetic brain, in particular of those areas that are connected to the obviously dysgenetic region. This is postulated to be the explanation for the findings of Goldman and Galkin (1978) , and of Barron (1950) . It forms the theoretical ultrastructural background for the opinion that extensive structural abnormality explains failure of surgical treatment in some cases of human epilepsy caused by dysgenesis.
1.6.2. Evidence for extensive abnormalities in dysgenesis: causes of dysgenesis
other exogenous agents, such as X-irradiation and ethanol.
Based on this diverse evidence, it would seem likely that structural and functional abnormalities in brains with apparently focal CD should be extensive and spread beyond the boundaries of the visualised lesion alone. This is in terms of the lesion itself, most causes of which are likely to have a diffuse effect, and in terms of areas connected to the lesion, which are likely to be additionally disrupted because they are connected to the dysgenetic area.
1.7. Aims of thesis
The aims of the thesis were to test the following hypotheses, based on the clinical problem and the anatomical facts presented above:
1. That structural abnormalities in the human brain affected by cerebral dysgenesis should extend beyond the visualised boundary of the apparently focal lesion itself.
2. That the existence of structural order in the normal brain should be quantitatively demonstrable:
(a) measures of cortical surface area should correlate with grey matter volume, if cortical thickness is limited in its variability and
(b) cortical surface area measures should correlate with callosal cross-sectional area.
3 . That there may be disruption of any such correlations in brains of patients with epilepsy.
5. That patients with subependymal heterotopia should be quantitatively different from patients with other sorts of dysgenesis associated with epilepsy, because of the clinical differences seen (Raymond et al.,1994a).
Possible mechanisms underlying structural disorder in the dysgenetic brain are suggested on the basis of the results and their interpretation. Other, unsuspected, findings are also discussed.
CHAPTER 2; MAGNETIC RESONANCE IMAGING OF THE BRAIN
2.1. Application of hypotheses to MRI data
In order to test the hypotheses, it is necessary to be able to determine whether there are cerebral structural abnormalities present where none can be seen on routine inspection of MRI scan data. New ways are required of extracting more of the data present in high resolution scans.
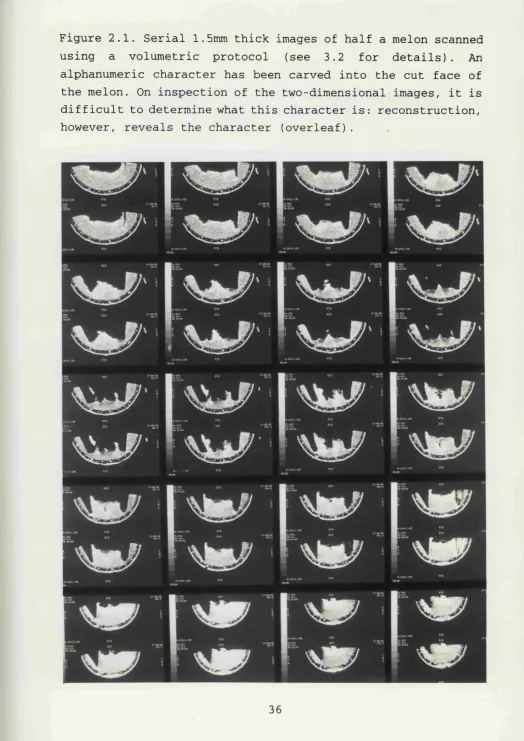
From the biological perspective, according to the hypotheses put forward in the previous chapter, subtle alterations in cerebral structure associated with cerebral dysgenesis, but not visible to the eye, should be associated with alterations in the neuropil beyond the visualised boundaries of the lesion itself. Neuropil alterations may be qualitative, as they are in some visible CD lesions (for example with blurring of the grey-white interface), or quantitative, with more or less neuropil than expected. Qualitative or quantitative neuropil changes might be associated with gyral changes, as local cytoarchitecture is one factor affecting gyral structure (Rakic, 1988; Rademacher et al.,1993) . Subtle gyral changes may easily be missed if the complex three-dimensional cortex is sliced and viewed in two dimensions. Three-dimensional visualisation of a three- dimensional object may increase comprehension of that object
(Fig 2.1).
High resolution MRI data may be reconstructed into three- dimensional representations, allowing in vivo visualisation of the surface gyral pattern. Abnormalities of the surface pattern may then be detected by comparison with normal subjects' patterns. There are a number of ways of achieving such comparisons, and these are critically reviewed below.
Figure 2.1. Serial 1.5mm thick images of half a melon scanned using a volumetric protocol (see 3.2 for details). An alphanumeric character has been carved into the cut face of the melon. On inspection of the two-dimensional images, it is difficult to determine what this character is: reconstruction, however, reveals the character (overleaf).
and relative signal intensity can be determined. Alterations in any of these parameters, if localisable, might determine whether the postulated hypotheses are tenable. The determination of these characteristics of the neuropil requires that it be identifiable on MRI data and that spatial measurement be possible. The presence of "abnormal" neuropil outside the visible boundaries of the lesion would be in support of the hypothesis that CD is an extensive disorder of brain structure.
In order for these aims to be achieved, data from MRI must first be analysed so that different tissues of interest are identified and treated separately. On routinely viewed images, CSF, grey matter, white matter and any other particular regions of interest (ROI's) must be isolated. This process is known as segmentation and is the basis of most quantitative MRI-based analysis. Segmentation is required even for visual inspection of three-dimensional reconstructions of the cerebral surface. In view of the fundamental importance of the segmentation process to this thesis, some time will be spent considering it, before methods of using the information it produces are contemplated.
2.2. Segmentation
(determined by cost and the need for patient compliance) , spatial resolution within images, the number of slices and their separation and tissue contrast. Different tissues can appear very different under altered imaging parameters; the choice of parameters is governed by the requirements of the study.
Data presented in this report were acquired so that hemispheric anatomy could be examined in detail whilst minimising scan duration. A key requirement was the ability to clearly image the hippocampus so that its volume could be measured with minimum partial volume effects and greatest accuracy. A high resolution T^-weighted volume scan was used. The scan generated 124 coronal slices each 1.5mm thick with in-plane display resolution of 0.9mmx0.9mm. This sequence proved ideal for the measurement of the volume of the hippocampus (Cook et al.,1993) and for detailed examination of the hemispheres in patients with cryptogenic partial epilepsy. It also allowed the data to be reformatted, increasing the yield of structural abnormalities (Raymond et al.,1993). So that all studies were comparable, no changes were made in the sequence parameters during the course of the study. When this study was started, the majority of the data reported had already been acquired, limiting the segmentation and postprocessing methods that could be employed.
2.2,1, Intensity Thresholding
The commonest method of segmentation of one region from another depends on identifying voxels of chosen intensity and linking them in certain ways in order to produce a spatial boundary between groups of voxels of different intensity characteristics (Kennedy et al.,1987). Boundaries may be closed to form a region-of-interest (ROI) containing voxels with intensities lying within certain bounding values
(thresholds).
The process usually involves an operator visually identifying a border and setting a threshold parameter to the intensity level of voxels in the identified border. Automatic algorithms then create a closed connected boundary within the image by reference to this threshold and rules that govern the growth of the boundary. The encompassed area is the ROI. Further thresholds higher or lower than the initial one may also be set to limit voxel inclusion within the ROI more precisely. Various modifications of this fundamental process have been devised. One such is that new areas, satisfying threshold requirements, to be considered for inclusion within an ROI should be connected to the existing ROI by a given minimum number of voxels. This criterion helps limit the spread of the ROI into areas of an intensity falling between the chosen thresholds but which are not biologically part of the ROI, thus aiding distinction, for example, of meninges from the surface of the grey matter.
the same postmortem brains by fluid displacement methods. The technique requires calculations to be performed for each study to be segmented. It can account for slice-by-slice voxel intensity changes due to radiofrequency (RF) inhomogeneity. However, it cannot account for within-slice RF inhomogeneity, which was present in the data used in this thesis: it was therefore unsuitable for this work.
2.2.2. Multispectral analysis
This was first introduced for MRI in 1985 by Vannier et al. It is a powerful method of automatic segmentation, unaffected by RF inhomogeneity even within slices. When pixel intensities from two tissue types (eg brain and CSF) from T2-
tissues that constitute the bulk of the segmented areas, is largely due to manual interaction. A further major problem with multispectral analysis is that current scanners may not allow the acquisition of volumetric (thin slice, contiguous) scans using the sequences required for cluster analysis: Blatter et al. used 5mm thick slices with 2mm gaps, which entail a loss of resolution when compared with the 1.5mm thick contiguous slices used in this thesis.
Feature map segmentation with clusters separated using nonparametric techniques was reported by Jackson et a l .
(1994) . They found volumes comparable with those produced by groups using other techniques, including intensity thresholding and direct postmortem volume measurements. They commented that "for optimal reproducibility, all data should be analysed by a single observer", but acknowledged that this is not usually feasible for longer term and larger studies. For such studies, training of observers and easily applied rules for manual interaction are important. Whilst both operator training and rule usage were explored in this thesis, the results presented derive from segmentation performed by the author alone.
Yet more sophisticated means of segmentation are continually being devised. Amongst these are the application of neural network theory to "train" automated segmentation processes and the extension of cluster analysis to three classification dimensions using coregistered T\-, Tg- and proton-density-weighted scans. All these clustering methods require specific programming and could not have been used on the data available.
2.2.3. Choice of segmentation method for this study
thresholds were changed as required between and regionally within slices to account for RF inhomogeneity. Other ways of correcting for RF inhomogeneity, such as the use of flood phantoms, though apparently satisfactory, cannot represent the real brain and its complexity and loading characteristics
(Harris et al.,1994).
Intensity thresholding with semi-automated, manually- supervised, segmentation was used for this thesis because:
(i) it is simple and easy to use: no additional programming or help was required to achieve segmentation using a intensity-thresholding based dedicated workstation
(ii) it is reliable (see below)
(iii) it ensures each slice of data has to be examined
(iv) it is flexible and leaves control with the operator (unlike some automated packages) and allows compensation for RF inhomogeneity
(v) it allows the specification and application of user- defined boundaries.
cannot compare the "accuracy" of automated determinations of the grey-white interface with that of visually-guided determination: this would require a gold standard which does not exist. In these circumstances, the critical issue becomes less one of microscopic precision, provided the choice is anatomically sensible, and instead one of reproducibility, within and between subjects and operators. Reproducibility using multispectral analysis is not necessarily higher: in
fact, interrater reliability of segmentation in the current study, using intensity thresholding, was comparable with segmentation using multispectral analysis (as reported by Blatter et al.,1995; note that some operator interaction was still required in their report), and intrarater reliability was much higher (see section 3.13.) . Also for cluster analysis, the use of relatively thick slices would have been necessary (see above), with an associated price with respect to overprojection errors. The segmented images produced in this study were of a quality sufficient for both further quantitative analyses and visual inspection. In addition, this study was undertaken on data most of which had already been acquired, in a form unsuitable for multispectral analysis.
The price of using intensity thresholding is that the process is time-consuming and labour-intensive; over 1000 hours of operator interaction was required for collection of the data reported here. The original data were segmented using a proprietary package that was, however, very user-friendly and did not require additional programming by experts in image processing or computer software. For more general utility,
these are important considerations.
2.3. Post-segmentation processing
2.3.1. Visualisation of surface-rendered images
Having generated suitable surface renderings, the normal range of variation of surface gyral patterns needs to be determined so that abnormal gyri may be identified.
The human brain is an anisotropic shape, variable in detail between individuals. Even monozygotic twins may have discordant gyral patterns (Steinmetz et al.,1994) . The precise amount of intersubject variability has not been formally determined in the population, though large control series have examined the amount of variation in three-dimensional shape in about 3 00 subjects. All quantitative attempts at comparison of brain shapes require the presence in the brain of some reference frame which can be used to align different brains so that they may be compared. In most of the literature, the aim of the work has been to allow registration of a brain either to itself (imaged in different modalities or over time) or to a model "normal" brain (Collins et al.,1994) . The doyen in this field, Bookstein, has produced a method of aligning brains using statistical deformation techniques (see Bookstein, 1991). For midsagittal MR images of the brain, alignment satisfying various requirements is achieved by identification of (at least) four midsagittal landmarks and then deformation of an individual brain to maximally align these landmarks to a template derived from the statistical alignment of the same landmarks from a number of individuals. This allows a "normalised" midsagittal image to be generated for each individual. Evans et al. (1992) have taken coregistration further and generated a three-dimensional "average" shape from 250 normal subjects. It should be noted that their average brain has very few identifiable sulci.
specifically distorted during the registration process, so that individual regional distribution of volume is disturbed or lost. Such individual detail relates closely to cytoarchitectonie fields and may provide a better guide to functional localisation than does reference to an idealized brain (Rademacher et al.,1993). In addition, intersubject registration presupposes that some degree of homogeneity exists between the averaged brains - or if not present initially, that it can be produced by preliminary deformation. Brains with CD associated with gyral anomaly may have unique gyral patterns that are radically different from most normal brains, making coregistration with a normal (or "average") brain difficult. For the purpose of identification of abnormal gyri, the end result is unhelpful, though quantification of the process required in an individual, less distorted, case to achieve registration with the average brain might give some idea of the specific shape of that brain. This possibly useful and sophisticated technique for gyral analysis was not available to the author.
Visual determination of gyral abnormalities from three- dimensional images, on the other hand, does not suffer from these problems of averaging out valuable information. Allowances can more easily be made for differing brain and
hemisphere sizes (which can be quantified subsequently), and for torques in the major brain axes (Kertesz et al.,1990), in the same sophisticated way that human visual processing can, for example, identify many differently shaped, stylised and incomplete forms of letters as those letters (eg a: A a a; a . . . . ) . This is achieved, however, at the expense of introducing subjectivity and increased processing time. Depending on the specific surface rendering model chosen, variation apart from that due to biology may also be
identity and class of the subject being examined. By viewing all three-dimensional representations from all perspectives, specific projection biases can be addressed. Provided that a large enough control group is available for visual comparison, this technique should allow detection of gyral abnormalities.
Nevertheless, there may be better ways of examining surface-rendered images. Curvature-based models can overcome problems generated by external lighting models, surface voxels on the reconstruction having, for example, brightness values according to local curvature determined with respect to the position of neighbouring voxels (Andreasen et al.,1994) . Such models may prove useful in the future, as areas identified visually as being abnormal can be located precisely from the data and be described quantitatively based on spatial coordinates and local curvature indices.
2.3.2. Quantitative analyses
The interdependence of structure, as measured by cerebral whole and part volumes, and function has long been a topic of interest - both scientific and political. Functional localisation in the brain has been shown to relate to some extent to local cytoarchitecture (von Economo, 192 9; Rakic, 1988; Rademacher et al.,1993). On this basis, many workers have sought to relate malfunction to specific quantified changes in cerebral volume. For studies using MRI data, volumes are almost invariably estimated using the Cavalieri principle (Gundersen and Jensen, 1987; Mayhew and Olsen,
error varies approximately inversely with the number of slices (Henery and Mayhew, 1989) . The use of one single slice is therefore associated with a large error, whilst the use of 120 or so slices (for whole hemispheres) , as in this study, is associated with a very small expected coefficient of error. This number of slices is not necessary to estimate hemispheric volume to a small predicted error, but is required to maintain the same small degree of error when regions of the hemisphere are examined; detailed surface renderings also benefit from the use of a large number of thin slices.
The area measured on any given MR I slice will suffer from overprojection error increased by slice thickness, such that slices thicker than 4mm generate errors of at least 5% in volume measures in phantoms (Filipek et al.,1989). Hennig (1969) showed that for spherical objects in histological preparations, the "correction coefficient" for volume estimation due to finite section thickness is
l/{l + 1 . 5 (section thickness/object diameter)}
This formula is not strictly applicable to MRI, but approximates to the error found by Filipek et al. (1989) for 4mm slices. Measurements using thicker slices of smaller objects (eg 5mm slices of the hippocampus) would be associated, on this basis, with errors of the order of 80%. Therefore data must be cautiously interpreted when inadequately thin slices are employed. For 1.5mm slices of the cortex, the overprojection error is of the order of 1.5%, an acceptable figure given the degree of volume change being studied.
Conditions in which volume measurements have received much interest include normal development and aging, Alzheimer's disease, schizophrenia, HIV infection and Down's
relate them to clinical findings. Some of these will now be reviewed.
Normal cerebral anatomy and volumes have been extensively studied. The measurement of the volumes of whole brain have been discussed above (see methods of segmentation). Regional analyses have also been performed. Kertesz et al. (1990) made several claims about cerebral asymmetry based on linear and area measurements of lobar extents. This work is significantly flawed as there are numerous biases introduced by their methodology: in particular the use of single transverse slices through complex objects to determine their extent and shape is invalid - a single slice, not chosen randomly, cannot be representative of the entire three-dimensional structure to within an acceptable coefficient of error.
marked partial volume effects (exaggerated by their thick slices and slice orientation), whilst other slices were excluded because the automatic segmentation algorithm did not work in them. The amount of brain thus excluded from their analysis is not determined; given the anisotropic structure of the brain, this introduces a bias for which no correction is possible (or attempted). Further bias is introduced by their regional analysis. In the slices they have selected for analysis, they measure grey and white matter volumes in only the outer 45% of tissue on any given slice; the inner 55% could not be analysed reliably by their automated segmentation method. If some individuals have deeper - or more shallow - sulci than others, different proportions of grey and white matter will be excluded in different individuals, making them incomparable. Undetermined amounts of grey and white matter are thus nonrandomly excluded from selected slices and segmented by a method that does not appear to be robust. Their extensive discussion, founded on unreliable data, can be given little weight. This paper illustrates the many pitfalls to which volumetric MRI analysis is prone. It is not an encouraging standard for automated segmentation; the advantage gained in time and ease of analysis would seem to be entirely lost by the unreliability of the results obtained.
Blatter et al. (1995) provide a large database of normative volumetric data from MRI studies. In contrast to the report by Pfefferbaum et al., they use what would appear to be a more robust segmentation method, that is commercially available and which allows them to use all the data available in each study. They also acknowledge the need to account for inhomogeneity in data acquisition. They determined interrater and intrarater reliability coefficients for their technique. These are high except for repeat segmentations of the grey and white matter (the majority of the volume of the hemispheres!) . Their intrarater coefficients for these tissues are 0.763
least partly for these comparatively low intrarater reliability coefficients and illustrates the importance of rigorous definition of boundaries independently of their specific positioning by segmentation.
The report by Filipek et al. (1994) is the most rigorous of these studies of the normal brain. However, there are a number of issues that should be discussed. The first is that prior to analysis of their data, they performed positional "normalisation" and resampling. As no regional estimations were performed and the entire data set analysed and volumes calculated by the Cavalieri principle, the need for this is not clear. That the normalised data were resampled prior to segmentation introduces interpolational changes that cannot be quantified and are not mentioned. Secondly, an entirely automatic segmentation is performed, within defined anatomical boundaries (that are given in some detail). It is said that this reduces the error produced by visual choice of interfaces. This of course is true, as the choice is not visual. However, that the choice is automated does not imply that it is necessarily any more accurate or valid (see above and section 3.6.) . Curiously, these authors do not discuss the reliability of their technique.
subjects, so that their boundary definitions of many regions, that are governed by anatomical landmarks, are equally applicable to both groups of subjects. However, individuals with Down's syndrome have many anthropometric abnormalities: they are, for example, usually much shorter than controls. The authors attempt to adjust for this for this particular discrepancy statistically. They do not provide any evidence, however, that brain shapes are not different between the groups or that any differences in shape might be completely accounted for by adjustment for height (unlikely a priori, as shape is three-dimensional), so that one cannot be confident of all their conclusions. Some of their results may simply be a measure of brain shape dissimilarity; these may well relate to underlying cytoarchitectural disruption and be what Raz et al. are actually measuring. In addition, Raz et al. "correct" their original data for the effects of head tilt, pitch and rotation by using standard neuroanatomical landmarks and bringing each brain into a unified system of coordinates: all of this assumes, as above, that all the brains have shapes similar enough for this to be meaningful.