University of Pennsylvania
ScholarlyCommons
Publicly Accessible Penn Dissertations
1-1-2015
Identification of Long-Range Regulatory Elements
in the Human Genome
Yih-Chii Hwang
University of Pennsylvania, [email protected]
Follow this and additional works at:
http://repository.upenn.edu/edissertations
Part of the
Bioinformatics Commons
This paper is posted at ScholarlyCommons.http://repository.upenn.edu/edissertations/1773
For more information, please [email protected].
Recommended Citation
Hwang, Yih-Chii, "Identification of Long-Range Regulatory Elements in the Human Genome" (2015).Publicly Accessible Penn Dissertations. 1773.
Identification of Long-Range Regulatory Elements in the Human
Genome
Abstract
Genome-wide association studies have shown that the majority of disease-associated genetic variants lie
within non-coding regions of the human genome. Subsequently, a challenge following these discoveries is to
identify how these variants modulate the risk of disease. Enhancers are non-coding regulatory elements that
can be bound by proteins to activate the expression of a gene that may be linearly distant. Experimentally
probing all possible enhancer–target gene pairs can be laborious. Hi-C, a technique developed by Job Dekker’s
group in 2009, combines high-throughput sequencing with chromosome conformation capture to detect
DNA interactions genome-wide and thereby reveals the three-dimensional architecture of chromatin in the
nucleus. However, the utility of the datasets produced by this technique for discovering long-range regulatory
interactions is largely unexplored.
In this thesis, we develop novel approaches to identify DNA-interacting units and their interactions in Hi-C
datasets with the goal of uncovering all enhancer–target gene interactions.
We began by identifying significantly interacting regions in these datasets, subsequently focusing on candidate
enhancer–gene pairs. We found that the identified putative enhancers are enriched for p300 binding activity,
while their target promoters are likely to be cell-type-specific. Furthermore, we revealed that enhancers and
target genes often interact in many-to-many relationships and the majority of enhancer–target gene
interactions are intra-chromosomal and within 1 Mb of each other.
Next, we refined our analytical approach to identify physically-interacting DNA regions at ~1 kb resolution
and better define the boundaries of likely enhancer elements. By searching for over-represented sequences
(motifs) in these putative promoter-interacting enhancers, we were then able to identify bound transcription
factors. This newer approach provides the potential to identify protein complexes involved in
enhancer–promoter interactions, which can be verified in future experiments.
We implemented a high-throughput identification pipeline for promoter-interacting enhancer elements
(HIPPIE) using both of the above described approaches. HIPPIE can be run efficiently on typical Linux
servers and grid computing environments and is available as open-source software. In summary, our findings
demonstrate the potential utility of Hi-C technologies for elucidating the mechanisms by which long-range
enhancers regulate gene expression and ultimately result in human disease phenotypes.
Degree Type
Dissertation
Degree Name
Doctor of Philosophy (PhD)
Graduate Group
Genomics & Computational Biology
First Advisor
Li-San Wang
Second Advisor
Brian D. Gregory
Keywords
Chromatin, Chromosomal structure/function, Genomics, Genomic structure, Regulation of transcription
Subject Categories
Bioinformatics
IDENTIFICATION OF LONG-RANGE REGULATORY ELEMENTS IN THE HUMAN GENOME
Yih-Chii Hwang
A DISSERTATION
in
Genomics and Computational Biology
Presented to the Faculties of the University of Pennsylvania
in
Partial Fulfillment of the Requirements for the
Degree of Doctor of Philosophy
2015
Supervisor of Dissertation: Co-Supervisor of Dissertation:
_________________________ _________________________
Li-San Wang, Ph. D. Brian D. Gregory, Ph. D.
Associate Professor of Pathology Assistant Professor of Biology
and Laboratory Medicine
Graduate Group Chairperson:
_________________________
Li-San Wang, Ph. D.,
Associate Professor of Pathology and Laboratory Medicine
Dissertation Committee:
Doris Wagner, Ph.D., Professor of Biology
Uwe Ohler, Ph.D., Professor of Biology, Max Delbrueck Center, Berlin
Nancy Zhang, Ph.D., Associate Professor of Statistics
IDENTIFICATION OF LONG-RANGE REGULATORY ELEMENTS IN THE HUMAN GENOME
© COPYRIGHT
2015
Yih-Chii Hwang
This work is licensed under the
Creative Commons Attribution
NonCommercial-ShareAlike 3.0
License
To view a copy of this license, visit
iii
ACKNOWLEDGMENT
First, I would like to extend my deepest gratitude to both of my advisors, Li-San Wang
and Brian D. Gregory for their support and supervision. Furthermore, having the guidance from
both of them has broadened my horizons in the field of science, transformed me into a more
mature person, and made my past six and a half years such a memorable experience.
I would like to thank my thesis committee members: Doris Wagner, Uwe Ohler, Gerard D.
Schellenberg, Nancy Zhang, for their guidance and encouragement throughout all the years.
I am grateful for the lab members from both the Wang and the Gregory labs. They are not
only good colleagues but also good friends. In particular, I would like to thank Yuk Yee (Fanny)
Leung, Pavel Kuksa, Chiao-Feng Lin, Kajia Cao, Fan Li, Qi Zheng, Matthew Willmann, Ian
Silverman, Nathan Berkowitz, Lee Vandivier, Alexandre Amlie-Wolf, and Otto Valladares for their
camaraderie and invaluable scientific conversations.
I would like to acknowledge my GCB fellows, especially Ellen Tsai, Jun Chen, Scott
Sherrill-Mix, Ying Chen, Hannah Dueck, Sarah Middleton, Zhang (Eric) Chen, and Yuchao Jiang
for the classes we attended together and their sharing this precious graduate school experience
at Penn with me. I would like to thank the staffs at GCB, Hannah Chervitz, Tiffany Barlow, and
Maureen Kirsch for their management of this program. . A special thank is given to Rebecca
Cweibel and Postdoctoral Editors Association for helping me on editing my thesis writings.
My spectacular appreciation goes to my boyfriend, Hsin-Ta Wu, for always being my best
friend and his patience with me through the ups and downs in my life.
Last but not the least, I owed a great debt of gratitude to my family: my mother, father,
iv
ABSTRACT
IDENTIFICATION OF LONG-RANGE REGULATORY ELEMENTS IN THE HUMAN GENOME
Yih-Chii Hwang
Li-San Wang
Brian D. Gregory
Genome-wide association studies have shown that the majority of disease-associated
genetic variants lie within non-coding regions of the human genome. Subsequently, a challenge
following these discoveries is to identify how these variants modulate the risk of disease.
Enhancers are non-coding regulatory elements that can be bound by proteins to activate the
expression of a gene that may be linearly distant. Experimentally probing all possible enhancer–
target gene pairs can be laborious. Hi-C, a technique developed by Job Dekker’s group in 2009,
combines high-throughput sequencing with chromosome conformation capture to detect DNA
interactions genome-wide and thereby reveals the three-dimensional architecture of chromatin in
the nucleus. However, the utility of the datasets produced by this technique for discovering
long-range regulatory interactions is largely unexplored.
In this thesis, we develop novel approaches to identify DNA-interacting units and their
interactions in Hi-C datasets with the goal of uncovering all enhancer–target gene interactions.
We began by identifying significantly interacting regions in these datasets, subsequently
focusing on candidate enhancer–gene pairs. We found that the identified putative enhancers are
enriched for p300 binding activity, while their target promoters are likely to be cell-type-specific.
v
relationships and the majority of enhancer–target gene interactions are intra-chromosomal and
within 1 Mb of each other.
Next, we refined our analytical approach to identify physically-interacting DNA regions at
~1 kb resolution and better define the boundaries of likely enhancer elements. By searching for
over-represented sequences (motifs) in these putative promoter-interacting enhancers, we were
then able to identify bound transcription factors. This newer approach provides the potential to
identify protein complexes involved in enhancer–promoter interactions, which can be verified in
future experiments.
We implemented a high-throughput identification pipeline for promoter-interacting
enhancer elements (HIPPIE) using both of the above described approaches. HIPPIE can be run
efficiently on typical Linux servers and grid computing environments and is available as
open-source software. In summary, our findings demonstrate the potential utility of Hi-C technologies
for elucidating the mechanisms by which long-range enhancers regulate gene expression and
vi
TABLE OF CONTENTS
ABSTRACT ... IV
TABLE OF CONTENTS ... VI
LIST OF TABLES ... IX
LIST OF ILLUSTRATIONS ... X
CHAPTER 1 : INTRODUCTION ... 1
1.1 Gene regulation in eukaryotic genomes ... 1
1.1.1 Transcriptional regulation of gene expression ... 1
1.1.2 The non-coding human genome ... 1
1.1.3 Non-coding genetic variants and their functional impact ... 2
1.1.4 Enhancer elements: DNA regulatory sequences that control distal gene expression . 3 1.1.5 Enhancer elements: DNA regulatory sequences that affect phenotype by controlling distal gene expression ... 4
1.1.6 Chromatin signatures of enhancer elements ... 6
1.2 Experimental approaches to identify functional regulatory elements... 7
1.2.1. Luciferase reporter assay ... 7
1.2.2. Creating element knockouts by targetable DNA cleavage engineering... 8
1.3 Experimental technology to determine the physical interactions of DNA regions ... 9
1.3.1 Traditional and small scale methods — chromosome conformation capture and fluorescence in situ hybridization ... 9
1.3.2 3C variants – 4C, 5C, and ChIA-PET ... 13
1.3.3 Hi-C and long-range regulatory interactions ... 13
1.4 Computational methods and challenges for predicting enhancer–promoter pairs ... 15
1.4.1 Nearest gene ... 15
1.4.2 Expression quantitative trait loci (eQTL) ... 15
1.4.3 Correlation of DHS or histone modifications ... 16
1.4.4 Co-evolution between the elements ... 16
1.5 Outline of dissertation ... 17
CHAPTER 2 : A GENOME-WIDE APPROACH FOR PREDICTING ENHANCER
AND PROMOTER INTERACTIONS ... 19
2.1 Introduction... 19
2.1.1 Traditional high-throughput methods on identifying enhancer elements — ChIP-seq and conservation ... 19
2.1.2 From Hi-C sequencing to DNA–DNA interactions ... 21
vii
2.2.1 Workflow for discovering enhancer elements and their target genes ... 22
2.2.2 Geometric-based model for identifying hotspot and extended hotspot... 27
2.2.3 Characterization of DNA interacting extended hotspots ... 33
2.2.4 Candidate enhancer elements are enriched in activating histone marks ... 35
2.3 Discussion ... 41
2.4 Materials and methods ... 43
2.4.1 Comparisons between replicates ... 43
2.4.2 Identification of CEEs enriched in activating histone modifications ... 43
CHAPTER 3 : GLOBAL CHARACTERIZATION OF LONG-RANGE
REGULATORY ELEMENTS AND THEIR TARGET GENES ... 45
3.1 Enhancers and their target genes are enriched in binding activities associated with gene expression ... 45
3.2 Enhancers and target promoters are enriched in enhancer-associated motifs ... 53
3.3 Enhancers are conserved within vertebrates ... 56
3.4 Tissue-specific expression of the target genes ... 58
3.5 Discussion ... 58
3.6 Materials and methods ... 61
CHAPTER 4 : A HIGH-THROUGHPUT IDENTIFICATION PIPELINE FOR
PROMOTER INTERACTING ENHANCER ELEMENTS (HIPPIE) ... 64
4.1 Introduction... 64
4.2 Integration of multiple genomic datasets in ENCODE ... 65
4.3 Using HIPPIE ... 68
4.4 Comparison with other tools... 69
4.5 Materials and methods ... 71
4.5.1 Coverage threshold for restriction fragments (Hi-C peak identification) ... 71
CHAPTER 5 : IDENTIFYING THE TRANSCRIPTION FACTORS MEDIATING
ENHANCER–TARGET GENE REGULATION IN THE HUMAN GENOME ... 75
5.1 Abstract ... 75
5.2 Introduction... 76
5.3 Results ... 79
5.3.1 Hi-C processing pipeline for identifying physically-interacting regions ... 79
5.3.2 Detecting and annotating significant regulatory interactions ... 85
5.3.3 Interactions between regulatory elements overrepresented in PIR–PIR interactions 87 5.3.4 Transcription factor binding motif occurrences in PIR–PIR interactions ... 89
viii
5.5 Materials and methods ... 94
CHAPTER 6 : CONCLUSIONS AND FUTURE DIRECTIONS ... 110
6.1 Summary of findings ... 110
6.2 Future directions: applications to genetic research ... 112
6.2.1 Predicting regulatory interactions ... 112
6.2.2 Interpreting disease-related non-coding genetic variants using enhancer–promoter interacting pair information ... 113
6.2.3 Cell differentiation and tissue-specificity long-range interactions ... 114
6.3 Concluding remarks ... 115
ix
LIST OF TABLES
Table 1-1. Experimental protocols to capture chromatin conformation. ... 12
Table 2-1. Characterization of extended hotspots. ... 26
Table 2-2. Number of CEEs present after each filtering step ... 36
Table 3-1. Comparison of the CEEs predicted using Hi-C and enhancer predictions in 5C (Sanyal et al., 2012) ... 48
Table 3-2. Characteristics of enhancer–target interactions ... 50
Table 3-3. Average number of reads support for intra- and inter-chromosomal interactions of CEEs and their target promoters. ... 52
Table 3-4. (a) Top 3 most enriched motifs for all CEEs using the whole-genome as the background sequence in the K562/HindIII library. (b) Top 10 most enriched motifs in CEEs from the GM/NcoI library using extended hotspots as the background. ... 54
Table 4-1. Comparison among Hi-C processing pipelines ... 70
Table 5-1. Hi-C data and mapping result. ... 80
Table 5-2. Annotation quantities for significant interactions. ... 88
Table 5-3. Annotation quantities on all interactions (including non-significant interactions). ... 88
x
LIST OF ILLUSTRATIONS
Figure 1-1. An example of genetic variants in an enhancer element affecting a human phenotype.
... 5
Figure 1-2. A schematic of the Hi-C protocol that can be used to detect the 3D structure of
chromosome folding in eukaryotic nuclei. ... 11
Figure 2-1. Genome-wide enhancer element identification workflow. ... 24
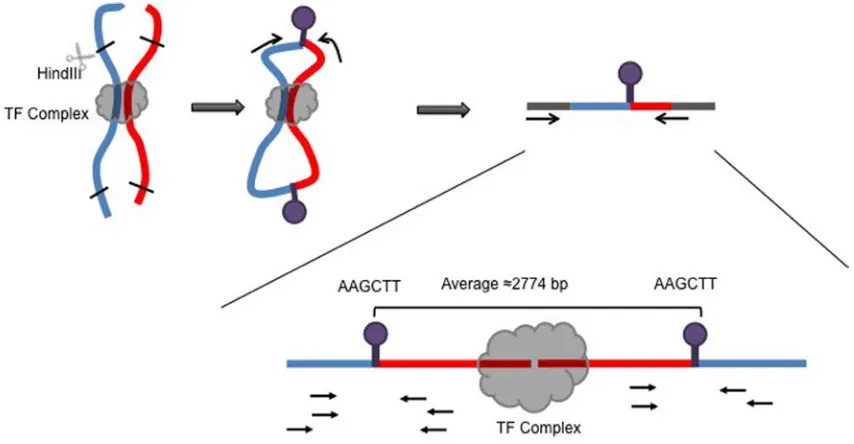
Figure 2-2. Identification of potential enhancer elements by our novel analysis pipeline requires
an extension of regions that have been termed DNA interacting hotspots from the 3C data as
depicted. ... 25
Figure 2-3. Gap lengths follow a geometric distribution along each chromosome in the Hi-C
sample GM/NcoI. ... 28
Figure 2-4. Cluster lengths follow a geometric distribution along each chromosome in the Hi-C
sample GM/NcoI. ... 30
Figure 2-5. Additional analyses with a more relaxed cutoff (98% geometric distribution-based test)
for identifying DNA–DNA interacting hotspots. ... 31
Figure 2-6. Additional analyses with a more relaxed cutoff (99.9% geometric distribution-based
test) for identifying DNA–DNA interacting hotspots. ... 32
Figure 2-7. Functional annotation of extended hotspots for sample. (a) GN/HindIII, (b) GM/NcoI,
and (c) K562/HindIII. ... 34
Figure 2-8. Read support for CEE–promoter interactions in the three Hi-C samples. (a)
GM/HindIII, (b) GM/NcoI, and (c) K562/HindIII. ... 38
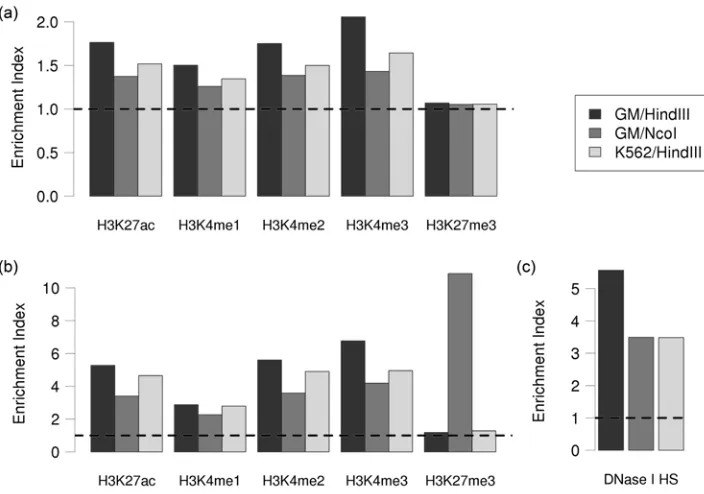
Figure 2-9. Potential enhancer elements are enriched for activating histone marks and DNase I
hypersensitive sites. ... 40
Figure 3-1. Potential enhancer elements are enriched for p300 binding, and their target genes are
xi
Figure 3-2. Potential enhancer elements are evolutionarily conserved, and their target genes are
expressed in a cell-type-specific manner. ... 57
Figure 3-3. Characterization of CEE–target gene interaction distance. ... 60
Figure 4-1. An overview of HIPPIE ... 66
Figure 4-2. The quality control flow for HIPPIE phase III and phase IV. ... 72
Figure 5-1. Hi-C re-analysis workflow for finding physically-interacting regions (PIRs) and identifying protein factors mediating regulatory interactions. RS: Restriction Site. ... 80
Figure 5-2. Hi-C model and identification of DNA physically-interacting region. ... 82
Figure 5-3. PIRs cover (a) open chromatin and (b) CTCF binding sites. (c) Increase percentage test for DNA regions overlapping with open chromatin, CTCF, and occupancies of RNA Polymerase II and p300. ... 84
Figure 5-4. Regulatory epigenetic marks are enriched at PIRs with significant intra-chromosomal interactions compared to all PIRs as the background (including the ones that are not significantly interacting with other PIRs). ... 86
Figure 5-5. (a) Motif discovered in enhancers interacting with other elements. (b) Motif discovered in promoters interacting with other elements. ... 91
Figure 5-6. Motif pairs discovered in enhancer–promoter interactions with corresponding protein pairs co-exist in the same complex as shown by experimental evidence for physically interactions (e.g. co-IP, two-hybrid, co-localization, etc.). ... 92
Figure 5-7. Definition of mappability. ... 98
Figure 5-8. Find all read-pairs with ligation junctions. ... 101
Figure 5-9. Identify physically-interacting regions. ... 103
1
Chapter 1 : Introduction
1.1 Gene regulation in eukaryotic genomes
1.1.1 Transcriptional regulation of gene expression
In 1956, Francis Crick coined the idea of “the central dogma of molecular biology” to
describe the general flow of biological information through the three major biomolecules: DNA,
RNA, and proteins (Crick, 1956, 1970). Through transcription, information along chromosomal
DNA gets copied into messenger RNA (mRNA), and through translation, proteins are synthesized
using the mRNA as a template. The entire transcriptional process to generate mRNA molecules
is regulated by a group of proteins known as transcription factors. More specifically, these
transcription factors can recognize the DNA sequences encoded within the chromosomes and
control the level of mRNA expression. This transcription regulation is involved in many
fundamental aspects of biology, including embryonic development, cellular differentiation, and cell
fate. In other words, gene regulation processes control what each cell in the organism is doing,
how a tissue functions, and how organisms survive and reproduce.
1.1.2 The non-coding human genome
Interestingly, less than 2% of the human genome actually encodes protein sequences
(Elgar and Vavouri, 2008). Thus, it was not surprising that as a follow-up to the Human Genome
Project, the Encyclopedia of DNA Elements (ENCODE) project was launched in 2003 and aimed
to identify all “functional elements” in the human genome using a broad range of experimental
assays to study the functions of non-coding genomes such as chromatin immunoprecipitation,
DNase hypersensivity profiling, cap analysis gene expression for localization of transcription start
2
the human genome has biochemical functions (Bernstein et al., 2012), and many (95%) of these
are expressed, non-protein-coding regions that may function to regulate the expression of
protein-coding loci.
1.1.3 Non-coding genetic variants and their functional impact
In recent years, considerable progress in genome-wide association studies (GWAS) and
the development of high-throughput sequencing technologies have allowed the discovery of an
incredible collection of genetic variants within the human population, many of which are
significantly correlated with human disease phenotypes. These discoveries of disease-risk loci
have brought genetic researchers toward the post-GWAS era where there are more unanswered
questions, such as how a non-protein-coding locus affects cellular fate or influences a phenotype,
than there are answered ones.
To date, it has been shown that non-coding DNA regions can produce functional types of
RNA molecules. These include transfer RNAs (tRNAs), which are involved in translation of
mRNA, Piwi-interacting RNAs (piRNAs), which are linked to post-transcriptional gene silencing in
animal germ line cells, and microRNAs (miRNAs), which function in the post-transcriptional
regulation of gene expression and/or translation repression.
In addition to being transcribed into functional RNA molecules, non-coding DNA regions
can also regulate the transcriptional and/or translational activities of protein-coding genes via
different mechanisms. Those DNA regions, called regulatory elements, function as footprints of
transcription factors and thereby regulate mRNA expression and in turn, protein production. In
eukaryotic organisms, typical types of regulatory elements include promoters, enhancers, and
3
1.1.4 Enhancer elements: DNA regulatory sequences that control distal gene
expression
In vertebrate and mammalian genomes, protein-coding genes are not only regulated by
specific sequence elements proximal (near) to their transcription start sites or promoter regions,
but also by distal (far) and orientation-independent elements such as enhancers. Of the types of
regulatory elements noted above, enhancers are considered to be long-range regulatory
elements because they can be located millions of nucleotides (nts) away from the gene(s) they
regulate and even reside on a different chromosome (Banerji et al., 1981; Geyer et al., 1990;
Lomvardas et al., 2006). Enhancers typically range in size from ~100 base pairs (bp) (Catena et
al., 2004) to several kilobases (kb) (Chi et al., 2005), with an average length of 500 bp (Marshall
et al., 2001).
In many eukaryotic genomes, chromatin looping between regulatory elements that are
distant from one another along the chromosome is widely observed and appears to be a general
mechanism for establishing long-range functional interactions. Enhancers can activate
transcription of target genes that are located far away through binding of a protein complex that
facilitates the formation of loops between the enhancer and these genes. However, this kind of
long-range regulatory element interaction is extremely rare in yeast systems. For instance, the
GAL4 activator can only enhance gene expression when the DNA binding site is within a few
hundred bp of the regulated locus (Guarente and Hoar, 1984; Struhl, 1984).
It is believed that enhancer elements mostly function to regulate gene expression in a
tissue-specific manner and thus effect different sets of genes in different tissues (Visel et al.,
2009). These regulatory events can also contribute to the determination of cell fate, the potential
for differentiation into new cell types throughout development, and the maintenance of specific
gene expression programs through epigenetic modification of the genome (Creyghton et al.,
4
animal development (Levine, 2010; Wilber et al., 2011). Therefore, discovering long-range
regulatory elements genome-wide is necessary to fully understand gene expression regulation in
animals as well as during their development.
1.1.5 Enhancer elements: DNA regulatory sequences that affect phenotype by
controlling distal gene expression
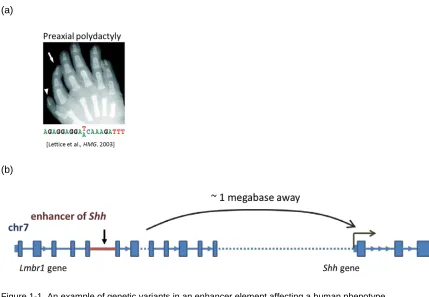
An example where an enhancer element variant affects a human phenotype can be
found within the enhancer that regulates the sonic hedgehog gene (Shh) (Lettice et al., 2003). This variant disrupts the binding of a transcription factor to an enhancer element that regulates
Shh, resulting in limb malformation. More specifically, it has been demonstrated that a genetic variant located in the 5th intron of the Lmbr1 gene does not affect expression of this gene, but
affects the Shh locus located 1 megabase (Mb) away. Thus, these variants in the Lmbr1 intron were recognized to affect an enhancer element of Shh, a gene whose tight regulation is necessary for proper limb development in mammals (Figure 1-1). This example suggests that an
enhancer, working as a trans-regulatory element, may not necessarily regulate the protein-coding gene containing it or located nearby, but may instead control the expression of a gene that is
distant along the chromosome and thereby affect a phenotype change (for more discussion,
5 (a)
(b)
Figure 1-1. An example of genetic variants in an enhancer element affecting a human phenotype.
(a) A single nucleotide variant can cause paraxial polydactyly. (b) The Shh enhancer and variant are located
6
1.1.6 Chromatin signatures of enhancer elements
It has recently been demonstrated that chromatin modifications can be regarded as
indicators of the transcriptional regulatory function and activity of certain types of genomic loci. It
became possible to describe the chromatin architecture of regulatory elements using the
molecular biology technique known as chromatin immunoprecipitation (ChIP) with antibodies that
directly detect specific covalent modifications of histone proteins. For example, this approach
revealed that monomethylated histone 3 lysine 4 (H3K4me1) is spanning a broader region and
strongly enriched at nearly all active enhancer elements, and occurrences of these H3K4me1
marks correlate with the transcriptional activity of nearby genes (Heintzman et al., 2007). In
addition, it has been suggested that acetylation of histone H3 lysine 27 (H3K27ac) is an important
enhancer mark that can be used to distinguish whether an enhancer element is at the state of
being active or being poised (predetermined). Thus, it is not surprising that genomic locations with
H3K27ac enrichment are highly diverse between various cell types in humans (Creyghton et al.,
2010). With the development of high-throughput sequencing technology, the use of ChIP followed
by sequencing (ChIP-seq) (Johnson et al., 2007) has become highly prevalent and this approach
has made it possible to survey chromatin modifications on a genome-wide scale (Barski et al.,
2007). In December 2008, ENCODE started to integrate and aggregate ChIP-seq datasets of
histone modifications (e. g. H3K4me1, H3K27ac) for a number of commonly studied human cell
lines including lymphoblastoid cells (GM12878), chronic myelogenous leukemia cells (K562), and
many others. This provides genomic researchers with the resources to identify and explore
putative enhancer elements on a genome-wide scale.
An additional genomics technique that has been used for regulatory element identification
is the mapping of DNase I hypersensitive (DHS) sites, a method that reveals chromatin regions of
eukaryotic genomes that are open and accessible to DNA-binding transcription factors (Gross
and Garrard, 1988; Wu et al., 1979). Again, by combining DHS mapping with high-throughput
7
a genome-wide scale. In addition, formaldehyde-assisted identification of regulatory elements
followed by high-throughput sequencing (FAIRE–seq) can identify open chromatin regions by
depleting histone-bound 'closed' DNA after being chemical crosslinking with formaldehyde (Giresi
et al., 2007). Thus, previous studies have used these approaches to identify active enhancers,
defined by open chromatin regions that are distal to protein-coding genes, and active promoters,
defined by open chromatin regions that are proximal to the transcription start sites of
protein-coding gene regions (Thurman et al., 2012). In total, genome-wide datasets of chromatin
modifications and open chromatin states are important resources for predicting active enhancer
elements (Ernst et al., 2011; Hoffman et al., 2012).
1.2 Experimental approaches to identify functional regulatory
elements
1.2.1. Luciferase reporter assay
To determine whether a DNA element of interest displays regulatory activity, one can
clone and fuse the putative regulatory element to a luciferase reporter gene (McNabb et al., 2005).
Because the reporter construct contains a promoter with minimal activity (e.g. SV40), reporter
expression is directly correlated with the activity of the included regulatory element. Using this
reporter gene assay, one can estimate the strength of the regulatory element. However, one
cannot use this technique to identify the specific promoters that the regulatory element activates
8
1.2.2. Creating element knockouts by targetable DNA cleavage engineering
To identify the function of a locus, one can make mutations (often times a deletion)
specifically in that locus, and observe the resulting gene expression change or phenotype. This
strategy is known as reverse genetics. Below, I review two popular genetic engineering
approaches to study the function of specific genetic loci.
Zinc-Finger Nucleases (ZFN)
ZFNs originated from the observation by Li et al. (Li et al., 1992) that the natural type IIS
restriction enzyme FokI has physically separable DNA-binding and cleaving activities. The cleavage could be redirected to other DNA sequences by substituting alternative DNA-recognition
domains for the natural one. The most useful DNA-binding domain that has been combined with
the FokI DNA cleavage activity consists of three Cys2His2 zinc fingers (ZFs), each of which can
recognize 3 bp of DNA in a modular fashion (Pavletich and Pabo, 1991). This remarkable
modularity of ZFs suggested that many different combinations of ZFs can be assembled that
would recognize different DNA sequences for cleavage. Adding more fingers can improve
specificity, but there is also the possibility that fingers in a polydactyl domain will bind to off-target
sites. There are also specificity challenges for ZF binding since some fingers can bind equally
well to any triplet nt sequence (Carroll, 2011). In total, it can be challenging to design and validate
ZF proteins for specific DNA locus binding.
CRISPR-Cas9
In selected bacteria and archaea, the functions of Clustered Regularly Interspaced Short
Palindromic Repeats (CRISPRs) and CRISPR-associated (Cas) genes are essential for adaptive
immunity (Mojica et al., 2000). More specifically, this is an essential mechanism by which these
organisms respond to invading genetic material (e.g. bacteriophage genomes). The
9
which it binds. The gRNA anneals to target DNA sequences and thereby can be used to direct
Cas9’s endonuclease activity to any desired site in the genome. Recently, using engineered
gRNAs, this system has been found to be an efficient tool that can successfully manipulate and
edit the mouse and human genomes with site-specific changes (Cong et al., 2013; Doudna and
Charpentier, 2014; Jinek et al., 2012; Mali et al., 2013).
Overall, ZFN and CRISPR-Cas9 are useful tools for knocking down and thereby
discovering the function of DNA regulatory elements. However, these approaches will not reveal
the target gene(s) of these regulatory elements.
1.3 Experimental technology to determine the physical interactions of
DNA regions
1.3.1 Traditional and small scale methods — chromosome conformation capture
and fluorescence in situ hybridization
Chromosome conformation capture (3C) and fluorescence in situ hybridization (FISH) are the two major molecular approaches for studying genome organization and nucleus
compartmentalization. These strategies can successfully identify long-range DNA interactions
and estimate the likelihood that two DNA regions along the genome interact with each other in the
three-dimensional space of a nucleus. In the next few paragraphs, we highlight these
low-throughput but high-quality methods as well as the insights gained from each of them.
Chromosome Conformation Capture (3C)
3C can be used to detect whether a pair of DNA fragments are interacting via a protein
10
crosslinking is followed by digesting the genomic DNA with a restriction enzyme and then
performing a proximity ligation reaction between the two interacting DNA regions. To detect if a
pair of DNA regions are interacting, PCR primers are designed to amplify the ligation products of
the suspected interacting regions. The first use of this protocol was to demonstrate that the yeast
third chromosome forms a 3D contorted ring structure (Dekker et al., 2002). When performing a
3C experiment, it is important to perform internal control experiments to address possible biases
such as PCR efficiency differences between primer pairs, assess the level of random background
interactions, and properly normalize data (Dekker, 2006).
Fluorescent in situ hybridization (FISH)
FISH is a cytogenetic technique that was first developed and introduced in 1982
(Langer-Safer et al., 1982) that can be used to localize and visualize the presence of DNA sequences of
interest along the chromosome, even during interphase or in an intact nucleus in living cells
(Edelmann et al., 2001). By designing fluorescent probes hybridizing to the complementary DNA
sequences of interest and using fluorescence microscopy, one can visualize where the probe is
bound on the genomic DNA. FISH is often used for studying features in DNA in both medical
diagnostics and basic research (Nath and Johnson, 2000).
By designing FISH probes for pairs of DNA sequences of interest, the presence or
absence of a spatial interaction relationship between the two DNA regions can be directly
visualized. However, this technique requires severe treatment that may affect the organization of
the chromosomes (Dekker et al., 2002), can analyze only a limited number of DNA loci
simultaneously (Williamson et al., 2014), and does not reveal if the DNA–DNA interaction is due
11
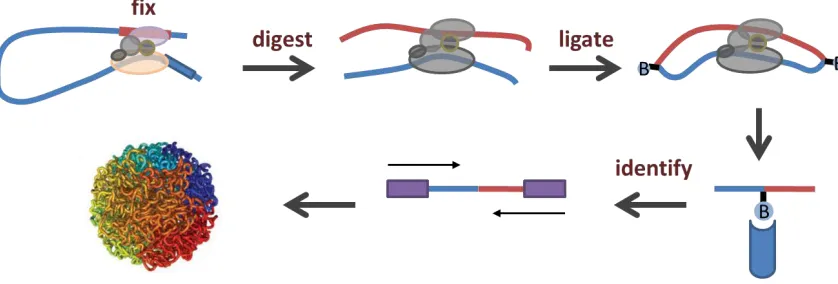
Figure 1-2. A schematic of the Hi-C protocol that can be used to detect the 3D structure of chromosome
folding in eukaryotic nuclei.
Protein–DNA interactions are first fixed by formaldehyde treatment and then the genomic DNA is digested
by a specific restriction enzyme (e.g. HindIII, NcoI, or MboI). The digested restriction sites are then filled in
with biotinylated dNTPs and the interacting DNA fragments undergo proximity ligation (blunt-end ligation).
The biotinylated DNA molecules are then pulled down using streptavidin beads and these are used for
paired-end sequencing library construction for identifying DNA–DNA interactions globally. The chromatin
architecture model figure was adapted from a figure by Lieberman-Aiden et al. (Lieberman-Aiden et al.,
12
Table 1-1. Experimental protocols to capture chromatin conformation.
3C 4C Capture-C 5C ChIA-PET Hi-C
Scale
One-by-one One-by-all Many-by-all
Many-by-many
Many-by-many All-by-all
Detection PCR or sequencing
Inverse PCR sequencing
Sequencing
Multiplexed LMA sequencing
13
1.3.2 3C variants – 4C, 5C, and ChIA-PET
There are several variations of 3C that extend the protocol from low-throughput to
high-throughput detection of DNA–DNA interactions. While they all take advantage of the development
of high-throughput sequencing techniques to identify DNA–DNA interactions, each one has a
different focus (Table 1-1). One example, 4C is used for identifying all the interacting partner
regions for one single locus at a time (Simonis et al., 2006; van de Werken et al., 2012; Zhao et
al., 2006). Additionally, 5C detects all the interacting partners amongst a set of loci (Dostie et al.,
2006), while ChIA-PET combines chromatin immunoprecipitation with a crosslinking and ligation
procedure to capture the DNA–DNA interactions that are formed by a protein of interest (Fullwood
et al., 2009). Capture-C is another variation that allows us to identify the interacting partner
regions for a specific set of DNA regions of interest by designing probes for purifying those loci,
which is followed by generation of sequencing libraries. These 3C variants allow us to connect
chromatin structure to gene regulation (Dixon et al., 2012; Kalhor et al., 2012; Li et al., 2012; Rao
et al., 2014; Shen et al., 2012; Zhang et al., 2013), to study DNA replication timing (Ay et al.,
2014; Pope et al., 2014; Ryba et al., 2010), or to explore somatic copy number alterations (De
and Michor, 2011; Fudenberg et al., 2011). Lastly, Hi-C captures and surveys DNA–DNA
interactions genome-wide in a non-biased manner (Figure 1-2), that requires no prior knowledge
for the interacting DNA regions. (Duan et al., 2010; Kalhor et al., 2012; Lieberman-Aiden et al.,
2009). I discuss more details about Hi-C in the next section (Section 1.1.3).
1.3.3 Hi-C and long-range regulatory interactions
In 2009, Lieberman-Aiden and colleagues. developed a genome-wide version of
chromosome conformation capture (Hi-C) (Lieberman-Aiden et al., 2009), which uses
high-throughput sequencing technology that allows the global identification of DNA–DNA interactions
14
organizing principles and chromatin folding as well as the three-dimensional (3D) architecture of
the human genome (Dixon et al., 2012; Lieberman-Aiden et al., 2009; Nagano et al., 2013; Rao et
al., 2014).
In Hi-C, the interacting DNA regions and their binding proteins are cross-linked by
formaldehyde, restriction sites are digested, and proximity ligation is performed with biotinylated
dNTPs filling in the restriction enzyme cut sites (Figure 1-2). The biotinylated dNTP allows for
streptavidin bead-mediated pull down to capture pairs of ligated DNA fragments. After reversing
of the crosslinks and size-selection of the ligated artificial DNA interacting molecules, sequencing
libraries are constructed to interrogate the sequences and utilized to create an interaction map on
a genome-wide scale.
Other than investigating the folding principle of chromatin, Hi-C data can also be applied to
other applications such as genome assembly and haplotyping (Burton et al., 2013; Selvaraj et al.,
2013) and locating centromeres and ribosomal DNA (Marie-Nelly et al., 2014; Varoquaux et al.,
2015). Currently, it is recognized that the 3D architecture of chromatin can affect gene regulation
and genome function. Unfortunately, the resolution of this original experimental iteration is limited
by the distribution of cleavage sites for the specific restriction enzymes used within the genome.
Ideally, this approach could be a powerful means for identifying the long-range interactions
between enhancer elements and the promoters they regulate, but it was not used for this purpose
initially because of this methodological shortcoming.
Other than numerous human and mouse cell lines, Hi-C-like data are also available for
organisms such as yeast (Duan et al., 2010; Marie-Nelly et al., 2014; Mizuguchi et al., 2014;
Tanizawa et al., 2010), bacteria (Le et al., 2013), Drosophila melanogaster (Hou et al., 2012; Li et al., 2015; Sexton et al., 2012), and Arabidopsis thaliana (Feng et al., 2014; Wang et al., 2015). Understanding how Hi-C analysis methods work has become important with the increasing
15
1.4 Computational methods and challenges for predicting enhancer–
promoter pairs
1.4.1 Nearest gene
The most common approach for predicting enhancer–promoter interactions is to assign
the nearest cis-promoter along the chromosome as the target of the enhancer element. An improvement to this method can be performed by adding insulator sites as a constraint on
deciding which gene is regulated (Ernst et al., 2011; Heintzman et al., 2009). However, the
example described in Section 1.1.5 has shown that the gene (Lmbr1) which is harboring the enhancer is not its regulated target gene, but a linearly far away (around 1 Mb) gene (Shh) is. Additionally, only 27% of enhancers have an interaction with their nearest promoter based on
recent ENCODE analysis (Sanyal et al., 2012). This suggests that the nearest gene along the
chromosome is not always the only candidate for describing the function of a distal regulatory
element.
1.4.2 Expression quantitative trait loci (eQTL)
eQTL studies can identify putative regulatory variants that influence gene expression.
These studies determine if transcript levels of a set of protein-coding genes vary among a panel
of individuals in correlation with their genotypes, which is usually at the risk alleles at GWAS loci
(Cheung et al., 2003; Gilad et al., 2008; Stranger et al., 2007). Thus, eQTL analyses can be
applied to detect candidate regulatory links between SNPs and their target genes.
Although eQTLs can suggest which genes are regulated by the intergenic alleles, the
interpretations of the results can be challenging. First, the association could result from the
16
Second, the SNP associated with the target gene may not be the causal SNP. Any SNPs in the
same haplotype or linkage disequilibrium (LD) block as the eQTL could be the actual causal SNP.
Third, the association is correlative and may reflect indirect regulation between SNPs and genes
(Fehrmann et al., 2011).
1.4.3 Correlation of DHS or histone modifications
The mapping of DNase I hypersensitive sites (DHS) has been utilized to identify
regulatory regions including enhancers, promoters, insulators, and so on (Gross and Garrard,
1988; Wu et al., 1979). In combination with high-throughput sequencing technologies, the
mapping of DHS was boosted to a genome-wide scale and called DNase-seq (Crawford et al.,
2004; Sabo et al., 2004). Using DHS profiles examined across multiple cell types, one can
observe whether pairs of enhancer and promoter DNA regions are simultaneously accessible or
inaccessible to DNase (Thurman et al., 2012). Similarly, one can search for a correlation between
the histone modification patterns at active enhancers and the transcript levels of their nearby
coding-genes and thereby predict linkages between enhancer states and target genes (Ernst et
al., 2011). These approaches demonstrate that epigenetic data can be used to assist the
prediction of functional enhancer–promoter interactions. However, these correlations are limited
as they do not prove direct regulation, and it would be computationally expensive to ascertain all
possible pairs of DNA regions in the human genome.
1.4.4 Co-evolution between the elements
If a pair of DNA sequences (an enhancer and a promoter) function concordantly, it is
expected that the sequence pair would be evolutionary conserved together among species, and
17
(Ahituv et al., 2005; Kikuta et al., 2007). One can utilize these concepts to predict enhancer–
promoter interactions by identifying pairs of DNA sequences that are co-conserved and having a
level of synteny across species (He et al., 2014). Nonetheless, this estimation based on
evolutionary constraints lacks information on whether a pair of shared synteny DNA sequences is
functioning directly as forming physical interactions between the enhancer and the promoter. In
addition, since enhancer may change rapidly during evolution (Shibata et al., 2012), observing
co-conserved DNA sequences may be insufficient for discovering all possible pairs of enhancer–
promoter elements in the human genome.
1.5 Outline of dissertation
On the whole, the analyses of data derived from Hi-C and its related approaches have
yielded important insights into the functional and regulatory significance of the three-dimensional
structure of DNA. Moreover, these datasets can also be important resources for high-throughput
identification of long-range regulatory elements and their interacting promoter partners. In this
thesis, I focus on identifying enhancer–promoter interactions within Hi-C datasets to improve our
understanding of the mechanisms by which enhancer elements regulate gene expression. To do
this, I have developed a series of novel approaches toward identifying high-throughput DNA–DNA
interactions using pre-existing Hi-C datasets. I also further characterized these important
regulatory interactions, and discovered many of the protein complexes that bridge and mediate
these events.
In Chapter 2, I describe our analytical approach for re-analyzing Hi-C data and calling
interacting hotspots along the chromosome that are interacting with other hotspots. Using this
approach, I specifically identify putative enhancer elements and their target gene promoters
18
In Chapter 3, I characterize the identified enhancer–target gene pairs by investigating the
transcription factor binding sites contained within these enhancer elements and their target gene
promoters. I also examine the conservation level of the identified enhancer elements and the
extent to which their targeted genes were expressed in a cell-type-specific manner. Additionally, I
discover that the relationship between enhancer elements and their target genes are
many-to-many. I also discover transcription factor binding sites that are overrepresented in the enhancer
elements when they are in contact with promoters.
In Chapter 4, I present an automated pipeline called HIPPIE that processes raw Hi-C
data through the steps of mapping, normalization, integrating epigenetic marks, and reporting
candidate enhancer elements and their target promoters. This pipeline is designed to run on
high-performance computing clusters.
In Chapter 5, I switch my focus towards the task of understanding how enhancers select
the correct promoters with which to interact genome-wide. To approach this, I describe a model I
developed that explicitly bins the genome into meaningful physically-interacting DNA regions
(PIRs). I then determine the transcription factor binding sites (TFBSs) that are overrepresented in
enhancer PIRs when they are interacting with promoters, enhancers, exons, introns, or other
intergenic PIRs. Furthermore, I reveal pairs of TFBSs that are overrepresented in enhancers and
their interacting promoters, respectively, as well as identified candidate transcription factor
complexes that can mediate enhancer–promoter interactions.
Finally, in Chapter 6, I summarize the computational methods I developed and the
biological characteristics of the long-range regulatory pairs I have uncovered. I also highlight
potential applications of our identified enhancer–promoter pairs with their characteristics, and
possible uses of the transcription factor binding motifs we discovered to be overrepresented in
19
Chapter 2 : A genome-wide approach for predicting enhancer
and promoter interactions
This Chapter references work from:
Hwang, Y.-C., Zheng, Q., Gregory, B.D., and Wang, L.-S. (2013). High-throughput identification
of long-range regulatory elements and their target promoters in the human genome. Nucleic Acids Res. 41, 4835–4846. doi:10.1093/nar/gkt188
2.1 Introduction
2.1.1 Traditional high-throughput methods on identifying enhancer elements —
ChIP-seq and conservation
While the Human Genome Project was declared complete in 2003, many regulatory
elements still remain undefined. Enhancers are one such class of elements because true
definition of an enhancer requires identification of both the regulatory sequence as well as its
interacting promoter region(s). Enhancer–target identification is further complicated by the fact
that they interact in an orientation-independent manner, can be millions of base pairs away from
each other, or even reside on different chromosomes (Banerji et al., 1981; Geyer et al., 1990;
Lomvardas et al., 2006). Enhancer elements also have dynamic regulatory activities under
various developmental and environmental conditions. For instance, they can activate gene
expression in a tissue- and temporal-specific manner. Thus, they affect different sets of genes in
different tissues (Visel et al., 2009), and/or play variable regulatory roles during animal
20
property is the locus-control region (LCR) that regulates the cluster of five human β-type globin
genes on 11p15.4 (Wilber et al., 2011). These globin genes are exclusively expressed in
erythroid cells, and are expressed differentially in fetal and adult cells mediated by the LCR that is
located about four kilobases (kb) upstream.
Recent studies reveal that in eukaryotes, histone modifications such as histone 3 lysine
27 acetylation (H3K27ac), histone 3 lysine 4 mono-methylation (H3K4me1), di-methylation
(H3K4me2), and tri-methylation (H3K4me3) can play crucial roles in the activation of enhancer
elements under different environmental conditions, cell lineages, tissue types, or developmental
stages (Creyghton et al., 2010; Heintzman et al., 2007, 2009; Roh et al., 2007; Visel et al., 2009).
These activating histone marks tend to be present in enhancer elements that are activated and
absent when they are repressed. Additionally, activated regulatory elements are more likely to be
located within the context of accessible (open) chromatin where they can be bound by
transcription factors. The accessibility of specific DNA sequences can be determined by their
sensitivity to digestion by DNase I, with open chromatin being highly digested and vice versa.
Recently, large scale studies of activating (e.g. H3K27ac) histone marks and DNase I
hypersensitive sites (DHSs) such as those from the Encyclopedia of DNA Elements (ENCODE)
(Dunham et al., 2012; The ENCODE Project Consortium, 2004) have been used in various
human cell-types to predict enhancer elements (Creyghton et al., 2010; Heintzman et al., 2009).
Additionally, other high-throughput studies assaying E1A binding protein p300 and CREB binding
protein (CBP) interaction sites have also been used to discover putative enhancers (Lee et al.,
2011; Rödelsperger et al., 2011; Visel et al., 2009). Although these studies can predict enhancer
elements on a large scale, they suffer from the inability to globally identify the target gene
21
2.1.2 From Hi-C sequencing to DNA–DNA interactions
Although the mechanism of enhancer–target promoter interaction formation is still not
well understood, it is commonly accepted that enhancers and promoters interact with each other
through a transcription factor protein complex (Schoenfelder et al., 2010). Based on this model,
the chromosome conformation capture (3C) approach can be used to identify enhancer elements
as well as their target genes simultaneously by detecting two linearly independent DNA segments
that are bound to one another via a protein complex. One major drawback of the 3C approach is
that it requires prior knowledge of the putative enhancer and promoter elements to allow design
of specific PCR primers, which is often unknown. To address this limitation, a high-throughput
version of 3C was developed (Hi-C) (Lieberman-Aiden et al., 2009) to detect genome-wide DNA–
DNA interaction events. This approach avoids multiple PCR steps by ligating interacting DNA
elements followed by high-throughput sequencing in order to provide unbiased identification of
DNA–DNA interacting pairs. Several variants have been developed by other groups to identify the
chromosome organization and regulatory sites of the human, yeast, and Drosophila melanogaster
genomes (Duan et al., 2010; Kalhor et al., 2012; Sexton et al., 2012; Tanizawa et al., 2010).
However, these original studies focused on determining large-scale, chromosomal organization,
and did not demonstrate whether the high-throughput sequencing variant of 3C is sensitive or
specific enough for prediction of enhancer–promoter interactions.
More recently, Chepelev et al. (Fullwood and Ruan, 2009) developed ChIA-PET, which is
a strategy that combines 3C with ChIP-seq, for an enhancer associated histone modification
(H3K4me2) to identify intra-chromosomal enhancer–promoter interactions (Chepelev et al.,
2012). This led to the successful identification of only intra-chromosomal enhancer–promoter
interactions that were associated with a specific histone modification (H3K4me2). Another recent
study applied the variant 3C method (carbon-copy chromosome conformation capture (5C)) to
identify ~one hundred enhancers and their specific target genes by designing ~6000 primers
22
studies were at the genome-wide scale, they have demonstrated that datasets produced by the
3C method can be used for genome-wide identification of enhancer–target promoter interactions.
Here, we revisit the original Hi-C experimental data with the goal of identifying enhancer–
target gene interactions on a genome-wide scale for humans. To do this, we developed a new
analysis framework for Hi-C experiments that integrates multiple genome-wide, enhancer-defining
datasets to identify enhancer–target gene pairs. Using this approach, we identified thousands of
high confidence enhancer–target promoter interactions in two different human cell types. We
validated these interaction pairs by demonstrating our putative enhancer elements are highly
correlated with known p300 binding sites, and their target gene promoters are enriched in RNA
Polymerase II (Pol II) binding. Furthermore, we found that the predicted enhancer elements are
conserved in the mammalian lineage, and their target genes are expressed in a highly
cell-type-specific manner. In total, our pipeline has allowed the first robust and genome-wide discovery of
thousands of novel enhancer–promoter interactions in the human genome.
2.2 Identification of candidate enhancer elements and their target
genes
2.2.1 Workflow for discovering enhancer elements and their target genes
We built an analysis workflow that extracts high-quality DNA interacting sites from Hi-C
datasets. Figure 2-1 shows the overall workflow for identifying these DNA interacting hotspots,
which we analyzed further in order to identify putative enhancer elements and their promoter
partners. All three samples from the original Hi-C study (Lieberman-Aiden et al., 2009) were used
in our analyses (cell line GM06990 with restriction enzymes HindIII and NcoI, as well as cell line
23
original Hi-C study used a 1 megabase (Mb) window size to uncover the three-dimensional
organization of human nuclear chromosomes. However, this resolution is far too coarse for
studying regulatory elements, which requires single nucleotide resolution. To improve resolution
for our purposes of identifying DNA interacting hotspots, we applied our genomic
distribution-based analysis for identification of these specific genomic regions (Zheng et al., 2010). Briefly,
our algorithm first identifies clusters of Hi-C reads that are closer to each other than what the
background geometric distribution dictates. We then labeled the resulting clusters as hotspots if
their lengths on the chromosomes are longer than 99% of all clusters (for more discussion,
please see Section 2.2.2). We found that a hotspot is on average ~1 kb in length, and between
107,059 and 185,042 total hotspots were identified in each of the three samples. The Hi-C
method dictates that sequencing reads will start at or near the sites of the restriction enzyme
used in the experiment rather than the actual DNA–DNA interaction site. Therefore, the resolution
of this method is limited to the distance between the restriction sites of the particular restriction
enzyme (RE) used for that study (Figure 2-2). To account for this shortcoming, we extended the
length of the originally identified DNA interacting hotspots based on the estimated length between
RE site positions on each human nuclear chromosome, while also allowing each nucleotide of an
extended hotspot to represent the true interaction site. We found that on average an extended
hotspot is 3–3.3 kb long (Table 2-1), indicating that our resolution has improved ~300-fold
24
25
Figure 2-2. Identification of potential enhancer elements by our novel analysis pipeline requires an extension
26
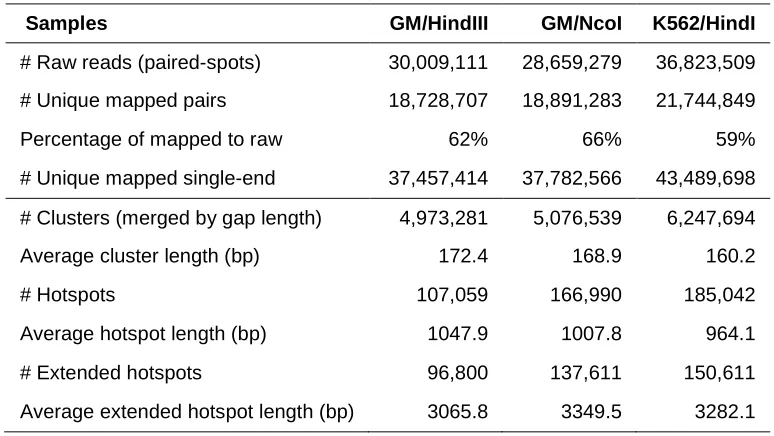
Table 2-1. Characterization of extended hotspots.
Samples GM/HindIII GM/NcoI K562/HindI
# Raw reads (paired-spots) 30,009,111 28,659,279 36,823,509
# Unique mapped pairs 18,728,707 18,891,283 21,744,849
Percentage of mapped to raw 62% 66% 59%
# Unique mapped single-end 37,457,414 37,782,566 43,489,698
# Clusters (merged by gap length) 4,973,281 5,076,539 6,247,694
Average cluster length (bp) 172.4 168.9 160.2
# Hotspots 107,059 166,990 185,042
Average hotspot length (bp) 1047.9 1007.8 964.1
# Extended hotspots 96,800 137,611 150,611
Average extended hotspot length (bp) 3065.8 3349.5 3282.1
27
2.2.2 Geometric-based model for identifying hotspot and extended hotspot
We first identified significant clusters in the Hi-C data using a geometric
distribution-based model (Zheng et al., 2010). To do this, we first assembled all mapped reads for a given
dataset (GM/HindIII, GM/NcoI, or K562/HindIII) into consecutive contigs (made up of overlapping
reads) for each nuclear chromosome, without initially considering the read pairing information for
these libraries. This approach allowed us to determine the gap regions between the identified
contigs. These gap lengths should follow a geometric distribution:
where Xi and pi are the gap lengths and the probability of a position covered by any read on
chromosome i, respectively. Accordingly, we fit the gap lengths to a geometric distribution for each chromosome (Figure 2-3) and estimated pi based on the mean gap length. We then
grouped contigs into clusters by merging nearby contigs based on the gap distances between
them. Specifically, contigs were merged into significant clusters if they are closer to each other
28
Figure 2-3. Gap lengths follow a geometric distribution along each chromosome in the Hi-C sample
GM/NcoI.
The black circles represent the observed distance between each consecutive contig (gap lengths), and the
red line represents the empirical cumulative geometric distribution estimated using the observed mean. The
29
Next, we identified high confidence DNA interacting hotspots by fitting cluster lengths to
an additional geometric distribution for each nuclear chromosome (Figure 2-4), where the Xi
value is based specifically on cluster length and the pi value is the emission probability based on
the mean cluster length calculated for the Hi-C data for chromosome i. Only the significant clusters (length greater than or equal to the 99th percentile) identified with this second geometric
distribution-based test were retained and defined as DNA interacting hotspots. It is worth noting
that we did not take into account the Hi-C interaction data for these hotspots during this analysis
step, but only looked for interacting partners during our analysis to identify those hotspots that are
putative enhancer elements (see below). We also analyzed DNA interacting hotpots identified
using the quantiles of 98% and 99.9%, and the results of these analyses are presented in Figure
30
Figure 2-4. Cluster lengths follow a geometric distribution along each chromosome in the Hi-C sample
GM/NcoI.
The black circles represent the observed cluster lengths, and the red line represents the empirical
cumulative geometric distribution estimated using the observed mean. The distributions for the samples
31
Figure 2-5. Additional analyses with a more relaxed cutoff (98% geometric distribution-based test) for
identifying DNA–DNA interacting hotspots.
(a–b) Fold enrichment for activating (H3K27ac and H3K4me1 – 3) and repressive (H3K27me3) histone
marks with (a) all CEEs that have a promoter interaction, and (b) CEEs whose promoter interaction is
supported by > 1 read (P values < 0.001). (c) Fold enrichment of DNase I hypersensitive sites in CEEs with
a promoter interaction supported by > 1 read and enriched in activating histone marks (P values < 0.001).
The three samples are marked as follows; black bars: GM/HindIII; gray bars: GM/NcoI; and light gray bars:
32
Figure 2-6. Additional analyses with a more relaxed cutoff (99.9% geometric distribution-based test) for
identifying DNA–DNA interacting hotspots.
(a–b) Fold enrichment for activating (H3K27ac and H3K4me1 – 3) and repressive (H3K27me3) histone
marks with (a) all CEEs that have a promoter interaction, and (b) CEEs whose promoter interaction is
supported by > 1 read (P values < 0.001). (c) Fold enrichment of DNase I hypersensitive sites in CEEs with
a promoter interaction supported by > 1 read and enriched in activating histone marks (P values < 0.001).
The three samples are marked as follows; black bars: GM/HindIII; gray bars: GM/NcoI; and light gray bars:
33
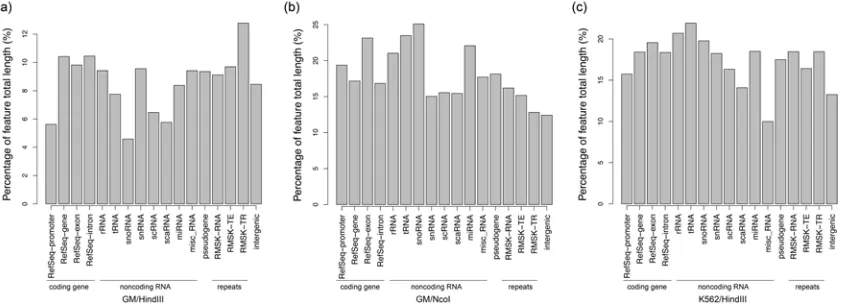
2.2.3 Characterization of DNA interacting extended hotspots
We classified all extended hotspots based on human genome annotations and found that
many of them are located within protein-coding genes, functional RNAs, and tandem repeats,
etc., suggesting that some of the interaction hotspots may be involved in regulatory processes
(Figure 2-7). Interestingly, we observed that extended hotspots were located within 5% – 20% of
total promoter regions (defined as the 500 base pairs upstream of protein-coding gene
transcription start sites) of the human genome. This led us to speculate that some of the
extended hotspots from our reanalysis of Hi-C data may actually reflect target promoters that are
34
Figure 2-7. Functional annotation of extended hotspots for sample. (a) GN/HindIII, (b) GM/NcoI, and (c)
K562/HindIII.
Each bar (as labeled) represents the percent of total length of each genomic feature that overlaps with
35
2.2.4 Candidate enhancer elements are enriched in activating histone marks
Prediction of candidate enhancer elements (CEEs)
To identify candidate enhancer elements (CEEs), we first considered extended hotspots
that interact with a protein-coding gene promoter region(s) (defined as the 500 base pairs (bp)
upstream of the annotated transcription start site). As shown in Table 2-2, 22%–62% of the
extended hotspots interact with a protein-coding gene promoter. The variation in promoter
interactions is likely a consequence of the number of promoters that are covered by extended
hotspots, which is influenced by both the total sequencing depth in a particular sequencing library
and the restriction enzymes and cell types used in the Hi-C experiments. We next examined the
enrichment of promoter-interacting extended hotspots in four activating histone modifications
known to be associated with enhancer elements (H3K27ac, H3K4me1, H3K4me2, and
H3K4me3), and a heterochromatic histone modification (H3K27me3) as a negative control
(Raney et al., 2011; Rosenbloom et al., 2011). As expected, we found that promoter-interacting
extended hotspots are enriched (permutation test, P values < 0.001) in all four activating histone modifications but not with H3K27me3 (Figure 2-9) when compared to the random background
control. These results suggest that many of the promoter-interacting extended hotspots are
36
Table 2-2. Number of CEEs present after each filtering step
Filtering step GM/HindIII GM/NcoI K562/HindIII
Promoter partners 22,818 90,200 93,109
Strong interactions (> 1 read) 1,757 11,001 9,955
Activating histone mark enrichment 928 5,617 5,814
37
To further improve our confidence that we are detecting bona fide enhancer–target gene
promoter interactions, we added an additional quality control step where we only retain
promoter-interacting extended hotspots if their promoter interaction is supported by more than one read (n
> 1) in the sequencing results (Figure 2-8). This filtering step dramatically reduced the number of
potential enhancer elements in all three samples. In fact, only 7.7% - 12.2% of the
promoter-interacting extended hotspots were retained as potential enhancer elements (Table 2-2). This
step likely reduced the number of false positives in our dataset, since we found it substantially
increased the enrichment in the four enhancer-associated activating histone modifications
(H3K27ac, H3K4me1, H3K4me2, and H3K4me3) in the remaining promoter-interacting extended
hotspots (Figure 2-9b). Taken together, these results indicate that increased read support for the
promoter-extended hotspot interactions is necessary for high confidence identification putative
38
Figure 2-8. Read support for CEE–promoter interactions in the three Hi-C samples. (a) GM/HindIII, (b)
39
The final filtering step in our pipeline to identify candidate enhancer elements (CEEs) was
to determine the enrichment of DNase I hypersensitive sites (DHSs) within the subset of high
confidence promoter-interacting extended hotspots (supported by > 1 sequencing read) using
previously published datasets (Gross and Garrard, 1988; Wu et al., 1979). From this analysis, we
found that the set of high confidence promoter-interacting extended hotspots from all three
original Hi-C experiments were enriched (P values < 0.001) in DHSs (Figure 2-9c). The tendency of high confidence promoter-interacting extended hotspots to co-localize with DHSs provides
further evidence of the reliability of our analysis strategy to identify bona fide enhancer element–
target promoter pairs in the human genome. In summary, the combination of these results has led
us to incorporate all three of these analysis steps in our pipeline for genome-wide prediction of
candidate enhancer elements (CEEs) and their interacting target promoters in the human