Quality Improvement Initiative to Reduce Serious
Safety Events and Improve Patient Safety Culture
abstract
BACKGROUND AND OBJECTIVE:Many thousands of patients die every year in the United States as a result of serious and largely preventable safety events or medical errors. Safety events are common in hospi-talized children. We conducted a quality improvement initiative to implement cultural and system changes with the goal of reducing serious safety events (SSEs) by 80% within 4 years at our large, urban pediatric hospital.
METHODS:A multidisciplinary SSE reduction team reviewed the safety literature, examined recent SSEs, interviewed internal leaders, and visited other leading organizations. Senior hospital leaders provided oversight, monitored progress, and helped to overcome barriers. Interventions focused on: (1) error prevention; (2) restructuring pa-tient safety governance; (3) a new root cause analysis process and a common cause database; (4) a highly visible lessons learned pro-gram; and (5) specific tactical interventions for high-risk areas. Our outcome measures were the rate of SSEs and the change in patient safety culture.
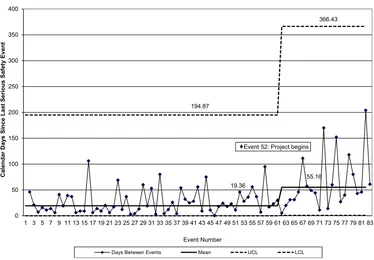
RESULTS: SSEs per 10 000 adjusted patient-days decreased from a mean of 0.9 at baseline to 0.3 (P,.0001). The days between SSEs increased from a mean of 19.4 at baseline to 55.2 (P,.0001). After a worsening of patient safety culture outcomes in thefirst year of intervention, significant improvements were observed between 2007 and 2009.
CONCLUSIONS:Our multifaceted approach was associated with a sig-nificant and sustained reduction of SSEs and improvements in patient safety culture. Multisite studies are needed to better understand con-textual factors and the significance of specific interventions.Pediatrics 2012;130:e423–e431
AUTHORS:Stephen E. Muething, MD,a,bAnthony Goudie,
PhD, MSPH,bPamela J. Schoettker, MS,bLane F. Donnelly,
MD,cMartha A. Goodfriend, RN, BSN, MEd,dTracey M.
Bracke, MS,bPatrick W. Brady, MD,a,bDerek S. Wheeler,
MD,eJames M. Anderson, Esq,fand Uma R. Kotagal, MBBS,
MScb
Divisions ofaGeneral and Community Pediatrics,dFamily Relations, andeCritical Care Medicine,bJames M. Anderson Center for Health Systems Excellence,cDepartment of Radiology, andfAdvisor to the President and CEO, Cincinnati Children’s Hospital Medical Center, Cincinnati, Ohio
KEY WORDS
patient safety, quality improvement, safety culture
ABBREVIATIONS
AHRQ—Agency for Healthcare Research and Quality CCHMC—Cincinnati Children’s Hospital Medical Center HSPSC—Hospital Survey on Patient Safety Culture SSE—serious safety event
All of the listed authors are responsible for the reported research. Dr Muething, Ms Goodfriend, Mr Anderson, and Dr Kotagal contributed to the conception and design of the project; Dr Muething, Dr Goudie, Ms Goodfriend, and Ms Bracke contributed to the acquisition of the data; Dr Muething, Dr Goudie, Ms Schoettker, and Ms Bracke contributed to the analysis and interpretation of the data; Dr Muething, Dr Goudie, and Ms Schoettker drafted the manuscript; and Dr Muething, Dr Goudie, Ms Schoettker, Dr Donnelly, Ms Goodfriend, Ms Bracke, Dr Brady, Dr Wheeler, Mr Anderson, and Dr Kotagal contributed to the critical revision of the manuscript for important intellectual content. All authors approved the manuscript as submitted.
www.pediatrics.org/cgi/doi/10.1542/peds.2011-3566
doi:10.1542/peds.2011-3566
Accepted for publication Mar 14, 2012
The results of this initiative were presented at the 15th International Scientific Symposium on Improving the Quality and Value of Health Care; December 7, 2009; Orlando, FL.
Dr Goudie’s current affiliation is Center for Applied Research and Evaluation, Department of Pediatrics, University of Arkansas for Medical Sciences and Arkansas Children’s Hospital, Little Rock, AK. Dr Donnelly’s current affiliation is Nemours Children’s Hospital, Orlando, FL.
Address correspondence to Stephen E. Muething, MD, James M. Anderson Center for Health Systems Excellence, Cincinnati Children’s Hospital Medical Center, 3333 Burnet Ave, Cincinnati, OH 45229. E-mail: stephen.muething@cchmc.org
PEDIATRICS (ISSN Numbers: Print, 0031-4005; Online, 1098-4275).
Copyright © 2012 by the American Academy of Pediatrics
A decade ago, 2 groundbreaking reports from the Institute of Medicine revealed that defective systems, rather than cal-loused or careless providers, were the cause of patient safety errors.1,2Since then, many hospitals have implemented or revised systems to improve patient safety.3–5 In addition, many specialty societies and nongovernmental organi-zations have focused on improving pa-tient safety.3,6–12 Although there have been some impressive improvements,4 patients continue to suffer from serious and preventable safety events.3,13 Re-cent multiRe-center data illustrate that patient harm remains common, and little, if at all, changed over a period from 2002 to 2007.14 Safety events in hospitalized children are common, and they are associated with increased length of stay, in-hospital mortality, and total charges.15–19 Up to 60% of such events may be preventable.17
Cincinnati Children’s Hospital Medical Center (CCHMC) has maintained a sig-nificant focus on improving patient safety for many years.20Three strategic plans since 2001 confirmed quality as our core business strategy and com-mitted us to transforming health care delivery and established organiza-tional readiness via leadership focus, transparency, data infrastructure to support improvement, and continu-ously increasing improvement capabil-ity. Specific improvement initiatives led to measurable reductions in adverse events.22–23However, during this same time, the number of serious safety events (SSEs) at CCHMC, defined as de-viation from generally accepted perfor-mance standards resulting in severe or permanent harm,24 remained stable. Therefore, in 2006, leadership commit-ted to an improvement effort focused on cultural and system changes, with the aim of reducing SSEs to 0.2 per 10 000 adjusted patient-days by June 30, 2010. We report here on the details and re-sults of that initiative.
METHODS
Setting
CCHMC is a large, urban pediatric ac-ademic medical center. In fiscal year 2010, CCHMC had .32 000 inpatient admissions and 125 000 emergency department (ED) visits and performed 31 000 surgical procedures. The hos-pital serves a diverse local, national, and international population;∼43% of patients have Medicaid insurance.
Improvement Team
In 2006, a SSE reduction team was formed, consisting of quality and safety leaders, risk management representa-tives, project managers, a senior decision analyst, and a consultant human factors expert. The faculty leader devoted 50% of his time. The other team members amounted to 4.75 full-time–equivalent employees. Senior hospital leaders pro-vided oversight, monitored progress to-ward goals, and helped to overcome barriers.
Diagnostic Phase
The team reviewed the safety literature (with particular attention focused on reliability in health care),4,25,26 exam-ined the 35 most-recent SSEs at CCHMC (applying methods from Healthcare Performance Improvement24to analyze causes of the events), and created a common cause database. The team then reviewed CCHMC results of the Hospital Survey on Patient Safety Culture (HSPSC) developed by the Agency for Healthcare Research and Quality (AHRQ).27,28 Fi-nally, the team hired a consultant from Healthcare Performance Improvement who conducted interviews with .100 CCHMC leaders, physicians, and clinical staff. Team members also participated with other health care organizations in AHRQ’s High Reliability Organization Learning Network,7 which included visits to organizations focused on re-ducing SSEs.29,30 Evidence from the available literature and expert opinion
were then used to develop a key driver diagram (Fig 1).
Interventions
Error Prevention
A set of expected safety behaviors for all clinical employees were se-lected by a multidisciplinary panel of local clinicians on the basis of evidence obtained from a literature review and consultant expertise (Table 1). An error prevention training pro-gram was designed for all direct patient caregivers, staff regularly assigned to a microsystem31or clin-ical unit, and leaders with the op-portunity to affect patient safety. Training objectives included recog-nizing the significance of safety and factors contributing to harm for patients and families, reviewing CCHMC patient safety history, identi-fying safety behaviors expected of all providers, practicing error prevention techniques, and discussing CCHMC accountability plans. To encourage teamwork, clinical microsystems trained together in interdisciplinary groups that included physicians. Didactic training involved dynamic lectures, videos, and interactive small-group discussions. Classes were taught by trained staff mem-bers. Continuing education credits were available to attendees. To date, .8100 employees have re-ceived training.or department. They conducted be-havioral observations and coached staff on performance of safety behav-iors. Each safety coach completed at least 4 observations per month that included specific and immediate positive and negative feedback. Ob-servation details were submitted online, creating a database used to plan additional interventions. Safety coaches on some units regularly led rounds to encourage open dis-cussion of patient safety successes
and failures. Safety coach leaders from each microsystem met monthly to sharefindings, provide support, and honor a coach for outstanding contributions.
Simulation training was used to improve communication and allow teams to practice expected safety behaviors.32–34During simulations, clinicians learned tofind and elim-inate latent safety threats, develop communication and teamwork skills, make adjustments to training and practice, and respond to emergen-cies. Significant capital investment was dedicated to upgrade the simu-lation center. The initial focus was on high-risk areas and procedures, such as perioperative practices, extracorporeal membrane oxygen-ation, bone marrow transplanta-tion, and the ED. Additional in situ or on-site simulations occurred reg-ularly across many microsystems. Safety training sessions were con-ducted for .600 leaders. They were held accountable for patient safety through rewards and recog-nition programs, yearly reviews, and performance-based privileging. For example, a portion of compen-sation for senior executives at the director level and above was tied to goal achievement. Processes were developed across ICUs to solicit safety concerns from family members throughout the day and to “stop the line”35 until concerns were resolved. When a concern was identified, 2 staff mem-bers met with the family and devel-oped a plan to address the concern before continuing care. One unit implemented, and later spread, a successful pediatric early warning score to detect clinical deterioration and prevent cardio-pulmonary arrests.36Another team FIGURE 1Key driver diagram for reduction in SSEs. A key driver diagram describes the learning structure for a quality improvement project and includes the aim statement, key drivers, and change strategies to be tested or implemented during the project. The aim statement is developed by using SMART (specific, measurable, actionable, relevant, and time-bound) goals and states the primary objective of the project. The key drivers are the elements believed to be crucial to achieving the goal. OR, operating room.
TABLE 1 Expected Safety Behaviors for All Clinical Employees
•Asking and encouraging clarifying questions •Practicing and supporting consultations and coaching with frontline team members (eg, nurses, physicians, support staff)
•Committing to 200% accountability (responsibility for both personal and co-worker behaviors) •Communicating clearly
developed and tested processes across the entire delivery system for real-time situation awareness.7 The implementation of a medical emergency response team was as-sociated with a reduction in the risk of respiratory and cardiopul-monary arrest outside of critical care areas.37
Restructuring Patient Safety Governance
A patient safety oversight group, consisting of 5 members of the se-nior leadership team, the patient safety officer (a physician), and the director of patient safety, focused on accountability, balancing quickfixes and long-term solutions in re-sponse to safety events, allocating organizational resources and qual-ity improvement infrastructure to strategic priorities,20and transpar-ency to the organization and the public. They worked to remove bar-riers and maintain the emphasis on patient safety as the primary concern of the organization. They strategically used meetings with institutional leaders to keep pa-tient safety on the agenda and as a means to drive accountability and execution on safety action plans de-veloped from the cause analysis process (see following text). The pa-tient safety officer called the chief executive officer and the board chairman if an SSE was identified. SSE details and progress on pa-tient safety goals were the first agenda items at monthly meetings of senior leaders and board of trustee meetings.
Cause Analysis Program
A new root cause analysis process for SSEs was implemented based on a 3-meeting model developed by Healthcare Performance Improve-ment.24After an extensive investi-gation, meeting 1 was devoted toestablishing facts about the event; meeting 2 was used to determine root causes; and meeting 3 was used to make recommendations for changes and develop action plans. The focus was on root cause(s), systems thinking, effective inves-tigation techniques, crediblefi nd-ings, and actionable improvement plans.
A common cause database wasdeveloped to support analysis of inappropriate actions, system and individual failure modes, and error types and to examine trends and inform improvement opportunities.
For each identified SSE, a senior executive was immediately assigned to oversee an analysis and comple-tion of accomple-tion plans to prevent reoc-currence of similar events.Lessons Learned Program
Staff were given access to infor-mation, creating a highly visible, transparent feedback mechanism, emphasizing key concepts to pro-mote and advance a culture of safety. The CCHMC intranet site, available to all employees, pro-vided monthly updates on all pa-tient safety goals, a papa-tient safety tracker that displayed the num-ber of days since the last SSE, safety stories, and a weekly report from the safety officer designed to reinforce expected safety behav-iors, increase staff mindfulness and awareness, celebrate successful in-terventions, and share details of failures.Tactical Interventions for High-Risk Areas
Interventions to reduce periop-erative SSEs included a list of expected safety behaviors specific to operating room safety devel-oped by surgeons, embedding“time outs” and“debriefs” into standardsurgical practice, providing visual cues in the operating room, stan-dardized checklists, smoothing pa-tient flow into the ICU,38 parent review, real-time feedback, educa-tional videos, and executive rounds.
Outcome Measures
The primary outcome measure was the rate of SSEs per 10 000 adjusted patient-days from January 2003 through June 2011. The secondary outcome was patient safety culture over 5 years (2005–2009).
Data Collection
Serious or permanent harm was
de-fined by using a framework developed by Healthcare Performance Improve-ment24 (Table 2). Harm could result from errors of commission or omis-sion. A review panel consisting of the chief of staff, patient safety officer, and 2 attorneys from risk management reviewed all potential SSEs identified by an anonymous, web-based patient safety reporting system, supplemented by a trigger tool system,19 telephone call alerts, and direct communications to the safety officer. The panel met bi-weekly and used a standardized evalua-tion to determine performance deviaevalua-tion and assessment of harm. Emphasis was on consistency and precedent in
TABLE 2 SSE Level of Harm
•Severe temporary harm: detectable harm, lasting for a limited time only, resulting in no permanent injury, yet causing great discomfort, injury, distress, and/or additional procedure, surgery, or resuscitation
•Moderate permanent harm: detectable harm, not expecting change in clinical status, and is greater than minimal harm but less than severe harm (eg, permanent, significant organ dysfunction [loss of neurologic function]) •Severe permanent harm: detectable harm, not
expecting change in clinical status, and causing great discomfort, injury, and/or distress (eg, permanent loss of organ function [renal failure]) •Death: death attributed to deviation in care
determination of whether an SSE had occurred. Clinicians with subspecialty knowledge expertise were consulted in most cases.
Each year since 2005, all patient care providers at CCHMC have been asked to anonymously complete the web-based AHRQ HSPSC.27,28 The survey asks respondents to share their expe-riences and perceptions over the pre-vious 12 months regarding 7 unit-level and 3 hospital-level dimensions of safety culture and 4 outcome variables. De-mographic data were not collected to protect respondent anonymity.
Human Subject Protection
The institutional review board deter-mined that this was a local systems improvement project and did not re-quire their review and approval.
Analytical Methods
Statistical process control charts were used to examine the impact of inter-ventions on the number of SSEs.39,40The number of events per 10 000 adjusted patient-days (including inpatient ad-missions, ED visits, and short stays) was tracked on a U (unit) chart based on count data with a Poisson distribution. The days between SSEs were tracked on a T (time between) chart, used to track rare events and with the expectation that the number of days between events would grow after intervention.41 The upper and lower control limits on the charts establish the margins within which the measurement will be found ∼99% of the time. Wilcoxon rank-sum test analyses of the change in the rate of events were also conducted.
For survey data, as recommended by AHRQ,28 the percentage of positive re-sponses was calculated (strongly agree/ agree or always/most of the time) across items in each HSPSC dimension. Responses to negatively worded ques-tions were reversed before calculating the percentage of positive responses.
For patient safety grade, a positive re-sponse was denoted by a rere-sponse of excellent or very good. For the number of events reported, a positive response was assigned if a respondent sub-mitted.1 report in the previous year. Finally, the mean percentages for each dimension and overall respondents were calculated. Scores for each di-mension could range from 0% to 100%, with higher scores indicating a more positive response. The mean percent-age over each year of the survey was adjusted to account for individual dif-ferences in how long the respondent worked at CCHMC, in the current hos-pital area or unit, and in the current specialty or profession; the number of weeks per year usually worked; and whether the respondent had direct or indirect patient contact.
All data analyses were performed by using SAS version 9.2 (SAS Institute, Inc, Cary, NC). Adjusted mean per-centages and 95% confidence inter-vals were calculated by using the LSMEANS option in PROC GLM. Statis-tical differences across years were obtained by using pair-wise multiple comparison tests with Bonferroni corrections.
RESULTS
SSEs
After intervention implementation, the number of SSEs per 10 000 adjusted patient-days (Fig 2) significantly de-creased from a mean of 0.9 to 0.3 (P, .0001). Days between SSEs (Fig 3) in-creased from a mean of 19.4 to 55.2 (P , .0001). During this same time, patient volume increased; monthly av-erage adjusted patient-days were 13 686 during the baseline period and 17 521 during the study period. The re-duction in SSEs occurred gradually but then seemed to stabilize at 0.3 SSE per 10 000 adjusted patient-days. We believe this reflects a combined effect from sys-tem improvements and cultural change.
This combination of interventions, by nature, required time and relentless clarity of vision by the organization, with dedicated resources and focus on key clinical areas. As more employees were trained, we discussed methods to ob-serve and measure performance of expected safety behaviors. We decided to focus, instead, on using the percep-tions and qualitative feedback of safety coaches to reinforce behaviors and estimate the penetration of behaviors at the microsystem level. Senior leaders made transparent sharing of infor-mation regarding SSEs the expected norm, modeled the new culture through their actions, and directed attention to key clinical areas and processes by continuously focusing on results. The overall measure reflects performance across the organization, but the inter-ventions required changes in dozens of clinical microsystems. Individual clini-cal areas adopted changes at varying paces, so persistence over time was vital to achieving the overall organiza-tional goal. Specific tactical interventions were developed and implemented where they were needed, and results were monitored continuously at the micro-system level.31Together, these interven-tions helped to focus leaders, physicians, and staff attention on patient safety and potential risks each day.
Patient Safety Culture
FIGURE 2
Number of SSEs per 10 000 adjusted patient days. Patient-days were adjusted to include inpatient admissions, ED visits, and short stays. LCL, lower control limits; UCL, upper control limits.
FIGURE 3
DISCUSSION
After implementation of cultural and system changes to improve patient safety, we observed significant reductions in the number of SSEs and increases in the days between SSEs. Although we did not reach our goal of 0.2 events, both statistical process control and Wilcoxon rank-sum analyses confirm these improvements to be statistically significant. More im-portantly, they are unquestionably clin-ically significant, equating to 62 fewer SSEs over the last 5 years. During the initial phase of the interventions, results from the safety culture survey worsened. However, as the initiative progressed, there was improvement.
Our experience of significant reduction in SSEs is thefirst that we are aware of
in the published literature. Although we do not have data on which drivers or interventions most affected this change, our bundle of an error prevention system, restructured safety governance, a cause analysis structure, lessons learned pro-gram, and specific tactical interventions was strongly associated with fewer SSEs. We believe this set of interventions, designed to reach every employee, is likely to achieve similar patient safety advances in other health systems if adjusted to the local context.
A more positive safety culture has been associated with fewer adverse events in hospitals.42Many hospitals have mea-sured and reported their patient safety culture; however, there are few reports of multiple surveys to determine the change in patient safety culture over time. Our
leadership was acutely aware of the ini-tial decrease in some patient safety cul-ture outcomes in the second and third surveys. Such results have been repor-ted previously and may be due to the increased focus on patient safety and error prevention and the perception that change is not happening fast enough.43–46 In addition, change takes time. Our lead-ership was confident that our inter-ventions would eventually result in an improved safety culture.
Our overall response rates were calcu-lated by using total employees as the denominator, rather than number of clinicians. Nonetheless, the improvement in the overall patient safety grade from 2007 (1 year after the interventions be-gan) to 2009 was statistically significant. Although our study design did not allow us
TABLE 3 Trends in Average Percent Positive Rating for Outcome Measures and Safety Culture Dimensions by Year
Variable 2005 2006 2007 2008 2009
Respondents,n 1541 1672 2741 2661 3752
Total employees,n 8676 9391 10 297 11 262 11 995
Response rate, % 17.8 17.8 26.6 23.6 31.3
Profession, %
Physician 12.2 10.4 6.9 9.7 4.9
Nurse 31.5 44.7 43.8 42.4 46.0
Other 56.3 44.9 49.3 47.9 49.1
Total 100.0 100.0 100.0 100.0 100.0
Outcome measures, % (95% CI)
Frequency of events reporteda 55.2 (52.6–57.8) 55.2 (52.7–57.8) 52.7 (50.6–54.8) 54.7 (52.6–56.9) 61.5*†(59.5–63.5) Overall perceptions of safetyb 72.5 (70.5–74.5) 70.2 (68.2–72.1) 66.5‡(64.8–68.1) 67.9 (66.2–69.6) 70.4* (68.9–72.0) Patient safety gradec 82.6 (80.1–85.2) 79.9 (77.4–82.3) 76.6‡(74.5–78.7) 79.9 (77.8–82.0) 84.0* (82.1–85.9) No. of events reportedc 30.9 (26.6–35.2) 40.7 (36.5–44.9) 38.8 (35.2–42.3) 32.9 (29.3–36.5) 44.6*†(41.3–47.9) Safety culture dimension (unit level)
Supervisor/manager expectations and actions promoting safetyb
75.1 (73.3–76.9) 73.3 (71.5–75.1) 72.0x(70.6–73.5) 72.0 (70.5–73.5) 74.1 (72.8–75.5)
Organizational; learning, continuous improvementa 76.5 (74.7–78.3) 78.2 (76.4–80.0) 76.7 (75.3–78.2) 76.4 (74.9–77.9) 81.9*†(80.5–83.3) Teamwork within hospital unitsb 83.6 (81.9–85.2) 83.8 (82.2–85.4) 81.8 (80.3–83.1) 81.5 (80.1–82.8) 82.7 (81.5–84.0) Communication opennessa 66.1 (63.8–68.3) 62.6 (60.4–64.8) 60.9‡(59.1–62.7) 61.4 (59.6–63.3) 65.2* (63.5–66.9) Feedback and communication about errora 61.5 (59.1–63.9) 60.4 (58.1–62.8) 58.2 (56.3–60.2) 61.0 (59.0–63.0) 63.8* (62.0–62.6) Nonpunitive response to errora 43.1 (40.7–45.5) 44.2 (41.8–46.5) 43.1 (41.1–45.1) 41.6 (39.6–43.6) 43.0 (41.1–44.8) Staffingb 59.0 (57.1–61.0) 59.9 (58.0–61.8) 56.2x(54.6–57.8) 57.8 (56.2–59.4) 59.5* (58.1–61.0) Safety culture dimension (hospital level)
Hospital management support for patient safetya 69.3 (67.3–71.3) 69.3 (67.4–71.3) 66.1x(64.4–67.7) 70.2 (68.5–71.9) 72.6*‖(71.0–74.1) Teamwork across hospital unitsb 54.0 (51.7–56.3) 54.9 (52.7–57.1) 53.0 (51.1–54.9) 55.2 (53.3–57.1) 58.1*‖(56.4–59.8) Hospital handoffs and transitionsb 34.1 (31.9–36.4) 40.2 (38.0–42.4) 38.3x(36.4–40.2) 38.2 (36.3–40.1) 40.9†(39.2–42.7)
Response rates based on total medical center employees. Survey percentages are adjusted for years worked at CCHMC, years worked in current work area/unit, years worked in current specialty or profession, hours a week worked in hospital, and whether there was direct contact with patients. CI, confidence interval.
aComposite of 3 items. bComposite of 4 items. cOne item.
to attribute causation, our experience with this and other quality improvement initiatives leads us to believe that our interventions drove the culture change that was a prerequisite to safety out-comes improvement. In addition, our ex-perience seems to affirm that process improvement initiatives alone are not sufficient to drive necessary culture change.
The major theoretical model for our approach was based on 5 key concepts guiding high reliability organizations: sensitivity to operations, reluctance to simplify, preoccupation with failure, deference to expertise, and resilience.4,5 These organizations strive to create a culture and processes that drastically reduce system failures and effectively respond when failures do occur.7 Our systematic, whole-system approach to reducing SSEs included a transparent, consistent method for identifying safety events; a standardized taxonomy for classifying failures; and a strict method to determine root causes, drive de-velopment of specific interventions, and focus organizational attention.
Some limitations of our study are that the interventions occurred at a single site, we do not have data from a control hospital, and multiple interventions were made simultaneously, resulting in what, in describing the etiology of dis-ease, has been called a web of causa-tion.31,47 We believe the simultaneous, multifaceted approach was crucial in changing behavior and culture and that no single change was responsible for the results obtained. In addition, this work was conducted over several years at a large pediatric medical center with a long history of improving care20and a robust infrastructure for tracking outcomes and harm. How-ever, we believe these methods can be generalized to other health care organizations if adapted to address contextual factors.48,49Multisite studies and a detailed analysis of the percent penetration of the interventions will allow further improvement. For example, we are currently in a collaborative with all 8 children’s hospitals in Ohio to build improvement capability, reduce SSEs, and improve patient safety culture.
Improving patient safety is an ongoing challenge. We continue to focus on changing behavior and understand that this will require years of persistence. We believe additional factors and experi-ence from outside health care will be important to further improvement. We have begun a new, organization-wide fo-cus on situation awareness (ie, knowing what is going on around you and what is likely to happen next) to eliminate unrecognized clinical deterioration and delayed diagnosis as a cause of serious harm.7We are also increasing emphasis on human factors engineering; that is, using knowledge about human behavior in system design and redesign.7,50
CONCLUSIONS
Our multifaceted approach, focusing on culture and system changes, was associated with a significant and sus-tained reduction of SSEs. This approach may be applicable to other sites. Multi-site studies are warranted to better understand contextual factors and the significance of individual interventions.
REFERENCES
1. Institute of Medicine, Committee on Quality Health Care in America.Crossing the Quality Chasm—A New Health System for the 21st Century. Washington, DC: National Academy Press; 2001
2. Institute of Medicine, Committee on Quality of Health Care in America.To Err is Human: Building a Safer Health System. Washington, DC: National Academy Press; 2000 3. Leape LL. Scope of problem and history of
patient safety. Obstet Gynecol Clin North Am. 2008;35(1):1–10, vii
4. Luria JW, Muething SE, Schoettker PJ, Kotagal UR. Reliability science and patient safety.
Pediatr Clin North Am. 2006;53(6):1121–1133 5. Weick KE, Sutcliffe KM, Obstfeld D. Organizing for high reliability: processes of collective mindfulness.Res Organ Behav. 1999;21:81–123 6. American Board of Medical Specialties. ABMS performance improvement products. ABMS patient safety courses. Available at: www.abms.org/Products_and_Publications/ Performance_Improvement/PSIP.aspx. Accessed June 22, 2010
7. Hines S, Luna K, Lofthus J, Marquardt M, Stelmokas D. Becoming a High Reliability Organization: Operational Advice for Hos-pital Leaders. Prepared by the Lewin Group under Contract No. 290-04-0011. Rockville, MD: Agency for Healthcare Research and Quality; 2008
8. Institute for Healthcare Improvement. Closing the quality gap. Available at: www.ihi.org/ NR/rdonlyres/9FEE1B6D-9B26-481D-B29C-A5D99E6CCFF8/0/IntrotoIHIFinal.pdf. Accessed June 22, 2010
9. National Quality Forum. Serious reportable events in healthcare - 2011 update: a consen-sus report. Washington, DC; 2011. Available at: www.qualityforum.org/projects/hacs_and_ sres.aspx. Accessed April 24, 2012 10. National Quality Forum. Safety practices for
better health care. Washington, DC; 2003. Report number NQFCE-05-03. Available at: www.ahrq.gov/qual/nqfpract.pdf. Accessed April 24, 2012
11. American Hospital Association, Health Re-search and Educational Trust, Institute for
Safe Medication Practices. Pathways for medication safety. Developing tools for med-ication safety. Chicago, IL: Health Research and Educational Trust; 2002. Available at: www.medpathways.info/medpathways/tools/ content/phasetwo.pdf. Accessed November 30, 2011
12. The Joint Commission. 2011 National patient safety goals now available. Effective July 1, 2011. Available at: www.jointcommission.org/ standards_information/npsgs.aspx. Accessed December 9, 2011
13. Wachter RM. Patient safety at ten: unmis-takable progress, troubling gaps.Health Aff (Millwood). 2010;29(1):165–173
14. Landrigan CP, Parry GJ, Bones CB, Hackbarth AD, Goldmann DA, Sharek PJ. Temporal trends in rates of patient harm resulting from medical care.N Engl J Med. 2010;363 (22):2124–2134
16. Slonim AD, LaFleur BJ, Ahmed W, Joseph JG. Hospital-reported medical errors in chil-dren.Pediatrics. 2003;111(3):617–621 17. Woods D, Thomas EJ, Holl J, Altman S,
Brennan T. Adverse events and preventable adverse events in children.Pediatrics. 2005; 115(1):155–160
18. Matlow AG, Cronin CM, Flintoft V, et al. De-scription of the development and validation of the Canadian Paediatric Trigger Tool.
BMJ Qual Saf. 2011;20(5):416–423 19. Muething SE, Conway PH, Kloppenborg E,
et al. Identifying causes of adverse events detected by an automated trigger tool through in-depth analysis.Qual Saf Health Care. 2010;19(5):435–439
20. Britto MT, Anderson JM, Kent WM, et al. Cin-cinnati Children’s Hospital Medical Center: transforming care for children and families.Jt Comm J Qual Patient Saf. 2006;32(10):541–548 21. Jacobs B. Hardly child’s play: implementing a pediatric-specific, integrated CPOE sys-tem. Midwest pediatric hospital tackles all the hurdles—needs assessment, clinician buy-in, training and measuring results—as it strengthens its patient safety efforts with wireless CPOE.Health Manag Technol. 2004; 25(8):30–32
22. Bigham MT, Amato R, Bondurrant P, et al. Ventilator-associated pneumonia in the pe-diatric intensive care unit: characterizing the problem and implementing a sustainable solution.J Pediatr. 2009;154(4):582–587, e2 23. Miller MR, Griswold M, Harris JM II et al.
Decreasing PICU catheter-associated blood-stream infections: NACHRI’s quality trans-formation efforts.Pediatrics. 2010;125(2): 206–213
24. Healthcare Performance Improvement, LLC. HPI: innovative solutions in healthcare per-formance. Available at: http://hpiresults.com/. Accessed November 30, 2011
25. Berwick D, Nolan T. High reliability health care presentation. Available at: www. ihi.org/knowledge/Pages/Presentations/ HighReliabilityHealthCarePresentation.aspx. Accessed August 22, 2011
26. Nolan T, Resar R, Haraden C, Griffins FA.
Improving the Reliability of Health Care. Cambridge, MA: Institute for Healthcare Improvement; 2004
27. Agency for Healthcare Research and Qual-ity. Hospital survey and patient safety culture. Available at: www.ahrq.gov/qual/
patientsafetyculture/hospsurvindex.htm. Accessed February 16, 2012
28. Sorra JS, Nieva VF.Hospital Survey on Pa-tient Safety Culture. Rockville, MD: Agency for Healthcare Research and Quality; 2004. AHRQ Publication No. 04-0041
29. Yates GR, Bernd DL, Sayles SM, Stockmeier CA, Burke G, Merti GE. Building and sustaining a systemwide culture of safety. Jt Comm J Qual Patient Saf. 2005;31(12):684–689 30. Yates GR, Hochman RF, Sayles SM, Stockmeier
CA. Sentara Norfolk General Hospital: ac-celerating improvement by focusing on building a culture of safety.Jt Comm J Qual Saf. 2004;30(10):534–542
31. Godfrey MM, Melin CN, Muething SE, Batalden PB, Nelson EC. Clinical micro-systems, part 3. Transformation of two hos-pitals using microsystem, mesosystem, and macrosystem strategies. Jt Comm J Qual Patient Saf. 2008;34(10):591–603
32. Falcone RA Jr, Daugherty M, Schweer L, Patterson MD, Brown RL, Garcia VF. Multi-disciplinary pediatric trauma team train-ing ustrain-ing high-fidelity trauma simulation.
J Pediatr Surg. 2008;43(6):1065–1071 33. Patterson MD, Blike GT, Nadkarni VM. In situ
simulation: challenges and results. In Henriksen K, Battles JB, Keyes MA, Grady ML, eds.Advances in Patient Safety: New Directions and Alternative Approaches, Vol-ume 3: Performance and Tools. Rockville, MD: Agency for Healthcare Research and Quality; 2008. Available at: www.ahrq.gov/ downloads/pub/advances2/vol3/Advances-Patterson_48.pdf. Accessed August 22, 2011 34. Ruddy RM, Patterson MD. Medical simulation: a tool for recognition of and response to risk.
Pediatr Radiol. 2008;38(suppl 4):S700–S706 35. Ohno T.Toyota Production System—Beyond
Large Scale Production. Portland, OR: Pro-ductivity Press; 1988
36. Tucker KM, Brewer TL, Baker RB, Demeritt B, Vossmeyer MT. Prospective evaluation of a pediatric inpatient early warning scoring system.J Spec Pediatr Nurs. 2009;14(2):79–85 37. Brilli RJ, Gibson R, Luria JW, et al. Imple-mentation of a medical emergency team in a large pediatric teaching hospital prevents respiratory and cardiopulmonary arrests outside the intensive care unit.Pediatr Crit Care Med. 2007;8(3):236–246, quiz 247 38. Ryckman FC, Yelton PA, Anneken AM, Kiessling
PE, Schoettker PJ, Kotagal UR. Redesigning
intensive care unit flow using variability management to improve access and safety.
Jt Comm J Qual Patient Saf. 2009;35(11): 535–543
39. Amin SG. Control charts 101: a guide to health care applications. Qual Manag Health Care. 2001;9(3):1–27
40. Benneyan JC, Lloyd RC, Plsek PE. Statistical process control as a tool for research and healthcare improvement. Qual Saf Health Care. 2003;12(6):458–464
41. Provost L, Murray S.The Data Guide. Learning From Data to Improve Health Care. Austin, TX: Associates in Process Improvement, Corpo-rate Transformation Concepts; 2007 42. Mardon RE, Khanna K, Sorra J, Dyer N,
Famolaro T. Exploring relationships between hospital patient safety culture and adverse events.J Patient Saf. 2010;6(4):226–232 43. Hellings J, Schrooten W, Klazinga NS, Vleugels
A. Improving patient safety culture. Int J Health Care Qual Assur. 2010;23(5):489–506 44. Tiessen B. On the journey to a culture of patient safety.Healthc Q. 2008;11(4):58–63 45. Adams-Pizarro I, Walker ZA, Robinson J,
Kelly S, Toth M. Using the AHRQ hospital survey on patient safety culture as an in-tervention tool for regional clinical improve-ment collaboratives. In: Henriksen K, Battles JB, Keyes MA, Grady ML, eds. Advances in Patient Safety: New Directions and Alternative Approaches, Volume 2: Culture and Redesign. Rockville, MD: Agency for Healthcare Re-search and Quality; 2008
46. Jones KJ, Skinner A, Xu L, Sun J, Mueller K. The AHRQ hospital survey on patient safety culture: a tool to plan and evaluate patient safety programs. In: Henriksen K, Battles JB, Keyes MA, Grady ML, eds.Advances in Patient Safety: New Directions and Alternative Approaches, Volume 2: Culture and Re-design. Rockville, MD: Agency for Health-care Research and Quality; 2008
47. MacMahon B, Pugh TF.Epidemiology; Prin-ciples and Methods. Boston, MA: Little, Brown; 1970
48. Pawson R, Tilley N. Realistic Evaluation. London, UK: Sage Publications; 1997 49. Kaplan HC, Brady PW, Dritz MC, et al. The
in-fluence of context on quality improvement success in health care: a systematic review of the literature.Milbank Q. 2010;88(4):500–559 50. Norris B. Human factors and safe patient
care.J Nurs Manag. 2009;17(2):203–211
(Continued fromfirst page)
FINANCIAL DISCLOSURE:The authors have indicated they have nofinancial relationships relevant to this article to disclose.
DOI: 10.1542/peds.2011-3566 originally published online July 16, 2012;
2012;130;e423
Pediatrics
James M. Anderson and Uma R. Kotagal
Martha A. Goodfriend, Tracey M. Bracke, Patrick W. Brady, Derek S. Wheeler,
Stephen E. Muething, Anthony Goudie, Pamela J. Schoettker, Lane F. Donnelly,
Patient Safety Culture
Quality Improvement Initiative to Reduce Serious Safety Events and Improve
Services
Updated Information &
http://pediatrics.aappublications.org/content/130/2/e423
including high resolution figures, can be found at:
References
http://pediatrics.aappublications.org/content/130/2/e423#BIBL
This article cites 29 articles, 8 of which you can access for free at:
Subspecialty Collections
sub
http://www.aappublications.org/cgi/collection/quality_improvement_ Quality Improvement
e_management_sub
http://www.aappublications.org/cgi/collection/administration:practic Administration/Practice Management
following collection(s):
This article, along with others on similar topics, appears in the
Permissions & Licensing
http://www.aappublications.org/site/misc/Permissions.xhtml
in its entirety can be found online at:
Information about reproducing this article in parts (figures, tables) or
Reprints
http://www.aappublications.org/site/misc/reprints.xhtml
DOI: 10.1542/peds.2011-3566 originally published online July 16, 2012;
2012;130;e423
Pediatrics
James M. Anderson and Uma R. Kotagal
Martha A. Goodfriend, Tracey M. Bracke, Patrick W. Brady, Derek S. Wheeler,
Stephen E. Muething, Anthony Goudie, Pamela J. Schoettker, Lane F. Donnelly,
http://pediatrics.aappublications.org/content/130/2/e423
located on the World Wide Web at:
The online version of this article, along with updated information and services, is
by the American Academy of Pediatrics. All rights reserved. Print ISSN: 1073-0397.