Nat. Hazards Earth Syst. Sci., 10, 1209–1220, 2010 www.nat-hazards-earth-syst-sci.net/10/1209/2010/ doi:10.5194/nhess-10-1209-2010
© Author(s) 2010. CC Attribution 3.0 License.
Natural Hazards
and Earth
System Sciences
Shaking table tests on strengthening of masonry structures
against earthquake hazard
F. Ersubasi1and H. H. Korkmaz2
1Civil Engineer, Konya Municipality, Konya, Turkey
2Selcuk University, Engineering and Architecture Faculty, Department of Civil Engineering, Konya, Turkey Received: 23 March 2010 – Revised: 3 May 2010 – Accepted: 10 May 2010 – Published: 17 June 2010
Abstract. Turkey and neighborhood countries like Greece
and Iran are situated on an active earthquake region. Ma-sonry type structures are very common on these countries, especially on the rural areas. During the last earthquakes, several masonry type houses were collapsed, causing loss of life and property. Strengthening methods of masonry houses were discussed in this study. The paper summarizes the re-sults of a experimental programme carried out on models, scaled 1/10, of one-storey masonry buildings. First specimen tested was the reference specimen and used for comparison purposes. Other specimens contained several strengthening strategies. A total of 9 specimens were tested. The results al-low to assess the efficiency of the various strengthening tech-niques employed.
1 Introduction
Western Peloponnissos, Ionian Islands of Greece and lands of Turkey, are among the most seismically prone areas of Southern Europe (Karantoni and Bouckovalas, 1997). 90% of the land area of Turkey is situated on one of the most ac-tive seismic zones of the world and devastating earthquakes frequently occur. Bingol, Turkey, located in a region of high seismic risk, an earthquake of magnitude 6.4 occurred on 1 May 2003. In the disaster area, 308 buildings collapsed, 2566 buildings have severe and moderate and 2546 buildings have light damage. In this earthquake, 174 deaths and 520 casualties were reported by the Governor of the city (Ka-plan et al., 2003). On 27 March 2004 and earthquake that struck Erzurum with a magnitude of 5.1 killed 8 people in ru-ral areas. A moderate earthquake of 5.1 on the Richter scale was occurred on Friday, 2 July 2004, near Dogubayazit
town-Correspondence to: F. Ersubasi
(fatihesb@gmail.com)
ship and 18 people were killed and 25 people were injured, 1000 building affected from the earthquake (Bayraktar et al., 2007). Recently, a 6.0 magnitude earthquake has struck the eastern province of Elazig in Turkey on 8 March 2010. This is the most seismically hazardous zone according to the seis-mic classification criteria adopted for Turkey (G¨ulkan et al., 1993). The area is sparsely populated, with most dwellings having one or two stories constructed from masonry with-out timber reinforcement or adobe and brick (Sandikkaya et al., 2010). In Fig. 1, several damaged masonry houses were illustrated in Elazig Earthquake.
Structures located in the seismically active zones are far from possessing qualities that would ensure satisfactory seis-mic performance (Ozcebe et al., 2003). Developing countries commonly have poor and under educated population living in self-constructed masonry houses, which are at high risk if they are located on seismically active regions. The be-havior of the masonry buildings during the earthquakes is poorly understood and appropriate tools to analyse them are now urgently required. On the other hand, numerical mod-eling of the seismic behavior of masonry structures repre-sents a very complex problem due to the constitutive char-acteristics of the structural material and its highly physical and geometrical nonlinear behavior when subjected to strong ground motion (Bayraktar et al., 2007). The structural vul-nerability and damage-failure patterns of unreinforced ma-sonry (URM) were studied by many researchers (Korkmaz, 2010; Bruneau, 1994; Tornabvie, 1997; Benedetti et al., 1998; Abrams, 2001; Paquette and Bruneau, 2003; Doherty et al., 2002). Of the methods considered, injection grouting, insertation of reinforcing steel, prestressing, jacketing, use of FRP and various surface treatments were the most common (Albert et al., 2001). The difficulties in performing advanced testing of this type of structures are quite large due to the in-numerable variations of masonry, the large scatter of in situ material properties and the impossibility of reproducing it all in a specimen (Zucchini and Lourenco, 2004).
1210 F. Ersubasi and H. H. Korkmaz: Shaking table tests on strengthening of masonry structures
Fig. 1 Several failure of masonry houses observed after Elazig earthquake (2010)
This paper discusses the effectiveness of masonry strengthening techniques The scope includes construction of one reference and eight strengthened identical 1/10 scaled one storey masonry houses and dynamic testing of specimens on uniaxial shaking table. The performance of each strengthening technique was compared with reference specimen.
2. Material and Method
In the context of this study, evaluation of different strengthening techniques for masonry houses was aimed. The testing of masonry structures under lateral loads is a very difficult task. The reinforced concrete structures can be tested under lateral point loading, since the mass of the structure is concentrated on the storey levels (Ersubasi, 2008). On the other hand, point loading of masonry walls is very difficult due to local shear failure of the bed joints. Also mass of the structure is distributed through the wall height. Computer controlled shaking table test were very popular to simulate the destructive effects of recorded or generated earthquake records. But, the equipment for a full-scale computer controlled shaking table is too costly for many institutions (Turer et al., 2007). Several more economic testing techniques were developed to evaluate the earthquake performance of the masonry structures. Tilting table test setup was first used by Zegarra et al. (2000) and Turer et al. (2004). Roorke shock table (Figure 2) was another setup in the literature (Keightley, 1986). Indian researcher Jagadish K.S (2002) used a pendulum and a free vibration table o simulate the earthquake forces on the masonry houses. Altın et al. (2005) and Kamanli and Balik (2010) used a more simplistic shaking tablet o test the different strengthening strategies on the masonry houses.
Fig. 1. Several failure of masonry houses observed after Elazig earthquake (2010).
This paper discusses the effectiveness of masonry strengthening techniques The scope includes construction of one reference and eight strengthened identical 1/10 scaled one storey masonry houses and dynamic testing of specimens on uniaxial shaking table. The performance of each strength-ening technique was compared with reference specimen.
2 Material and method
In the context of this study, evaluation of different strength-ening techniques for masonry houses was aimed. The testing of masonry structures under lateral loads is a very difficult task. The reinforced concrete structures can be tested un-der lateral point loading, since the mass of the structure is concentrated on the storey levels (Ersubasi, 2008). On the other hand, point loading of masonry walls is very difficult due to local shear failure of the bed joints. Also mass of the structure is distributed through the wall height. Computer controlled shaking table test were very popular to simulate the destructive effects of recorded or generated earthquake records. But, the equipment for a full-scale computer con-trolled shaking table is too costly for many institutions (Turer et al., 2007). Several more economic testing techniques were developed to evaluate the earthquake performance of the ma-sonry structures. Tilting table test setup was first used by Zegarra et al. (2000) and Turer et al. (2004). Roorke shock table (Fig. 2) was another setup in the literature (Keightley, 1986). Indian researcher Jagadish (2002) used a pendulum and a free vibration table o simulate the earthquake forces on the masonry houses. Altin et al. (2005) and Kamanli and Balik (2010) used a more simplistic shaking table to test the different strengthening strategies on the masonry houses.
Due to budged constraints of the researchers, relatively more economic shaking table test equipment was developed by the authors. This setup was also used in previous study (Turer et al., 2004). The shaking table is custom made and generates sinusoidal motions at increasing frequency and
(a) (b)
(c)
(d)
Fig. 2 Different masonry testing setups
Due to budged constraints of the researchers, relatively more economic shaking table test equipment was developed by the authors. This setup was also used in previous study (Turer et al, 2004). The shaking table is custom made and generates sinusoidal motions at increasing frequency and accelerations. The setup consisted of a platform that can be move in only forward and backward directions. The movement of the platform was driven by an electric motor and frequency control mechanism. The illustration of the mechanical system is shown in Figure 3
Fig. 2. Different masonry testing setups. (a) Tilting test setup (Ze-garra, 2000). (b) Tilting test setup (Turer, 2004). (c) Roorke shock table (Keightley, 1986). (d) Pendulum and vibration table (source: Jagadish, 2002).
Fig. 3 Custom made shaking table test setup
The frequency of the rotation and also platform motion can be adjusted by an AC motor controller. The stroke length of the shaking platform can be modified mechanically as the long bar connection location on the rotational disk is moved close or away from the disk centroid when the platform in not in operation. The platform displacement-amplitude (X) can be adjusted by changing the radius of the rotating disc (r). Amplitude is a function of the rotational angle () of the motor disk which depends on angular velocity (w) times time (t). In order to obtain a sinusoidal wave, (L) which is the length of the arm linking the rotating disk and the slider-platform must be long enough. The relationship between the table displacement and other parameters explained above can be written as in Equation 1 using geometric relationships as;
2 2 2 ) sin( 1 1 )
cos( wt
L r L t w r x (1)
The first derivative of Equation 1 yields the velocity (v) function of the platform as shown in Equation 2.
w t w t w t w L r L r w t w r v
x sin( )cos( )
) sin( 1 ) sin( 2 2 2 2 (2)
The second derivative of the displacement function yields the acceleration (a) function of the platform as shown in Equation 3.
2 1 2 2 2 2 2 3 2 2 2 2 2 3 2 ) sin( 1 1 ) cos( 2 ) sin( 1 ) cos( ) sin( ) cos( t w L r t w L r t w L r t w t w L r t w w r a x (3)Fig. 3. Custom made shaking table test setup.
celerations. The setup consisted of a platform that can be move in only forward and backward directions. The move-ment of the platform was driven by an electric motor and frequency control mechanism. The illustration of the me-chanical system is shown in Fig. 3.
The frequency of the rotation and also platform motion can be adjusted by an AC motor controller. The stroke length of the shaking platform can be modified mechanically as the long bar connection location on the rotational disk is moved close or away from the disk centroid when the platform is
F. Ersubasi and H. H. Korkmaz: Shaking table tests on strengthening of masonry structures 1211 The shaking table acceleration versus angle graphs for different L/r ratios are prepared by Turer et al. (2004) and
given in Figure 4. The shaking table acceleration diverges from the sinusoidal wave form when L/r ratio is small indicating that the ratio should be kept large at all times. Sensitivity analysis on the maximum error between shaking table acceleration and a perfect sinusoidal wave is plotted in Figure 5. The maximum acceleration error of the shaking table decreases as the L/r ratio is increased. Log-log plot of the error versus L/r ratio shows a linear relationship which is given in Equation 4. The relationship can be further simplified as show in Equation 5. r L table shaking Error log 0083 . 1 0165 . 2 _ 10
% (4)
r L table shaking Error log 2 _ 10 % (5) r L table shaking
Error% _ 102log (6)
Fig. 4 Normalized shaking table acceleration comparison for different L/r ratios
L/r=3 L/r=3
L/r=100 L/r=100
L/r=10 L/r=10
Fig. 4. Normalized shaking table acceleration comparison for dif-ferent L/r ratios.
not in operation. The platform displacement-amplitude (x) can be adjusted by changing the radius of the rotating disc (r). Amplitude is a function of the rotational angle (θ) of the motor disk which depends on angular velocity (w) times time (t). In order to obtain a sinusoidal wave, (L) which is the length of the arm linking the rotating disk and the slider-platform must be long enough. The relationship between the table displacement and other parameters explained above can be written as in Equation 1 using geometric relationships as;
x=r·cos(wt )+L
1− s
1−r
2
L2sin(wt )
2
(1)
The first derivative of Eq. (1) yields the velocity (v) function of the platform as shown in Eq. (2).
·
x=v=rsin(wt ) w
+ r
2
L
q 1−r2
L2sin(wt )
2
sin(wt )cos(wt ) w (2)
The second derivative of the displacement function yields the acceleration (a) function of the platform as shown in Eq. (3).
··
x=a=r·w2
cos(wt )−
r L
3
sin(wt )2·cos(wt )2
1−r2
L2sin(wt )
2 3 2 − r L
· 2cos(wt )2−1
1−r2
L2sin(wt )
2 1 2 (3)
Shaking Table Acceleration Percent Error Graph
0.1 1 10 100
0 10 20 30 40 50 60 70 80 90 100 110 120 130 140 150 160 170 180 190 200
(L/r) ratio M a x im u m A c c e le ra ti o n P e rc e n t E rr o r (% ) wi th R e s p e c t to S in u s o id a l F u n c ti o n 0.1 1 10 100
1 10 100 1000
(L/r) ratio
Fig. 5 Shaking table maximum acceleration error change as a function of L/r ratio.
The shaking table used in this study has an L/r ratio equal to 80 which generates close-to-sinusoidal waves with maximum error of 1.25%. The amplitude of the accelerations generated by the shaking table setup is a function of rotary disk radius (r) and square of rotation frequency (w2
) as seen in Equation 3. The level of acceleration can only be increased by changing rotation speed or rotation frequency (w) since rotary disk radius (r) cannot be changed during testing. The natural vibration frequencies of the 1/10 scale test specimens are much higher than the testing frequency range of the shaking table; therefore, amplification errors due to resonance condition is not an issue. The levels of acceleration that cause failure of the test specimens are determined by using Equation 3. The accelerations for the failure level of loading should also be corrected for their equivalent accelerations if the tests were conducted in full scale. The correction factor for a 1/N scale model can be calculated considering the stiffness, mass, and acceleration changes in a 1/N scale test. The lateral stiffness term of a 1/N scale model would be N times smaller than the full scale stiffness regardless of the stiffness type (e.g., shear or bending dominant stiffness). The force equivalence in a 1/N scale reduced model would be compatible with the stiffness (K) times the displacement () and should be modified by (1/N)2. The dynamic equilibrium equation of (F=m*a) might be rearranged for acceleration (a=F/m) and would have ratios of (1/N2
)/(1/N3
) which would yield (N). Therefore, the equivalent accelerations causing failure of a 1/N scale model would be N times larger compared to the full scale model. Consequently, accelerations causing failure of a full scale model must be decreased by a factor of N (Turer et al., 2004).
In the context of the experimental part, test specimens were designed such that they were 10 times scaled down models. Only one room and one storey of a typical masonry house was considered. Turer et al. (2004) tested a typical one storey one room rural house with 12m2
base area. The scale of the study was very small comparing the 1/1 tests. Korkmaz (2007) used same model ratio and compared with the 1/1 test conducted in METU as a part of World Bank DM-2003 project. She found the same failure pattern in reference and strengthened specimens and concluded that the major failure characteristics of the specimens can be compared with each other.
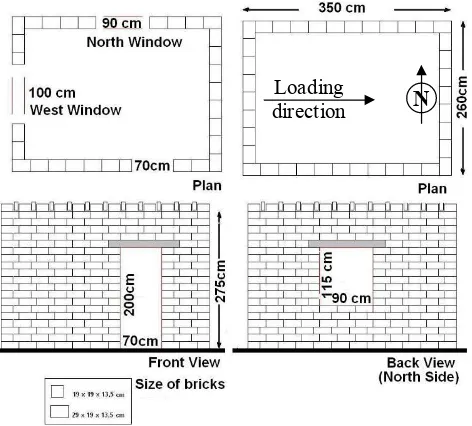
Current prototype has 3m x 4m in plan and 3m in height. Consequently, the test model had 30 cm height and it was constructed as 30cmx40cm in plan. Masonry units were also scaled down with 1/10 scale. Clayey soil was used as mortar and material properties were not modeled. Generally brick, stone or briquette masonry houses has RC slabs and a roof on it. The heavy roof of the masonry houses were not modeled, instead thick marble plate was used to represent the RC slab of the structure. Additional weight was included on the roof of the test specimen. In order to see crack propagation on the masonry walls, a thin clay plaster was applied and painted. White plaster is quite welcome to observe the cracking pattern of the walls. In Figure 6 dimensions and general configuration of the test specimens were depicted.
Fig. 5. Shaking table maximum acceleration error change as a func-tion of L/r ratio.
The shaking table acceleration versus angle graphs for dif-ferent L/r ratios are prepared by Turer et al. (2004) and given in Fig. 4. The shaking table acceleration diverges from the sinusoidal wave form when L/r ratio is small indicating that the ratio should be kept large at all times. Sensitivity analy-sis on the maximum error between shaking table acceleration and a perfect sinusoidal wave is plotted in Fig. 5. The maxi-mum acceleration error of the shaking table decreases as the L/r ratio is increased. Log-log plot of the error versus L/r ra-tio shows a linear relara-tionship which is given in Eq. (4). The relationship can be further simplified as show in Eq. (5). Error%shaking table=10
2.0165−1.0083·log
L r
(4)
Error%shaking table=10 2−logL
r
(5)
Error%shaking table=10
2−logLr
(6) The shaking table used in this study has an L/r ratio equal to 80 which generates close-to-sinusoidal waves with max-imum error of 1.25%. The amplitude of the accelerations generated by the shaking table setup is a function of ro-tary disk radius (r) and square of rotation frequency (w2) as seen in Eq. (3). The level of acceleration can only be in-creased by changing rotation speed or rotation frequency (w) since rotary disk radius (r) cannot be changed during test-ing. The natural vibration frequencies of the 1/10 scale test specimens are much higher than the testing frequency range of the shaking table; therefore, amplification errors due to resonance condition is not an issue. The levels of accelera-tion that cause failure of the test specimens are determined by using Eq. (3). The accelerations for the failure level of loading should also be corrected for their equivalent acceler-ations if the tests were conducted in full scale. The correction factor for a 1/N scale model can be calculated considering the stiffness, mass, and acceleration changes in a 1/N scale test. The lateral stiffness term of a 1/N scale model would
1212 F. Ersubasi and H. H. Korkmaz: Shaking table tests on strengthening of masonry structures
Fig. 6 Geometry of model house
During the testing a constant amplitude sinusoidal displacement was applied. Maximum velocity and acceleration were linear functions of w and w2. The frequency of the motion was started from low frequencies and increased with time. As the frequency of the motion was increased, also acceleration of the table was increased remembering the amplitude of the motion was constant during the testing. The failure instant and frequency of the failure was noted. The rate of increase is tried to be kept constant for all tests. The frequencies causing failure are noted for each test. The failure modes of the specimens were captured by three cameras located at the three corners of the laboratory. The acceleration versus time graphs of the platform was given in Figure 7 for different L/r ratios.
Frequency=14 Herz
-60 -40 -20 0 20 40 60 80
0 0,05 0,1 0,15 0,2
Tim e (s ec)
A
c
cel
er
a
tio
n
(
m
/sec
2)
L=40cm-r=0,5cm L=20cm-r=0,5cm L=10cm-r=0,5cm L=5cm-r=0,5cm L=2cm-r=0,5cm L=1cm-r=0,5cm
Fig. 7 Acceleration versus time graph of the platform for frequency 14 Hz
3. Experimental study
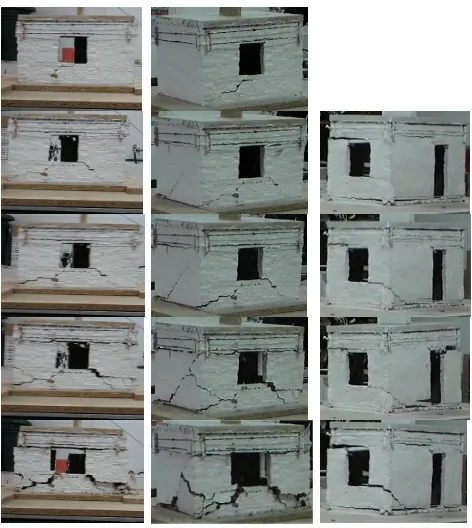
In this section summary of the experiments were given with photos of the specimens to represent the damage conditions. Since type of the experiment was dynamic, it was not possible to stop the testing and mark the cracks on the walls. Instead, three cameras were used to capture the failure sequence in video format and a commercial software converted video files to bitmap files. Different perspective views of the specimen at the same instant were given in a row. The following row corresponds to the next instant of the damage.
First specimen was the reference specimen tested to observe reference capacity and contained no strengthening. Other specimens were strengthened with different proposals. The performances of specimens were compared against each other using acceleration levels causing collapse or heavy damage to the structure. The comparisons
N
Loadingdirection
Fig. 6. Geometry of model house.
be N times smaller than the full scale stiffness regardless of the stiffness type (e.g., shear or bending dominant stiffness). The force equivalence in a 1/N scale reduced model would be compatible with the stiffness (K) times the displacement (δ) and should be modified by (1/N)2. The dynamic equilib-rium equation of (F=m∗a) might be rearranged for accel-eration (a=F /m) and would have ratios of (1/N2)/(1/N3)
which would yield (N). Therefore, the equivalent accelera-tions causing failure of a 1/N scale model would be N times larger compared to the full scale model. Consequently, ac-celerations causing failure of a full scale model must be de-creased by a factor of N (Turer et al., 2004).
In the context of the experimental part, test specimens were designed such that they were 10 times scaled down models. Only one room and one storey of a typical masonry house was considered. Turer et al. (2004) tested a typical one storey one room rural house with 12 m2base area. The scale of the study was very small comparing the 1/1 tests. Korkmaz (2007) used same model ratio and compared with the 1/1 test conducted in METU as a part of World Bank DM-2003 project. She found the same failure pattern in ref-erence and strengthened specimens and concluded that the major failure characteristics of the specimens can be com-pared with each other.
Current prototype has 3 m×4 m in plan and 3 m in height. Consequently, the test model had 30 cm height and it was constructed as 30 cm×40 cm in plan. Masonry units were also scaled down with 1/10 scale. Clayey soil was used as mortar and material properties were not modeled. Generally brick, stone or briquette masonry houses has RC slabs and a roof on it. The heavy roof of the masonry houses were not modeled, instead thick marble plate was used to represent the RC slab of the structure. Additional weight was included on
Fig. 6 Geometry of model house
During the testing a constant amplitude sinusoidal displacement was applied. Maximum velocity and acceleration were linear functions of w and w2. The frequency of the motion was started from low frequencies and increased with time. As the frequency of the motion was increased, also acceleration of the table was increased remembering the amplitude of the motion was constant during the testing. The failure instant and frequency of the failure was noted. The rate of increase is tried to be kept constant for all tests. The frequencies causing failure are noted for each test. The failure modes of the specimens were captured by three cameras located at the three corners of the laboratory. The acceleration versus time graphs of the platform was given in Figure 7 for different L/r ratios.
Frequency=14 Herz
-60 -40 -20 0 20 40 60 80
0 0,05 0,1 0,15 0,2
Tim e (s ec)
A
c
cel
er
a
tio
n
(
m
/sec
2)
L=40cm-r=0,5cm L=20cm-r=0,5cm L=10cm-r=0,5cm L=5cm-r=0,5cm L=2cm-r=0,5cm L=1cm-r=0,5cm
Fig. 7 Acceleration versus time graph of the platform for frequency 14 Hz
3. Experimental study
In this section summary of the experiments were given with photos of the specimens to represent the damage conditions. Since type of the experiment was dynamic, it was not possible to stop the testing and mark the cracks on the walls. Instead, three cameras were used to capture the failure sequence in video format and a commercial software converted video files to bitmap files. Different perspective views of the specimen at the same instant were given in a row. The following row corresponds to the next instant of the damage.
First specimen was the reference specimen tested to observe reference capacity and contained no strengthening. Other specimens were strengthened with different proposals. The performances of specimens were compared against each other using acceleration levels causing collapse or heavy damage to the structure. The comparisons
N
Loading direction
Fig. 7. Acceleration versus time graph of the platform for frequency 14 Hz.
the roof of the test specimen. In order to see crack propa-gation on the masonry walls, a thin clay plaster was applied and painted. White plaster is quite welcome to observe the cracking pattern of the walls. In Fig. 6 dimensions and gen-eral configuration of the test specimens were depicted.
During the testing a constant amplitude sinusoidal dis-placement was applied. Maximum velocity and acceleration were linear functions of w andw2. The frequency of the motion was started from low frequencies and increased with time. As the frequency of the motion was increased, also acceleration of the table was increased remembering the am-plitude of the motion was constant during the testing. The failure instant and frequency of the failure was noted. The rate of increase is tried to be kept constant for all tests. The frequencies causing failure are noted for each test. The fail-ure modes of the specimens were captfail-ured by three cameras located at the three corners of the laboratory. The accelera-tion versus time graphs of the platform was given in Fig. 7 for different L/r ratios.
3 Experimental study
In this section summary of the experiments were given with photos of the specimens to represent the damage condi-tions. Since type of the experiment was dynamic, it was not possible to stop the testing and mark the cracks on the walls. Instead, three cameras were used to capture the fail-ure sequence in video format and a commercial software converted video files to bitmap files. Different perspective views of the specimen at the same instant were given in a row. The following row corresponds to the next instant of the damage.
F. Ersubasi and H. H. Korkmaz: Shaking table tests on strengthening of masonry structures 1213
South side North side West and north side
Fig. 8 Failure sequence of specimen Ref
Fig. 9 Wire mesh strip application Fig. 8. Failure sequence of specimen Ref.
reference specimen as a ratio of aS/aR. Here, aS andaR are strengthened specimens and reference specimens failure accelerations, respectively.
3.1 Reference specimen (Ref)
The first specimen tested was reference specimen (Ref) with original construction details. The capacity oft this specimen was used for comparison purposes. The dynamic excitation to specimen Ref was applied in East-West direction.
The first cracks were initiated diagonally above the North window and also above the door of the model. New diag-onal cracks were formed perpendicular to the previous ones as the direction of the movements was reversed. This diago-nal cracks extended up to the bottom of the structure. As the frequency of the motion was increased, similar X type cracks were observed on the West window and previous cracks were widened. After that, a portion of the wall above the North window and door was separated and fell down. A horizontal shear crack was propagated above the door. After so much damage, stability of the structure was disturbed and a sudden and total collapse of the roof took place. Total collapse of the model was observed at the end of the test and classified as a brittle and sudden failure. The failure acceleration of this reference specimen was taken as 1. The failure sequence of the specimen was depicted in Fig. 8.
South side North side West and north side
Fig. 8 Failure sequence of specimen Ref
Fig. 9 Wire mesh strip application
Fig. 9. Wire mesh strip application.
3.2 Strengthened specimen CF1
The first method of strengthening was based on the use of CFRP type material. Application CFRP on the masonry walls is a well known technique and several researches are available in the literature. CFRP was applied on the walls with epoxy. The benefit of CFRP on the wall is; it delays the disintegration of walls units and can withstand axial tension forces on the wall. On the other hand CFRP material is very expensive. To cover all the wall surfaces with this material is not economical. Rather, several critical stress concentra-tion points can be covered. As observed from the reference specimen test, corners of the structure and openings are the most critical points. To model the CFRP material on this study, several material alternatives were tried. Plaster mesh wire made of plastic based material was quite welcome fort his purpose. Silicone based glue was used to represent the epoxy. Plaster wire mesh was cut in strips with 3 cm wide and corners of the specimen were covered with these strips (Fig. 9).
Vertical strips on the corners were connected with three horizontal strips to delay the disintegration of the corners. In the reference specimen test, wall portions above the openings were failed. Consequently, strips were also applied above the openings horizontally (Fig. 9). After strengthening pro-cedure, walls were plastered and painted.
Strengthening of masonry walls are not included in the current Turkish Earthquake Code (2007). The CFRP appli-cation on the masonry walls within the RC frames is given in the code only. In the regulations, there is no restrictions about the width of the CFRP strips. In the code only anchorage de-tails of the CFRP strips on the masonry infill is given. In this study the width of the CFRP strips were not considered as a parameter. Instead, the width of the CFRP strips were taken as 3 cm constant. The anchorage of the CFRP strips were also not modeled since the model ratio of the study is small. 3 cm strip width corresponds to 30 cm width in real dimensions. The larger dimensions will increase the cost of the application.
Testing of specimen CF1 was recorded with three cam-eras. Strips, simulating the CFRP, changed the damage and cracking modes of the specimen. First cracks were observed below the window openings (Fig. 10). These initial cracks could not propagate further and X type cracks could not form
1214 F. Ersubasi and H. H. Korkmaz: Shaking table tests on strengthening of masonry structures
Fig. 10 Failure sequence of specimen CF1
3.3 Specimen CF2
In specimen CF2, strips above the openings were removed and a horizontal strip was applied just above the ground level of the structure. The corners were also strengthened like CF1 (Figure 11). The failure sequence of the test was depicted in Figure 12. Initial cracks were observed above the openings like reference specimen Ref. X type cracks were formed but limited and couldn’t reached to the foundation level. Oppositely, these cracks were extended parallel to the ground. This specimen was collapsed when the acceleration level was 2 times the reference specimens failure acceleration.
Fig. 11 Specimen CF2
Fig. 10. Failure sequence of specimen CF1.
Fig. 10 Failure sequence of specimen CF1
3.3 Specimen CF2
In specimen CF2, strips above the openings were removed and a horizontal strip was applied just above the ground level of the structure. The corners were also strengthened like CF1 (Figure 11). The failure sequence of the test was depicted in Figure 12. Initial cracks were observed above the openings like reference specimen Ref. X type cracks were formed but limited and couldn’t reached to the foundation level. Oppositely, these cracks were extended parallel to the ground. This specimen was collapsed when the acceleration level was 2 times the reference specimens failure acceleration.
Fig. 11 Specimen CF2
Fig. 11. Specimen CF2.
due to polymer application. Instead, wall portions under the window openings were cracked like reversed V shape. More cracks were observed comparing the reference specimen and distributed over a larger area. The testing was stopped since the width of the cracks was widened and stability of the structure was lost. At the end of the test, specimen survived 2.5 times higher acceleration than the failure acceleration of the reference specimen.
3.3 Specimen CF2
In specimen CF2, strips above the openings were removed and a horizontal strip was applied just above the ground level of the structure. The corners were also strengthened like CF1 (Fig. 11). The failure sequence of the test was depicted in Fig. 12. Initial cracks were observed above the openings like reference specimen Ref. X type cracks were formed but limited and could not reached to the foundation level. Op-positely, these cracks were extended parallel to the ground. This specimen was collapsed when the acceleration level was 2 times the reference specimens failure acceleration.
Fig.12 Failure of specimen CF2
3.4 Specimen CF3
After obtaining satisfactory results in specimens CF1 and CF2, in specimen CF3, only corner of the structure was covered with strengthening material. In this manner, more economic application was maintained (Figure 13). Initial cracks were formed in the corners of the openings and X type cracks were formed. Also horizontal shear crack parallel to the ground was formed. Comparing with the reference specimen, more cracks were formed and distributed on a larger wall area. The wall, which was loaded in the out of plane direction, was failed and the test was stopped. This specimen could withstand 1.5 times acceleration according to the reference specimen. In Figure 14, failure and damage mode of the specimen was given.
Fig. 13 Preperation of specimen CF3 Fig. 12. Failure of specimen CF2.
Fig.12 Failure of specimen CF2
3.4 Specimen CF3
After obtaining satisfactory results in specimens CF1 and CF2, in specimen CF3, only corner of the structure was covered with strengthening material. In this manner, more economic application was maintained (Figure 13). Initial cracks were formed in the corners of the openings and X type cracks were formed. Also horizontal shear crack parallel to the ground was formed. Comparing with the reference specimen, more cracks were formed and distributed on a larger wall area. The wall, which was loaded in the out of plane direction, was failed and the test was stopped. This specimen could withstand 1.5 times acceleration according to the reference specimen. In Figure 14, failure and damage mode of the specimen was given.
Fig. 13 Preperation of specimen CF3
Fig. 13. Preperation of specimen CF3.
3.4 Specimen CF3
After obtaining satisfactory results in specimens CF1 and CF2, in specimen CF3, only corner of the structure was cov-ered with strengthening material. In this manner, more eco-nomic application was maintained (Fig. 13). Initial cracks were formed in the corners of the openings and X type cracks were formed. Also horizontal shear crack parallel to the ground was formed. Comparing with the reference speci-men, more cracks were formed and distributed on a larger wall area. The wall, which was loaded in the out of plane di-rection, was failed and the test was stopped. This specimen could withstand 1.5 times acceleration according to the ref-erence specimen. In Fig. 14, failure and damage mode of the specimen was given.
3.5 Specimen SwSP
F. Ersubasi and H. H. Korkmaz: Shaking table tests on strengthening of masonry structures 1215
Fig. 14 Failure sequence of specimen CF3
3.5 Specimen SwSP
Altın et al. (2005), studied 1/1 scale ordinary masonry house on the shaking table (Figure 15). They applied a thin (5 mm in thickness) steel strip on the inner and outer surfaces of the walls. Inner and outer steel strips were connected through the wall section with several rivets. The width of the steel plates were 150 mm. At the end of the test, they obtained satisfactory results and stated that this method is effective for strengthening of masonry structures. The specimen SwSP was strengthened with this idea. In order to represent steel plates, very thin steel plates were found and cut to obtain strips. Strips were placed vertically on the walls. Four strips were placed on the long walls and three strips were placed on the short walls (Figure 16).
Fig. 14. Failure sequence of specimen CF3.
Fig. 15 Outer and inner steel strips (Altın, 2005, Altin, 2008)
Fig. 16 Steel plate application for model house
After attaching the steel plates, thin plaster was applied over the wall surfaces. The first crack formed above the door corner and couldn’t reached to the roof level diagonally due to steel strip (Figure 17). Rather, this crack extended horizontally and reached to the corner of the structure. Similar condition was valid for the cracks formed on the corner of the window. Damage was concentrated above and below the window openings and X type cracks couldn’t form. At the end of the test, roof was separated from the structure and experiment was stopped. The maximum acceleration applied to this specimen was 1.4 times higher than the failure acceleration of the reference specimen.
Fig. 15. Outer and inner steel strips (Altin, 2005, 2008).
walls. Inner and outer steel strips were connected through the wall section with several rivets. The width of the steel plates were 150 mm. At the end of the test, they obtained satisfactory results and stated that this method is effective for strengthening of masonry structures. The specimen SwSP was strengthened with this idea. In order to represent steel plates, very thin steel plates were found and cut to obtain strips. Strips were placed vertically on the walls. Four strips were placed on the long walls and three strips were placed on the short walls (Fig. 16).
After attaching the steel plates, thin plaster was applied over the wall surfaces. The first crack formed above the door corner and could not reached to the roof level diago-nally due to steel strip (Fig. 17). Rather, this crack extended horizontally and reached to the corner of the structure. Sim-ilar condition was valid for the cracks formed on the corner of the window. Damage was concentrated above and below the window openings and X type cracks could not form. At
Fig. 15 Outer and inner steel strips (Altın, 2005, Altin, 2008)
Fig. 16 Steel plate application for model house
After attaching the steel plates, thin plaster was applied over the wall surfaces. The first crack formed above the door corner and couldn’t reached to the roof level diagonally due to steel strip (Figure 17). Rather, this crack extended horizontally and reached to the corner of the structure. Similar condition was valid for the cracks formed on the corner of the window. Damage was concentrated above and below the window openings and X type cracks couldn’t form. At the end of the test, roof was separated from the structure and experiment was stopped. The maximum acceleration applied to this specimen was 1.4 times higher than the failure acceleration of the reference specimen.
Fig. 16. Steel plate application for model house.
Fig. 17 Failure sequence of specimen SwSP
3.6 Steel wire mesh application (SM)
The third method used was the mesh reinforcement and plaster application over the masonry walls. This method is commonly used by many contractors and specialist to improve the seismic behavior of masonry structures. In Figure 18 an application case in a school building was given. The mesh reinforcement was applied over the surface of the wall and several holes were drilled to fix the anchorages through the existing walls. Cement based plaster was applied over the mesh. Same method was also used for adobe structures after the Aksehir Earthquake on 2002 (Figure 19).
Fig. 17. Failure sequence of specimen SwSP.
the end of the test, roof was separated from the structure and experiment was stopped. The maximum acceleration applied to this specimen was 1.4 times higher than the failure accel-eration of the reference specimen.
3.6 Steel wire mesh application (SM)
The third method used was the mesh reinforcement and plas-ter application over the masonry walls. This method is com-monly used by many contractors and specialist to improve the seismic behavior of masonry structures. In Fig. 18 an application case in a school building was given. The mesh reinforcement was applied over the surface of the wall and several holes were drilled to fix the anchorages through the existing walls. Cement based plaster was applied over the mesh. Same method was also used for adobe structures after the Aksehir Earthquake in 2002 (Fig. 19).
1216 F. Ersubasi and H. H. Korkmaz: Shaking table tests on strengthening of masonry structures
Fig. 18 Welded wire mesh application on a masonry school building
Fig. 19 Welded wire mesh application on adobe structure
Similar method was used to test the effectiveness of the application. In order to represent the mesh reinforcement, custom made scaled mesh reinforcement made of wires was used. Application was applied only on the corners of the structures. Mesh reinforcement was applied and gypsum was used to represent the cement based plaster. Column like gypsum-wire mesh reinforcement was given in Figure 20.
Fig. 20 Wire mesh reinforcement application on the specimen
Specimen SM was tested execution starting from low frequencies and applied acceleration was increased up to the failure. First diagonal cracks were observed on the corners of the openings and X type cracks were formed.
Fig. 18. Welded wire mesh application on a masonry school build-ing.
Fig. 18 Welded wire mesh application on a masonry school building
Fig. 19 Welded wire mesh application on adobe structure
Similar method was used to test the effectiveness of the application. In order to represent the mesh reinforcement, custom made scaled mesh reinforcement made of wires was used. Application was applied only on the corners of the structures. Mesh reinforcement was applied and gypsum was used to represent the cement based plaster. Column like gypsum-wire mesh reinforcement was given in Figure 20.
Fig. 20 Wire mesh reinforcement application on the specimen
Specimen SM was tested execution starting from low frequencies and applied acceleration was increased up to the failure. First diagonal cracks were observed on the corners of the openings and X type cracks were formed.
Fig. 19. Welded wire mesh application on adobe structure.
Similar method was used to test the effectiveness of the application. In order to represent the mesh reinforcement, custom made scaled mesh reinforcement made of wires was used. Application was applied only on the corners of the structures. Mesh reinforcement was applied and gypsum was used to represent the cement based plaster. Column like gypsum-wire mesh reinforcement was given in Fig. 20.
Specimen SM was tested execution starting from low fre-quencies and applied acceleration was increased up to the failure. First diagonal cracks were observed on the cor-ners of the openings and X type cracks were formed. Due to strengthening application, corner disintegration did not formed. The cracks are rather horizontal at the bottom and at the top of the openings. Failure acceleration of this specimen was 1.7 times higher than the reference specimen. Failure condition of the specimens was illustrated in Fig. 21.
3.7 Post tensioned specimen P1
Post tensioning of masonry walls increased the lateral load carrying and shear and bending capacities providing ductil-ity. Several studies were exist in the literature about this idea. Vertical post tensioning increased the shear resistance of the walls and horizontal post tensioning also delays the corner
Fig. 18 Welded wire mesh application on a masonry school building
Fig. 19 Welded wire mesh application on adobe structure
Similar method was used to test the effectiveness of the application. In order to represent the mesh reinforcement, custom made scaled mesh reinforcement made of wires was used. Application was applied only on the corners of the structures. Mesh reinforcement was applied and gypsum was used to represent the cement based plaster. Column like gypsum-wire mesh reinforcement was given in Figure 20.
Fig. 20 Wire mesh reinforcement application on the specimen
Specimen SM was tested execution starting from low frequencies and applied acceleration was increased up to the failure. First diagonal cracks were observed on the corners of the openings and X type cracks were formed. Due to strengthening application, corner disintegration didn’t formed. The cracks are rather horizontal at the Fig. 20. Wire mesh reinforcement application on the specimen.
bottom and at the top of the openings. Failure acceleration of this specimen was 1.7 times higher than the reference specimen. Failure condition of the specimens was illustrated in Figure 21.
Fig. 21 Damage conditions of specimen SM
3.7 Post tensioned specimen P1
Post tensioning of masonry walls increased the lateral load carrying and shear and bending capacities providing ductility. Several studies were exist in the literature about this idea. Vertical post tensioning increased the shear resistance of the walls and horizontal post tensioning also delays the corner separations. For this purpose, horizontal post tensioning was applied on the specimen P1. Benedetti at all. (1998) tested 2 storey model houses on the shaking table setup (Figure 22).
Fig. 21. Damage conditions of specimen SM.
separations. For this purpose, horizontal post tensioning was applied on the specimen P1. Benedetti at al. (1998) tested 2 storey model houses on the shaking table setup (Fig. 22).
F. Ersubasi and H. H. Korkmaz: Shaking table tests on strengthening of masonry structures 1217
Fig. 22 Post tensioning application on masonry specimens by Benedetti et al., . (1998)
In order to apply horizontal post tensioning and to distribute the stress over the wall, wooden logs were used on the corners of the structure. The cost of the wooden logs in real application is not expensive. Steel rods were used to apply tension forces on the structure. The structure was wrapped at the roof and foundation levels. At this point door of the structure created problem from architectural point of view. The failure condition of the specimen was given in Figure 23. Diagonal cracks replaced with horizontal shear cracks. Comparing with the reference specimen, more and distributed cracks can be pronounced. This specimen exposed 1.8 times higher acceleration than reference specimen. The behavior of the specimen was more ductile than the reference specimen. Horizontal ties are very efficient in preventing collapse due to the separation of walls. Such devices were accomplished by steel ties, steel beams and RC bands. It was found that the best effects are achieved by an appropriate distribution on the walls of the retaining forces due to horizontal ties (Benedetti et al., 1998).
Fig. 23 Failure of specimen P1
Fig. 22. Post tensioning application on masonry specimens by Benedetti et al. (1998).
Fig. 22 Post tensioning application on masonry specimens by Benedetti et al., . (1998) In order to apply horizontal post tensioning and to distribute the stress over the wall, wooden logs were used on the corners of the structure. The cost of the wooden logs in real application is not expensive. Steel rods were used to apply tension forces on the structure. The structure was wrapped at the roof and foundation levels. At this point door of the structure created problem from architectural point of view. The failure condition of the specimen was given in Figure 23. Diagonal cracks replaced with horizontal shear cracks. Comparing with the reference specimen, more and distributed cracks can be pronounced. This specimen exposed 1.8 times higher acceleration than reference specimen. The behavior of the specimen was more ductile than the reference specimen. Horizontal ties are very efficient in preventing collapse due to the separation of walls. Such devices were accomplished by steel ties, steel beams and RC bands. It was found that the best effects are achieved by an appropriate distribution on the walls of the retaining forces due to horizontal ties (Benedetti et al., 1998).
Fig. 23 Failure of specimen P1
Fig. 23. Failure of specimen P1.
Specimen P2 was identical to P1. After obtaining satisfac-tory results in specimen P1, wooden logs were replaced with shorter wooden pieces (Fig. 24). The post tensioning was ap-plied at the same positions. Similarly horizontal cracks ob-served just above the openings. At the end of the test, rigid body motion of the roof limited the capacity of the specimen. The failure of the specimen was given in Fig. 25. The maxi-mum acceleration reached at this specimen was less than the acceleration of P1 and 1.7 times higher than the that of refer-ence specimen.
The post tensioning just above the foundation level was architecturally very difficult due to door entrance. In spec-imen P3, horizontal wrapping was applied only at the roof level. The structure was wrapped by steel rods and a box type behavior was obtained. The crack patters of this specimen were different than P1. Initially diagonal cracks were formed
Specimen P2 was identical to P1. After obtaining satisfactory results in specimen P1, wooden logs were replaced with shorter wooden pieces (Figure 24). The post tensioning was applied at the same positions. Similarly horizontal cracks observed just above the openings. At the end of the test, rigid body motion of the roof limited the capacity of the specimen. The failure of the specimen was given in Figure 25. The maximum acceleration reached at this specimen was less than the acceleration of P1 and 1.7 times higher than the that of reference specimen.
Fig. 24 Specimen P2 and horizontal post tensioning application
Fig. 25 Failure of Specimen P2
Fig. 24. Specimen P2 and horizontal post tensioning application.
Specimen P2 was identical to P1. After obtaining satisfactory results in specimen P1, wooden logs were replaced with shorter wooden pieces (Figure 24). The post tensioning was applied at the same positions. Similarly horizontal cracks observed just above the openings. At the end of the test, rigid body motion of the roof limited the capacity of the specimen. The failure of the specimen was given in Figure 25. The maximum acceleration reached at this specimen was less than the acceleration of P1 and 1.7 times higher than the that of reference specimen.
Fig. 24 Specimen P2 and horizontal post tensioning application
Fig. 25 Failure of Specimen P2
Fig. 25. Failure of specimen P2.
and reached to the ground level. But corner failure was de-layed due to horizontal rods and horizontal shear cracks were observed just below the window openings (Fig. 26). At the last stages of the failure, secondary horizontal cracks above the openings and corner failure near to the ground was ob-served. The specimen survived 1.5 times higher acceleration then reference specimen Ref.
4 Conclusions
Unreinforced masonry (URM) walls are used in a broad range of historic and modern buildings worldwide. Unfor-tunately unreinforced masonry construction is vulnerable to earthquake hazards. Earthquakes are considered to be the major cause of structural failure of masonry buildings in Eu-rope and Turkey. In less developed countries, especially in
1218 F. Ersubasi and H. H. Korkmaz: Shaking table tests on strengthening of masonry structures
The post tensioning just above the foundation level was architecturally very difficult due to door entrance. In specimen P3, horizontal wrapping was applied only at the roof level. The structure was wrapped by steel rods and a box type behavior was obtained. The crack patters of this specimen were different than P1. Initially diagonal cracks were formed and reached to the ground level. But corner failure was delayed due to horizontal rods and horizontal shear cracks were observed just below the window openings (Figure 26). At the last stages of the failure, secondary horizontal cracks above the openings and corner failure near to the ground was observed. The specimen survived 1.5 times higher acceleration then reference specimen Ref.
Fig. 26 Failure sequence of specimen P3
4. Conclusions
Unreinforced masonry (URM) walls are used in a broad range of historic and modern buildings worldwide. Unfortunately unreinforced masonry construction is vulnerable to earthquake hazards. Earthquakes are considered to be the major cause of structural failure of masonry buildings in Europe and Turkey. In less developed countries, especially in the suburbs and rural areas, houses are constructed predominantly from masonry materials. These masonry structures were constructed to resist gravitational forces with no consideration of the lateral seismic loads. Especially rural masonry structures can be classified as non-engineered
Fig. 26. Failure sequence of specimen P3.
the suburbs and rural areas, houses are constructed predom-inantly from masonry materials. These masonry structures were constructed to resist gravitational forces with no con-sideration of the lateral seismic loads. Especially rural ma-sonry structures can be classified as non-engineered since they were constructed without engineering skills, based on experience of the local construction workers while scientific knowledge has been misapplied or omitted.
In this study, seismic performance improvement methods of masonry structures were evaluated experimentally. The performance of 1/10 scale shaking table tests were compared against each other. Failure accelerations were given in ref-erence to the original un-strengthened specimen Ref. The comparison of applied final accelerations in terms of refer-ence specimens acceleration was presented in Fig. 27.
According to the limited results of this study, the main achievements provided by the interpretation of the experi-mental results are as follows:
Reference specimen displayed a similar failure patterns observed after earthquakes. Diagonal X type shear cracks were observed on the walls loaded in plane direction. Sepa-ration followed by cracks near the corners was the last stage before the collapse of the structure. The failure of the refer-ence specimen was sudden and the behavior can be classified as brittle.
CFRP type materials can be applied over the masonry walls. In specimen CF1, corners and wall portions above the opening were covered with a material simulating the CFRP.
since they were constructed without engineering skills, based on experience of the local construction workers while scientific knowledge has been misapplied or omitted.
In this study, seismic performance improvement methods of masonry structures were evaluated experimentally. The performance of 1/10 scale shaking table tests were compared against each other. Failure accelerations were given in reference to the original un-strengthened specimen Ref. The comparison of applied final accelerations in terms of reference specimens acceleration was presented in Figure 27.
1 2,5
2
1,5 1,4
1,7 1,8 1,7
1,5
0 0,5 1 1,5 2 2,5
M
a
x
im
u
m
a
c
c
e
le
ra
ti
o
n
/R
e
fe
re
n
c
e
a
c
c
e
le
ra
ti
o
n
RF CF1 CF2 CF3 SwSP SM P1 P2 P3
Specimen Name
Figure 27 Comparison of test results
According to the limited results of this study, the main achievements provided by the interpretation of the experimental results are as follows:
Reference specimen displayed a similar failure patterns observed after earthquakes. Diagonal X type shear cracks were observed on the walls loaded in plane direction. Separation followed by cracks near the corners was the last stage before the collapse of the structure. The failure of the reference specimen was sudden and the behavior can be classified as brittle.
CFRP type materials can be applied over the masonry walls. In specimen CF1, corners and wall portions above the opening were covered with a material simulating the CFRP. This application increased the failure acceleration approximately %150. CF1 survived 2.5 higher accelerations than the reference specimen Ref. The amount of strength improvement remained at about %100 for the test specimen with only vertical strips at he corners and horizontal cover below the openings. Relatively inferior strength enhancement was achieved by application of only vertical coverage at the corners (CF3) with a total failure acceleration improvement of 50%. The width of the CFRP strips were taken as constant. In future study, the width can be taken as a parameter of the study but not included in the current paper.
The fixation of thin steel plate strips over the masonry changed the behavior and load carrying capacity. X type diagonal cracks couldn’t formed and horizontal shear cracks just below the roof level was followed by a new horizontal cracks above the ground level. The performance improvement was %40 higher than the reference specimen.
The use of welded steel mesh reinforcement and plaster application was very popular in strengthening applications. In this specimen, strength improvement of up to 70% was obtained.
Post tensioning application on the masonry walls can change the shear and bending capacities. Signifcant increases of the lateral resistance, with respect to the original one, may be obtained by the application of horizontal posttensioning tendons. Specimen P3, which was horizontally wrapped just below the roof level was displayed rather more ductile behavior than reference specimen. The level of improvement achieved was %50
Fig. 27. Comparison of test results.
This application increased the failure acceleration approxi-mately 150%. CF1 survived 2.5 higher accelerations than the reference specimen Ref. The amount of strength improve-ment remained at about 100% for the test specimen with only vertical strips at he corners and horizontal cover below the openings. Relatively inferior strength enhancement was achieved by application of only vertical coverage at the cor-ners (CF3) with a total failure acceleration improvement of 50%. The width of the CFRP strips were taken as constant. In future study, the width can be taken as a parameter of the study but not included in the current paper.
The fixation of thin steel plate strips over the masonry changed the behavior and load carrying capacity. X type di-agonal cracks could not formed and horizontal shear cracks just below the roof level was followed by a new horizontal cracks above the ground level. The performance improve-ment was 40% higher than the reference specimen.
The use of welded steel mesh reinforcement and plaster application was very popular in strengthening applications. In this specimen, strength improvement of up to 70% was obtained.
F. Ersubasi and H. H. Korkmaz: Shaking table tests on strengthening of masonry structures 1219 and energy consumption characteristics of the masonry
spec-imens. More retarded failure was obvious. The performance improvement in specimen P1 was approximately 80%.
In all of the strengthened specimens, the brittle behavior associated with sudden roof collapse had delayed or pre-vented. Large and clear diagonal crack formation followed by brittle collapse were less pronounced and replaced by well-distributed cracks. The failure sequences was relatively more ductile with gradual damage formation.
The choice of the appropriate method depends on the availability of the material and workmanship. Application of post tensioning is rather difficult due to details of the con-struction. On the other hand, CFRP type materials are expen-sive and may be used for historic and important structures.
Strengthening of historical heritage buildings require spe-cial attention from architectural point of view. The applied technique must not disturb the appearance of the structure and better to give minimum disturbance. At this point CFRP application may be the best solution considering the effec-tiveness. Application of steel mesh and cement based plaster can be categorized as the worst solution considering the ap-plication area surface. Post tensioning apap-plication may also create undesired appearance.
Strengthening of adobe structure is a very difficult task. For the rehabilitation studies the economical cost of the ex-isting structure and the cost of the strengthening is important. The economical value of adobe structures are low and mate-rial quality and overall structural performance is poor. The new materials applied must behave monolithically with the adobe material. CFRP application cannot be considered for rural adobe structures. Post tensioning methods may delay the disintegration of wall units and can provide time to occu-pant to empty the dwelling before failure.
Another problem is the durability of the applied material. Steel plates can create corrosion with time. Galvanized steel plates can solve this problem for the steel plate anchored methods. Painting of the steel plates can extend the life of the plates as well.
5 Recommendations for future study
This study handled three dimensional 1/10 scaled masonry specimens. Same methods can be tested on single masonry walls loaded in plane direction.
Acknowledgements. This study was supported by the Selcuk
University Scientific Research Project Office (BAP). The authors also thanks to Ahmet Turer and Serra Zerrin Korkmaz for the experimental study.
Edited by: M. E. Contadakis
Reviewed by: two anonymous referees
References
Abrams, D. P.: Performance-based engineering concepts for unrein-forced masonry building structures, Prog. Struct. Eng. Mat., 3(1), 48–56, 2001.
Albert, M. L., Elwi, A. E., and Cheng, J. J. R.: Strengthening of un-reinforced masonry walls using FRPs, J. Compos. Constr., 5(2), 76–84, 2001.
Altin, S., Kuran, F., Anil, O., and Kara, M. E.: Rehabilitation of heavily earthquake damaged masonry building using steel straps, Struct. Eng. Mech., 3(6), 651–664, 2008.
Altin, S., Kuran, F., Kara, M. E., and Anil, O.: A method for reha-bilitation of masonry buildings, Seismic Performance Improve-ment of Masonry Houses Workshop YDGA, 1, 83–88, 2005. Bayraktar, A., Coskun, N., and Yalcin, A.: Damages of masonry
buildings during the July 2, 2004 Dogubayazit (Agri) earthquake in Turkey, Eng. Fail. Anal., 14, 147–157, 2007.
Benedetti, D., Carydis, P., and Pezzoli, P.: Shaking table tests on 24 simple masonry buildings, Earthq. Eng. Struct. D., 27, 67–90, 1998.
Bruneau, M.: State-of-the-art report on seismic performance of unreinforced masonry buildings, J. Struct. Eng.-ASCE, 120(1), 230–251, 1994.
Doherty, K., Griffith, M. C., Lam, N., and Wilson, J.: Displacement-based seismic analysis for out-of-plane bending of unreinforced masonry walls, Earthq. Eng. Struct. Dyn., 31, 833– 850, 2002.
Ersubasi, F.: Evaluation of different strengthening techniques for masonry structures and testing dynamic properties in a shaking table facility, M.Sc. thesis, Selcuk University Graduate School of Natural and Applied Sciences, Konya-Turkey 2008.
Gulkan, P., Kocyigit, A., Yucemen, M. S., Doyuran, V., and Basoz, N.: Turkish seismic zonation map prepared by the most recent earthquake data, Earthquake Engineering Research Center, Mid-dle East Technical University, Ankara Turkey, Report No. 93-01, 1993.
Jagadish, K. S.: Containment reinforcement for earthquake resistant masonry, Proceedings Of The National Workshop On Alternative Building Methods, 114–119, 2002.
Kamanli, M. and Balik, F. S.: The behaviour of roof gable walls under the effect of earthquake load, Nat. Hazards Earth Syst. Sci., 10, 251–263, doi:10.5194/nhess-10-251-2010, 2010
Kaplan, H., Yilmaz, S., Binici, H., Yazar, E., and Cetinkaya, N.: May 1, 2003 Turkey – Bing¨ol earthquake: damage in reinforced concrete structures, Eng. Fail. Anal., 11(3), 279–291, 2004. Karantoni, F. V. and Bouckovalas, G.: Description and analysis of
building damage due to Pyrgos, Greece earthquake, Soil Dyn. Earthq. Eng., 16, 141–150, 1997.
Keightley, W. O.: Performance of lightly reinforced masonry houses on the roorke shock table, Conference on Earthen and Low Strength Masonry Buildings in Seismic Areas, Middle East Technical University, Ankara, Turkey, 1986.
Korkmaz, H. H., Korkmaz, S. Z., and Donduren, M. S.: Earthquake hazard and damage on traditional rural structures in Turkey, Nat. Hazards Earth Syst. Sci., 10, 605–622, doi:10.5194/nhess-10-605-2010, 2010.
Korkmaz, S. Z.: Seismic improvement of rural houses, Ph.D. the-sis, Selcuk University Graduate School of Natural and Applied Sciences, Konya-Turkey, 2007.
1220 F. Ersubasi and H. H. Korkmaz: Shaking table tests on strengthening of masonry structures ¨
Ozcebe, G., Ersoy, U., Tankut, T., Erduran, E., Keskin, O., and Mer-tol, C.: Strengthening of brick-infilled RC frames with CFRP, Technical Report, Department of Civil Engineering, Middle East Technical University, Ankara Turkey, 2003.
Paquette, J. and Bruneau, M.: Pseudo-dynamic testing of unrein-forced masonry building with flexible diaphragm, J. Struct. Eng.-ASCE, 129(6), 708–716, 2003.
Sandikkaya, A., Yenier, E., and Akar, S.: Processed records of the 8 March 2010 Elazi˘g – Kovancilar, earthquake, Earthquake Engineering Research Center Middle East Technical University, Earthquake Report, 2010.
Tornabvie, M.: Seismic design of masonry structures, Prog. Struct. Eng. Mat., 1(1), 88–95, 1997.
Turer, A.: Seismic performance improvement of masonry houses using scrap tires. World Bank DM2003, SPIM-1451 Project, Fi-nal Report, Ankara, Turkey, 2004.
Turer, A., Korkmaz, S. Z., and Korkmaz, H. H.: Performance improvement studies of masonry houses using elastic post-tensioning straps, Earthq. Eng. Struct. D., 36(5), 683–705, 2007. Zegarra, L., Bartolome, A. S., Quiun, D., and Garcia, G. V.: Re-inforcement of existing adobe houses, in: Aridland Newsletters, Desert Architecture for a New Milenium 47, 2000.