168
On The Conversion Of Gas Oil In Fluid Catalytic
Cracking Risers: Application Of Residence Time
Distribution (Rtd) Concept
H.A. Affum, I.I. Mumuni, G.K. Appiah, S.Y. Adzaklo, M. A. Addo
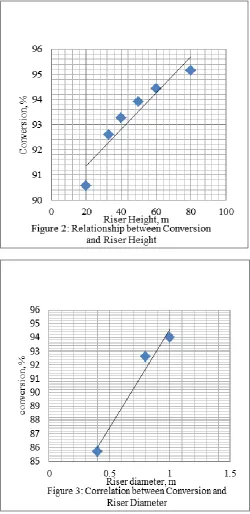
ABSTRACT: Risers are considered vital parts on fluidized catalytic cracking (FCC) conversion units. It is inside the riser that the heavy hydrocarbon molecules are cracked into petroleum fractions such as gasoline and liquefied petroleum gas (LPG). A simplified kinetic flow model in combination with the Tank-In-Series model was used to predict the conversion response of an FCC riser to changes in feed temperature, feed flow rate as well as riser diameter and height. The various Residence Time Distribution (RTD) functions and flow-model parameters are used in the characterization of the mixing regime of the riser and the degree of any non-ideal flow behaviour. Conversion was observed to increase with increasing riser height and diameter with values of 95.16% and 94.0% at a riser height of 80 m and diameter of 1.0 respectively. Conversion also increased with increasing feed temperature. A feed flow rate of 10 m3/s is converted at 95.95 % whiles a feed flow rate of 40 m3/s is converted at 89.72%, indicating an inverse relationship between conversion and feed flow rate. The simulation also revealed that the riser reactor is equal to approximately 1–2 perfectly stirred tanks in series as conversion started to decrease after an N, the number of tanks in the Tank-In-Series model, of 1.5.
Index Terms: Conversion, gasoline, residence time distribution, risers, Tank-In-Series model
————————————————————
1. INTRODUCTION
Fluid catalytic cracking (FCC) is one of the most important and complex processes in petroleum refining which is used to upgrade heavy petroleum gas oils into gasoline and other valuable products. The FCC process comprises mainly 2 parts: (1) a riser reactor where high molecular weight hydrocarbons come into contact with a catalyst and crack to lower molecular weight products with the simultaneous deposition of coke on the catalyst surface and (2) a regenerator where the coke on the catalyst is burnt with air and the catalyst is returned to the riser for the next run of cracking [1]. There have been several simulation studies focused on FCC due to its importance [2, 3, 4] with special attention on the riser reactor which is probably the most important equipment in an FCC plant. All cracking reactions and fuel formation occur in this reactor. Therefore, a mathematical model can be a valuable tool to design modifications or operational changes that give higher yields from the process. This explains why many of the models found in the literature describe the riser reactor [5, 6, 7, 8, 9]. However, most of these simulations assume idealized mixing conditions within the riser reactors.
This study, therefore, aims at developing a mathematical model which simulates non-ideal flow in a continuously stirred riser reactor (CSTR) and to demonstrate the relevance and application of the concept of residence time distribution (RTD). An appropriate mixing model in combination with the kinetics of the reactions occurring in the riser is developed to predict the reactant conversion at various operating conditions. To account for the non ideality in the reactor, the tank-in-series model is assumed to estimate the exit age distribution (E) curve.
2. MATERIALS AND METHODS
2.1 Riser Design and kinetic model
The complexities of gas oil mixtures which are typical FCC feedstocks make it extremely difficult to characterize and describe the inherent kinetics at a molecular level. To allow for easy studies, similar components are grouped into few cuts or lumps [9]. The study of the reactions involved in the catalytic process has therefore followed the lumping methodology. The number of lumps of the proposed models for catalytic cracking reactions has been consecutively increasing to obtain a more detailed prediction of product distribution [10]. Since the simple models, with just a few slumps are usually more suitable for specific simulations and for reactor design purposes, the 4- lump kinetic reaction scheme will be adopted in the present study. The four–lump mechanism suggested by Juarez et al in [11] has been selected. It is shown in Fig. 1.
r2, k2 light gases
r4, k4
Gas oil r1, k1 gasoline
r5, k5
r3, k3
Coke
Figure 1: A Schematic diagram of the four-lump scheme ————————————————
H.A. Affum is a senior research scientist at the Ghana Atomic Energy Commission and is currently pursuing a PhD program in Applied Nuclear Physics at the University of Ghana in collaboration with the International Centre for Theoretical Physics (ICTP), Trieste, Italy
According of this scheme, gasoil is converted into gasoline, light gases and coke. A part of the gasoline is also converted to light gases and coke. It is assumed that cracking of gas oil is a second- order reaction whiles that of gasoline is a first-order reaction, and that the reactions take place only in the gas phase. Based on the riser flow characteristics and dynamics which involves turbulence and mixing, the riser is considered as a CSTR. The assumption is also made that the riser is a constant density system. For a constant density fluid flowing in a system of volume V at a flow rate Q, the mean residence time () of fluid is theoretically defined as = V/Q [12]. It is also assumed the catalyst and gas have a same temperature along the riser, instantaneous vaporization occurred in entrance of riser and that there is no radial and axial dispersion in the riser. The ideal steady-state mixed flow reactor is one in which the contents are well stirred and uniform throughout. Thus, the exit stream from this reactor has the same composition as the fluid within the reactor. For this type of reactor, mixing is complete, so that the temperature and the composition of the reaction mixture are uniform in all parts of the vessel and are the same as those in the exit stream [13]. According to Levenspiel, Equation (1) represents the performance equation for mixed reactors.
(1) Therefore, for the second order reaction for the cracking of gasoil in an ideal mixed flow reactor, the performance equation is given by:
(2) Where
k = rate constant in the rate equation = mean residence time
CA0 = inlet/initial concentration of A (gas oil) into reactor
CA = final or concentration of A at reactor outlet
However, real equipment always deviates from these ideals. Deviation from ideal flow patterns can be caused by channeling of fluid, by recycling of fluid, or by creation of stagnant regions in the vessel. This is because elements of fluid taking different routes through the reactor may take different lengths of time to pass through the vessel. The time an atom spends in a reactor is called the residence time. The distribution of these times for the stream of fluid leaving the vessel is called the exit age distribution E, or the Residence Time Distribution (RTD) of fluid [14]. Therefore, the E curve is the distribution needed to account for the non-ideal flow [13]. The RTD is determined experimentally by injecting an inert chemical molecule or atom called tracer, into the reactor at some time t = 0 and then measuring the tracer concentration C, in the effluent stream as a function of time. The tracer usually possesses physical properties similar to those of the reacting mixture, so that its behavior will reflect that of the material flowing through the
reactor. The tracer must not disturb the flow pattern of the system. The analysis of the output concentration with time, gives the desired information about the system and helps to determine the residence time distribution function E (t) [15, 16]. The RTD curve can be used as a diagnostic tool for ascertaining features of flow patterns in reactors. These include the possibilities of bypassing and/or regions of stagnant fluid (i.e., dead space). Since these maldistributions can cause unpredictable conversions in reactors, they are usually detrimental to reactor operation. According to Levenspiel in [13], the application of the RTD to the prediction of reactor behavior is based on the assumption that each fluid (assume constant density) behaves as a batch reactor and that the total reactor conversion is then the average of the fluid elements, that is:
(3) According to the tank in series model, the RTD is given by
(4) Where
= mean residence time = t = time
N = number of tanks
Therefore, combining equations (3) and (4) results in:
(5) Equation (5) is the performance equation for a non ideal mixed flow riser with A representing gas oil.
Thefollowing are the reactions occurring in the riser:
(6) Where
r1 = the rate of reaction of gas oil to form gasoline at rate
constant k1
r2 = the rate of reaction of gas oil to form light gases at rate
constant k2
r3 = the rate of reaction of gas oil to form coke at rate
constant k3
r4 = the rate of reaction of gasoline to form light gases at
170
r5 = the rate of reaction of gas oil to form coke at rate
constant k5
Cgo=concentration of gas oil
Cgl=concentration of gasoline
= decay of catalyst activity due to coke
If kgois the overall gas oil reaction rate constant, then:
(7) For the purposes of this study, only reaction rates 1, 2 and 3 were considered. The reaction rate constants were calculated by using Arrhenius type semi-empirical equation given by:
(8) Where
ki = rate constant for reaction i
kio = pre-exponential constant/factor for rate constant ki
E = activation energy R =Gas constant and T = temperature
Kinetic parameters for the FCC riser reaction and used for the simulation are provided in Table 1. Other useful riser parameters are given in the Table 2 below.
3. RESULTS AND DISCUSSION
3.1 Riser simulation
The riser flow is simulated using the plant data given in Table 1 reported by Ali et al. in [8]. The values of other parameters used in the simulation are listed in Table 2. Table 3 also presents parameters which were calculated with data from Tables 1 and 2 and also used for the simulation. Using Eq. (5), an Excel Spreadsheet was developed for the gasoline conversion. Riser flow was simulated for various riser operating conditions such as feed rate, riser diameter and height, feed temperature and number of tanks in the one parameter Tank-In-Series model.
Table 1: Kinetic Parameters for cracking kinetics in riser
Reaction k0 E (kJ/mol)
Gasoil to gasoline 1457.5 57.36 Gasoil to light
gases 127.0 52.75 Gasoil to coke 1.98 31.82 Catalyst
deactivation 8.38 x 10⁴ 117.72 (Source: [17])
Table 2: Industrial Riser operating parameters
Parameter Value
Riser diameter (m) 0.8 Riser height (m) 33 Gasoil molecular weight
(kg/kmol) 333
Feed vaporization
temperature (K) 698 Gas oil Feed rate (kg/s) 19.95 Gas oil density (kg/m3) 835 Gas constant (kJ/(kmol K) 8.314 (Source: [17])
Table 3: Calculated parameters
Rate constant for overall
cracking of gasoil 0.0969 Gas oil volumetric flow rate,
(m3/s) 0.024 Mean residence time (s) 691.24
Initial gas oil
concentration,(kmol/m3) 2.508 Riser volume (m3) 16.59
With a feed flow rate of 19.95 kg/s, riser diameter of 0.8 m, riser height of 33 m, the effect of feed temperature on conversion was simulated. It can be seen from Fig. 4 that gasoil conversion increased linearly with increasing feed temperature. This observation is supported by Dasila et al in [19]. Increased temperature means increased kinetic rate constant, thereby increasing rate of reaction and hence conversion because the cracking of gasoil to gasoline is endothermic. Increasing temperature can help bring gasoline conversions up as shown in Fig 4. However, the heat balance in whole FCC system and limits on operating temperature in the regenerator can limit the increase possible in operating temperature in the riser [18]. Though generally conversion is observed to decrease with increasing number of mixing tanks, there seem to be a
sharp increase in conversion from N=1 to N=1.5 after which the conversion declines.
Keeping constant the riser diameter of 0.8 m, height of 33 m and the feed temperature at 698 K, the effect of feed flow rate and number of mixing tanks (N) on conversion was investigated. It was observed that a negative correlation exits between flow rate (or the residence time) and conversion. Table 4 shows in general that a decrease in residence time will decrease conversion. This observation is corroborated by [18, 19, 20]. Generally, conversion was also found to decreases as the number of tanks increased in the model. It is interesting to note a deviation from the general trend as conversion increased sharply from N=1 to N=1.5 tanks and declines thereafter. The small value of N depicts that, the riser characteristics turns are those of a single CSTR or perhaps 2 CSTRs in series rather than a plug flow reactor [16]. As the value of N increases, plug flow is approached tanks have no mixing in the direction of flow and thus conversion is reduced 12.
Table 4: Effect of feed flow rate and number of tanks (N) on conversion
N
Feed flow rate = 10kg/s ( τ =1385.245s)
Feed flow rate = 19.95 kg/s (τ =691.24s)
Feed flow rate = 40 kg/s
(τ = 346.311s)
X
172
The RTD curves for a gas oil flow rate of 40 kg/s as shown in Fig 7, exhibit long tails, an indication of the presence of dead volumes or stagnant volume with little exchange in the riser at those conditions. A short residence time of 346.3 s may mean that the reactants do not spend adequate time in
the riser for conversion to take place which also explains why the conversion is lower.
4. CONCLUSION
The concept of residence time distribution curves has been used to simulate the flow in a riser reactor. Parametric studies were done on the effects of temperature, feed flow rate and FCC riser height and diameter (to vary residence time) on gasoil conversion. Results indicated that shortening the residence time and decreasing gas oil feed temperature may significantly reduce overall conversion.
5. ACKNOWLEDGEMENTS
The authors are grateful to the International Atomic Energy Agency (IAEA) and the Ghana Atomic Energy Commission for the technical support.
6. REFERENCES
[1]. Moharir, A.S., Sarae, S.K., Kinetic Modeling of Vacuum Gasoil Catalytic Cracking, Chem. Age of India, 35; 433-440, (1984).
[2]. Landeghem, F.V., Nevicato, D., Pitualt, I., Forissier, M., Turlier, P., Derouin, C. and Bernard, J.R. Fluid Catalytic Cracking: Modeling of an Industrial Riser. Applied Catalysis A: General, vol.
138, pp.381-405, (1996)
[3]. Theologos, K.N., and Markatos, N.C Advanced modeling of fluid catalytic cracking riser-type reactors. AIChE J, 43,486-493, (1993).
[4]. Derouin, C., Nevicato, D., Forissier, M. ,Wild, G.,& Bernard, J.R. Hydrodynamics of riser units and the impact on FCC operation. Industrial and Engineering Chemistry Research, 36, 4504–4515,
(1997)
[5]. Arandes, J. M. and H. I. Lasa. Simulation and Multiplicity of steady states in fluidized FCCUs, Chem.Eng.Sci., 47, 2535-2540,(1992)
[6]. Arbel, A., Z. Huang, I.H. Rinard, R. Shinnar and A.V. Sapre. Dynamics and control of fluidized catalytic crackers. Modeling of the current generation FCC.s. Ind. Eng. Chem. Res., 34: 1228-1243, (1995)
[7]. Han, I. S. and Chung, C. B. Dynamic modeling and simulation of a fluidized catalytic cracking process Part I: Process modeling, Chem.Eng.Sci., 56, 1951-1971, (2001)
[8]. Ali, H., S. Rohani and J.P. Corriou. Modeling and control of a riser type Fluid Catalytic Cracking (FCC) unit. Chem. Eng. Res. Des., 75(A4): 401-412. (1997).
[9]. Coxon, P.G., and Bischoff, K.B., Lumping Strategy. Introduction To Techniques and Application of Cluster Analysis, Ind. Eng. Chem. Res., 26, 1239- 1248, (1987).
[10]. Bollas,G.M., Lappas, A.A., Iatridis, D.K. and Va-salos,I.A. Five-Lump Kinetic Model with Selective Catalyst Deactivation for the Prediction of the
Cracking Process, Catalysis Today, Vol. 127, No. 1 , pp. 31-43,(2007).
[11]. Juarez, J. A., Isunza, F. L., Rodriguez, E. A. and Mayotga, J. C. M.; A strategy for Kinetics Parameter Estimation in the Fluid Catalytic Cracking Process, Ind.Eng.Chem. Res., 36, 5170-5174, (1997)
[12]. International Atomic Energy Agency (IAEA). Radiotracer Residence Time Distribution method for industrial and environmental applications, IAEA-TCS-31(2008), Vienna.
[13]. Levenspiel, O., 1999. Chemical Reaction Engineering. 3rd Edn., John Wiley & Sons, Inc., 605 Third Avenue, New York.
[14]. Richardson, J.F. and D.G. Peacock, Coulson and Richardson’s Chemical Engineering, 3rd Edn., Pergamon, Great Britain, 3: 71-80, 102-103.
(1994).
[15]. Smith, J.M., H.C. Van Ness and M. M. Abbott, (1996). Introduction to Chemical Engineering Thermodynamics, 5th Edn., pp: 64-5, 189-91, 604-8, 831-37, McGraw-Hill, Singapore.
[16]. Fogler, H.S., Elements of Chemical Engineering Reaction. 2nd Edn., Prentice-Hall of India Private Ltd., New Delhi, pp: 708-723, 759-765, (1997).
[17]. Ahari, J.S, Farshi, A. and Forsat, K. A. Mathematical Modeling of the Riser Reactor in Industrial FCC Unit. Petroleum & Coal, 50 (2), 15-24, (2008).
[18]. Chang, S.L., Lottes, S.A., Zhou, C.Q. and Petrick. M A numerical study of short residence time FCCriser flows with a new flow/kinetics modeling, submitted to International Mechanical Engineering Congress and Exposition, Nov. 15-20, (1998), Anaheim, CA
[19]. Dasila, P.K., Choudhury, I., Saraf, D., Chopra, S., Dalai., A Parametric Sensitivity Studies in a Commercial FCC Unit. Advances in Chemical Engineering and Science, 2, 136-149, (2012).