Development of Surface
Electromyographic Spectral
Analysis Techniques for
Assessing Paraspinal Muscle
Function
A Dissertation Submitted by
Christopher W. Oliver
BSc., MB. BS„ FRCS., FRCS (Orth)
For the Degree of Doctor of Medicine
The University of London
ProQuest Number: 10016805
All rights reserved
INFORMATION TO ALL USERS
The quality of this reproduction is dependent upon the quality of the copy submitted. In the unlikely event that the author did not send a complete manuscript
and there are missing pages, these will be noted. Also, if material had to be removed, a note will indicate the deletion.
uest.
ProQuest 10016805
Published by ProQuest LLC(2016). Copyright of the Dissertation is held by the Author. All rights reserved.
This work is protected against unauthorized copying under Title 17, United States Code. Microform Edition © ProQuest LLC.
ProQuest LLC
789 East Eisenhower Parkway P.O. Box 1346
Abstract
In every industrialised society, back pain is the most common musculoskeletal ailment
and is the most costly disease process in the working age population. Back pain is a
difficult disease to classify and is even harder to objectively measure. In assessing back
pain it may be easier to assess function rather than pain. If the deficient anatomical site
can be tested, it will be more likely that reproducible information may emerge. It is
thought that deconditioned and weakened muscles are associated with back pain. To test
lumbar muscle dysfunction ideally the system should be isolated as much as possible, and
the test system should have minimal artefacts.
To objectively measure function of the lumbar paraspinal muscles a regulated
isometric stress testing was used with simultaneous recording of surface
electromyograms. Signal analysis of the filtered and digitised signal was then processed
by fast Fourier transformation. From the processed signal, power spectrum, median
frequency and halfwidth were plotted. Sampling and smoothing software programs were
used to produce three-dimensional images representing time on the X axis, frequency of
motor unit firing on the Y axis and signal amplitude on the Z axis. The signal amplitude
was a different colour on a two-dimensional spectrogram plot o f time versus frequency,
producing a colour 'contour map' o f the data. These graphical representations
demonstrated the dynamic changes of signal amplitude and frequency with time.
Reliability and repeatability studies were performed at two isometric loads. To
objectively measure the spectrogram data artificial intelligence neural networks were
implemented.
Normal subjects and back pain sufferers in this study were shown to demonstrate
statistically different power spectra and median frequencies. Spectral colour maps and
neural networks showed apparent differences between chronic back pain and normal
subjects. Artificial intelligence appeared to be good objective method of measuring
paraspinal electromyogram power spectra. The spectral colour maps appeared to reflect
altered motor unit firing rates and recruitment patterns
These new methods o f objectively measuring lumbar function could have clinical
Table of Contents
ABSTRACT... 2
TABLE OF CONTENTS... 3
LIST OF ILLUSTRATIONS... 9
ACKNOWLEDGEMENTS... 11
DECLARATION... 13
PUBLISHED ABSTRACTS... 14
SCIENTIFIC PRESENTATIONS... 15
CHAPTER ONE - INTRODUCTION... 17
A BRIEF RESUME OF THE HISTORY OF ELECTROMYOGRAPHY...17
De v e l o p m e n t o f p o w e r s p e c t r a a n a l y s is inth e lumbar s p i n e 2 0 A DISCUSSION OF MUSCULAR FATIGUE IN THE LUMBAR SPINE... 2 2 T he gen eral co n cep t of f a tig u e ... 22
M yoelectric param eters of f a tig u e ... 25
M athem atical m o d els and the fa st Fourier transform ation... 27
S h a p e of th e m yoelectric action potential w a v e fo r m ...27
M easurem ent of electrom yogram frequency shift...28
Correlation of electrom yogram to f o r c e ...29
Reliability, repeatabiiity and reproducibility of the pow er sp ectru m 3 0 Strength and the lumbar s p in e ...31
Effect of e x e r c is e and training on the lumbar s p in e ... 32
S creen in g the lumbar s p in e ...3 3
Background to artificial intelligence... 34
CHAPTER TWO - AIMS AND SCOPE OF ENQUIRY...39
CHAPTER THREE - MATERIALS AND METHODS...40
Ma t e r ia l s...40
Subjects... 40
M E T H O D S ...41
Lumbar extensor muscle test fram e...41
Subject positioning during testing... 42
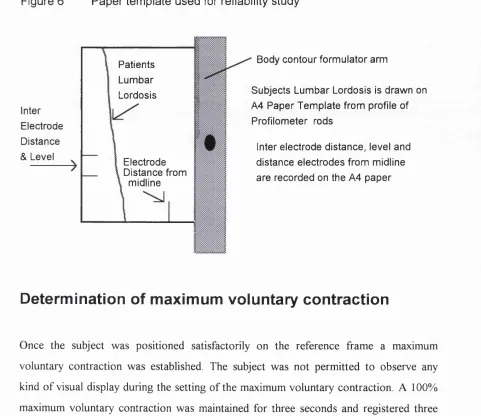
Determination of maximum voluntary contraction... 43
Isometric loading conditions... 43
Electrode positioning... 44
Electrode application... 45
Electrode type... 45
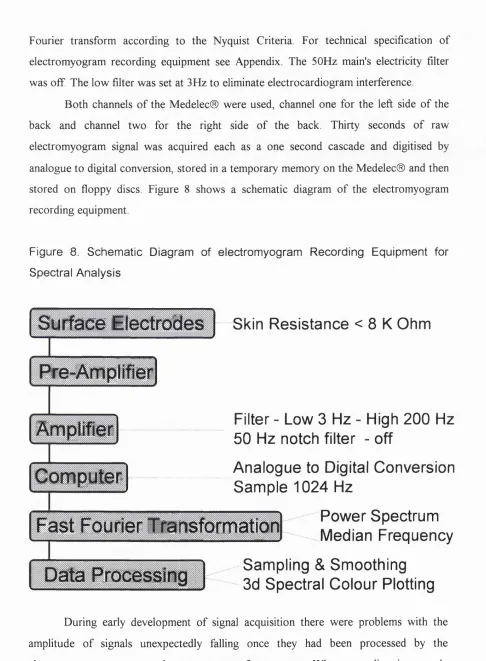
Acquisition of signal and filter settings... 45
Sources of signal artefact... 48
Mains interference... 48
Electrocardiogram interference... 48
Movement artefact... 48
Signal recording and processing... 49
Electromyogram to personal computer transfer program... 49
Spectral analysis program... 49
File management program... 50
Sampling program... 51
Halfwidth measurement... 52
Reliability and repeatability method... 52
Statistical analysis... 52
Artificial intelligence data collection... 53
Data collection... 53
The joint time-frequency transform...53
Data reduction... 54
Training and testing a neural netw ork... 56
Training and testing the neural network...58
CHAPTER FOUR - RESULTS... 61
An t h r o po m e t r ic r e s u l t s... 61
A g e and s e x ... 61
B ody w eight and lean body m a s s ... 62
Maximum voluntary con traction ... 62
E x ercise h isto r y ... 63
Fu n ctio nala s s e s s m e n t... 6 3 Low back o u tco m e s c o r e ...63
Ps y c h o l o g ic a l r e s u l t s... 6 4 Modified so m a tic perception questionnaire and Z u n g ...6 4 Job sa tisfa c tio n ...64
Reliability r e s u l t s...6 5 Breath holding r e s u l t s...6 6 Po w e r s p e c t r u m r e s u l t s... 6 7 Rela tio n sh ip o f p o w e r s p e c t r u m to l o a d in g... 6 8 Ag e a n d p o w e r s p e c t r a r e s u l t s... 7 0 Spe c t r a l c o l o u r m a ppin g r e s u l t s... 7 0 M easuring spectral colour m ap s h a p e ... 71
Neural network r e s u lts ...75
Subject anthropometries for neural network...75
Network sensitivity and specificity...75
Neural network convergence...79
Network size... 79
Generalising abilities of the trained neural network... 80
CHAPTER FIVE - DISCUSSION...82
P sych om etric s c o r in g ...82
Electrom yographic record in g... 8 6
Specificity and reliability...86
Normal back m u scle p erform an ce... 88
M uscle perform ance a sso c ia te d with low back pain...8 9 A g e ...91
R elationship to tem perature and Isc h a e m ia ... 91
R elationship to type of m u scle c o m p o sitio n ... 9 3 R elationship to m u scle b ioch em istry... 9 4 R elationship to m u scle n eu ro p h y sio lo g y ... 95
Application of neural networks to pow er sp ectra d a t a ... 96
Co n t e m p o r a r y d e v e l o p m e n t s a n d fu t u r e r e s e a r c h in m u sc u la r FATIGUE...9 7 Clinical APPLICATIONS...9 9 Rehabilitation and s c r e e n in g ... 9 9
CHAPTER SIX - SUMMARY... 101
REFERENCES... 102
APPENDICES... 115
Disabilitya s s e s s m e n t q u e s t io n n a ir e s...1 1 5 Low back o u tco m e s c o r e ... 115
Modified so m a tic perception q u estio n n a ire ... 117
C o m p en sa tio n ... 117
Modified Z u n g ... 118
Job sa tisfa c tio n ... 119
E x e r c ise ... 119
Elec tr o m y o g r a m r e c o r d in g e q u ip m e n t...1 2 0 Electrom yogram eq u ip m en t... 120
Environm ent...120
Im p ed an ce t e s t ...120
Amplifier sen sitiv ity ... 121
F ilters...121
A nalogue/digital C o n v ersio n ... 121
Data s t o r a g e ...121
S a f e t y ... 121
Mic r o-c o m p u t e r... 1 2 2 So f t w a r e... 1 2 2 Su r f a c e e l e c t r o d e s...1 2 3 Lo a d c e l l... 1 2 3 Bo d y c o n t o u r f o r m u l a t o r... 1 2 3 So f t w a r e p r o g r a m s...1 2 3 L oadcell program ...123
Electrom yogram transfer P r o g r a m ...123
Spectral a n a ly sis program ... 123
File m a n a g em en t p ro g ra m ...123
Halfwidth m ea su rem en t and sam pling p rogram ... 124
Neural network s e t t in g s ... 124
LIST OF TABLES
Table 1 Possible meanings of fatigue
Table 2 Practical classification of fatigue
Table 3 Testing fast Fourier transform input-output frequencies
Table 4 Neural network training parameters
Table 5 Subject age and sex
Table 6 Subject anthropometries spectral analysis and colour mapping
Table 7 Subject maximum voluntary contraction
Table 8 Subject exercise history
Table 9 Low back outcome score
Table 10 Psychometric scores
Table 11 Job satisfaction
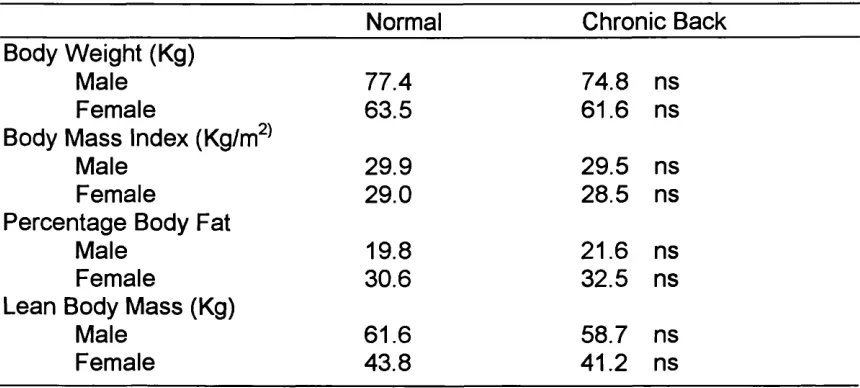
Table 12 Subject anthropometries surface electromyogram reliability
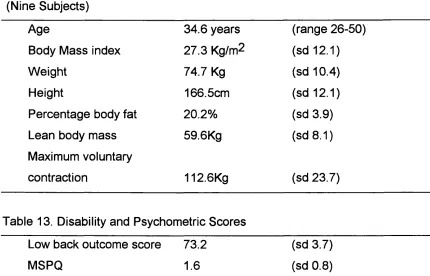
Table 13 Disability and psychometric scores
Table 14 Intraclass correlation coefficients in normals
Table 15 Males median frequency parameters
Table 16 Females median frequency parameters
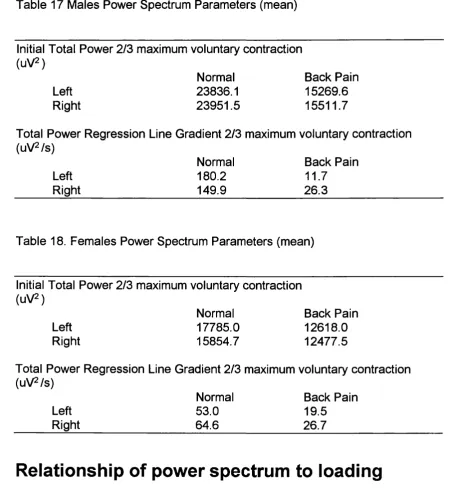
Table 17 Males power spectrum parameters
Table 18 Females power spectrum parameters
Table 19 Average mean values of spectral parameters
Table 20 Back pain versus 'normals' significance values
Table 21 Frequency bandwidths of lumbar paraspinal spectral colour
mapping-visual measurement
Table 22 Frequency halfwidths of lumbar paraspinal spectral colour
mapping computer measurement
Table 23 Halfwidth population means compared
Table 24 Maximum voluntary lumbar isometric paraspinal extensor
contraction of subjects visual and computer measurements
Table 25 Anthropometries of all subjects to train and test the back
propagation neural network
Table 27 Results with a test set of 40% of the total available input patterns
Table 28 Results with a test set of 20% of the total available input patterns
Table 29 Results with a test set of 40% of the total available input patterns
Table 30 Average and spread of specificity and sensitivity percentages
for the test set of 40% of the available patterns
Table 31 Average and spread of specificity and sensitivity percentages
for the test set of 40% of the available patterns
List of Illustrations
Figure 1 Parameters of the power spectrum
Figure 2 Diagram of a node
Figure 3 Logististic activation function
Figure 4 Typical structure of a three layer network
Figure 5 Reference frame and test subject
Figure 6 Paper template used for reliability study
Figure 7 Typical positioning of surface electrodes
Figure 8 Schematic diagram of electromyogram recording equipment for
spectral analysis
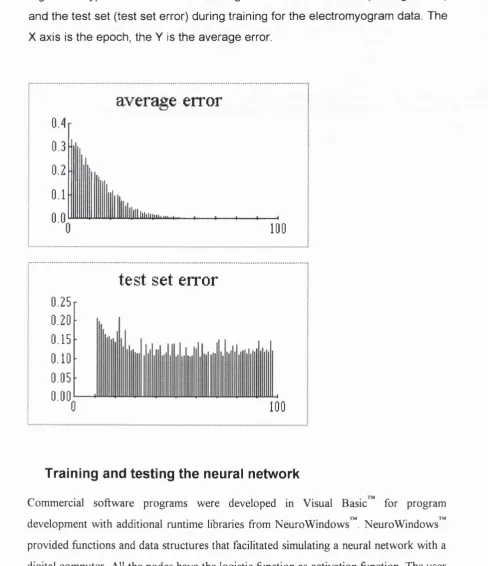
Figure 9 Typical curves for the average error of the train set and the test
set during training for the electromyogram data
Figure 10 Relationship of lean body mass versus maximum voluntary
contraction
Figure 11 Apparent Periodicity of median frequency regression line slope
normal breathing
Figure 12 Apparent Periodicity of median frequency regression line slope
breath held for duration of test
Figure 13 Relationship of age versus initial median frequency in normal
subjects
Figure 14 Normal three-dimensional graph
Figure 15 Normal spectral colour mapping
Figure 17 Athlete no past history of back pain spectral colour mapping
Figure 18 Normal scaled spectral colour map left side 2/3 and 1/3 maximum
voluntary contraction normal subject
Figure 19 Autoscaled spectral colour map left side 2/3 and 1/3 maximum
voluntary contraction normal subject
Figure 20 To show method of visual estimation of spectral bandwidth for
colour mapping
Figure 21 To show method of computer estimation of spectral halfwidth for
colour mapping
Figure 21 Relationship of spectral half width to loading-normal subjects
Figure 22 Increasing isometric load spectral colour map
Figure 23 Increasing isometric range split-range separately autoscaled
Acknowledgements
The work for this thesis was completed during the period when I was Spinal Research
Fellow to the Back Care Project to the Acute Unit-South Tees Hospitals National Health
Service Trust. The data collection was performed at South Cleveland Hospital and
Middlesbrough General Hospitals, Cleveland. The further interpretation of the
electromyogram power spectra by the use of an artificial intelligence neural network was
performed at the Institute of Orthopaedics, Robert Jones and Agnes Hunt Orthopaedic
Hospital, Oswestry. The thesis was supervised in Middlesbrough by Mr Charles G.
Greenough MD FRCS, Consultant Orthopaedic Surgeon with a specialist interest in
Spinal Surgery. Without his support, encouragement and guidance none o f this work
would have been possible.
Mr Robert Royall BSc, Principal Medical Physicist at South Cleveland Hospital gave
technical advice on the set-up of the electronic recording, computer hardware and
software. Dr Patrick Jones PhD, Medical Physicist at South Cleveland Hospital and
Michael Heally, BSc Computer Sciences student at Teeside University also gave help
writing the software programs under my guidance in Middlesbrough. Mr Willem Atsma,
a Dutch BSc Biomedical Engineering student gave additional help with software
development o f the neural networks the Institute of Orthopaedics at Oswestry.
Dr Bruce Lynn PhD, Reader in Physiology at University College London gave
supervision on behalf o f London University. Dr Lynn gave advice on the progress o f the
research and much useful criticism.
Mr Malcolm Tillotson BSc CStat, Statistician at the Spinal Research Unit, University of
Huddersfield gave statistical advice and processed the reliability and repeatability data.
Dr Patricia Dolan PhD and Dr Mike Adams PhD, Research Physiologists at The
Department o f Comparative Anatomy, Bristol University gave initial advice on
Ms Julie Sparrow, Senior Physiotherapist to The South Tees Hospitals National Health
Service Trust Back Care Project provided subjects to be studied.
Ms Jo Hilton BSc, gave much tolerance, time and constructive criticism of the thesis
during the final writing up and her assistance was invaluable throughout the thesis.
I am grateful for the helpful advice of Professor G. Bentley, Professor of Orthopaedics,
Institute o f Orthopaedics, London and Professor J Richardson, Professor of
Orthopaedics, Institute of Orthopaedics, Oswestry.
The project was funded by South Tees Hospitals National Health Service Trust for the
initial development. The interpretation of the electromyogram power spectra by the use
of neural networks was funded by the Institute of Orthopaedics, Robert Jones and Agnes
Hunt Orthopaedic Hospital, Oswestry.
A 'Wishbone' Grant from the British Orthopaedic Association helped with the initial
experimental equipment set-up.
I am also grateful to my examiners Dr Robert G. Cooper MD MRCP, Consultant
Physician, Pinderfields General Hospital, West Yorkshire and Mr J. R. Johnson FRCS,
Consultant Orthopaedic Surgeon, St Mary’s Hospital, London whom both gave much
useful advice on the revision of the first manuscript.
Additional funding on a non-commercial basis was made by:
Conn Ltd
Straumann (UK) Ltd
Johnson and Johnson Orthopaedics Ltd
EBI Medical Systems Ltd
Declaration
The study was the expansion o f the role of The Research Fellow to the South Tees
Acute Back Care Project. I was Research Fellow to the Back Care Project. The study
was a direct suggestion by Mr Charles G. Greenough MD FRCS as a method of
assessing the paraspinal muscles of the lumbar spine.
Three-dimensional and spectral colour mapping technique o f ffequency-time mapping
was my own original idea. The application o f an artificial intelligence neural network to
the interpretation o f the electromyogram data was also my own original idea. These new
techniques may have a place in the objective measurement and classification o f paraspinal
muscle dysfunction electromyogram power spectra and in the classification o f low back
pain.
I was responsible for the design and implementation of the study with help and advice
from Mr C G Greenough MD FRCS.
Development and experimental work were carried out in the South Cleveland Hospital
and Middlesbrough General Hospitals. The Research Project was approved by the South
Tees Hospitals National Health Service Trust Ethics Committee. The further
development of the an artificial intelligence neural network was carried out whilst I was
Senior Registrar in Orthopaedic and Trauma surgery at Robert Jones and Agnes Hunt
Orthopaedic Hospital, Oswestry. All the subject interviews, examinations and
electromyographic testing were all carried out by myself, each subject understood and
consented to each testing session. I received support with software development from
Michael Heally BSc, Patrick Jones PhD and Willem Atsma BSc
I was responsible for the analysis of the data with the assistance o f Mr Malcolm Tillotson
BSc CStat, Statistician at the Spinal Research Unit, University o f Huddersfield who gave
Published Abstracts
The following abstracts from scientific meeting have been published.
Reproducibility of surface lumbar paraspinal electromyograms C.W. Oliver, R.A. Royall, C.G. Greenough
JBone Joint Surg [Br] 1993;75-B:Supp III-229
Société Internationale de Recherche en Orthopédie et Traumatologie, Seoul, Korea
3-D and surface spectral colour mapping of lumbar paraspinal muscle fibre and recruitment patterns
C.W. Oliver, C.G. Greenough
J Bone Joint Surg [Br] 1993;75-B:Supp III-273 Society for Back Pain Research, Manchester
Electromyogram colour spectral mapping correlates with chronic low back pain C.W. Oliver, C.G. Greenough
J Bone Joint Surg [Br] 1994;76 - B:Supp 11-91 British Orthopaedic Research Society, Oxford
The role of paraspinal surface electromyography in low-back pain C.W. Oliver, C.G. Greenough
Scientific Presentations
The following scientific presentations have been given
How should cost effectiveness of a back care program be assessed ? C.W. Oliver, C.G. Greenough
Society for Back Pain Research Royal Society Medicine, London 1992
Surface electromyogram median frequency fatigue of lumbar paraspinal muscles: Reproducibility
C.W. Oliver, C.G. Greenough (poster) British Orthopaedic Research Society
St. James' University Hospital, Leeds 1993
Spectral Colour Mapping of Lumbar Paraspinal fatigue and endurance C.W. Oliver
Combined Leeds/Newcastle/Shefheld Orthopaedic Trainees Meeting Freeman Hospital, Newcastle 1993
Surface electromyogram median frequency fatigue of lumbar paraspinal muscles: Relationship to Isometric Load
C.W. Oliver, R.A. Royall, C.G. Greenough International Society for Study Lumbar Spine Marseilles, France 1993
Spectral colour mapping o f lumbar paraspinal surface electromyograms C.W. Oliver, P. Jones, C.G. Greenough
European Spine Society Bochum, Germany 1993
The role o f paraspinal surface electromyography in low back pain C.W. Oliver, C.G. Greenough
European Spine Society Bochum, Germany 1993
Surface Electromyogram Power Spectra in Chronic Back Pain C.W. Oliver, C.G. Greenough
Society for Back Pain Research London 1993
Artificial intelligence in the detection of low back pain C.W. Oliver
Choice of neural network algorithm to differentiate electromyogram power spectra in low back pain
C.W. Oliver, P. Jones, C.G. Greenough (poster)
British Orthopaedic Research Society, Nottingham 1994
Spectral colour mapping correlates with chronic low back pain C.W. Oliver, P. Jones, C.G. Greenough (Poster)
International Society for Study Lumbar Spine, Seattle, USA 1994
Computer Aided Neural Network Diagnosis o f Low Back Pain C.W. Oliver, P. Jones, C.G. Greenough
European Orthopaedic Research Society, London 1994
Artificial intelligence in the detection of low back pain C.W. Oliver
Royal Society of Medicine, Section of Orthopaedics, London 1994
Artificial intelligence analysis of paraspinal power spectra C.W. Oliver, WJ Atsma, J. Richardson
Chapter One - Introduction
Body movement is the prime functional sign of animal life. Without movement there can
be no life and without life there can be no movement - 'Life is Movement, Movement is
Life’ (Muller 1991). Skeletal muscle provides the motive forces for locomotion and
throughout history human beings have shown a perpetual curiosity about the structure
and function o f this fascinating contractile organ.
Aspects o f muscle function have been studied with the aid o f electromyography
which Basmajian (1985) describes as ’the enquiry o f the electrical signals that the
muscles emanate’. Electromyography has made an important contribution to our
knowledge o f the physiology of muscle. In the context o f physical impairment and
therapeutic intervention electromyography has an important role clinically in
classification and diagnosis of disease. One o f the central considerations in chronic back
pain and disability is the activity of the trunk muscles (Smidt 1983, Wolf 1991). Muscle
function in terms o f fatiguability and endurance is reduced in the deconditioned spine and
sub-optimal paraspinal muscles are thought to contribute to long term disability. With the
development o f electromyography more insight has been gained into the complex
relationship o f metabolic and electrical factors within the paraspinal muscles. It must be
noted that the paraspinal electromyogram recordings are confounded by many intrinsic
and extrinsic factors that can be interpreted in many ways. Other factors such as trauma,
psychology and malingering are known to be important in back pain (Jayson 1992).
A brief resume of the history of
electromyography
To have an understanding of spectral analysis a brief resume o f the history of
electromyography will show how the development o f the electrical study of muscle
function. Some o f the earliest scientific experiments known to us concerned the form of
drawings. The 'father' of modern anatomy Andreas Versalius in 'Fabrica' contributed
much to the knowledge o f the anatomy o f muscles. However, the heritage o f Leonardo
da Vinci and Versalius although both artistically exquisite stressed the appearance and
gross anatomy o f dead muscles rather than their dynamic functions.
During the later Renaissance a series o f scientists began to study the functions of
muscles. The first logical deductions o f muscle generated electricity was documented by
the Italian Francesco Reudi in 1666 who suspected that the shock o f an electric ray fish
was muscular in origin. The relationship between electricity and muscle was first
observed by Luiggi Galvani in 1791. In this famous series o f experiments Galvani
depolarised the muscles of frogs' legs by touching them with metal rods. This discovery
is generally acknowledged as representing the birth of neurophysiology. Galvani wrote
about his discoveries in 'De Viribus Electricitatis\ Alessandro Volta produced a device,
’battery’ for stimulating muscles conveniently and used it to stimulate muscles and elicit
muscular contractions.
It was not until 1849 when the Frenchman Du Bois-Reymond devised a practical
galvanometer that it was possible to elicit electrical activity from human muscles. In Du
Bois-Reymonds' experiment he devised a surface electrode that consisted of a wire
attached to a blotting paper immersed in a jar o f saline solution. He found that when his
fingers were immersed in the saline solution, and his arms and hand were contracted the
deflection of a galvanometer was minute, approximately two to three degrees. He
realised that the impedance of the skin reduced the current that could drive the
galvanometer. He circumvented this problem by inducing a blister on each forearm and
measured a sizeable deflection; sixty-five degrees on his galvanometer. He repeated the
experiment three times for each arm and always obtained the same result and to remove
doubt repeated the whole experiment three weeks later when the skin had healed. He
obtained the same results. This work was published in 'Uber Thiersche Electricat in
1849 (Basmajian 1985).
Techniques for detecting signals were much improved by the invention of the
cathode-ray oscilloscope by Braun (1897) as this new tool allowed a dynamic visual
display o f events. The concentric needle electrode was introduced by Adrian and Bronk
(1929) and enabled direct observation o f the electrical activity associated with individual
could interpret action potentials and later won the Nobel Prize in 1944 for their research
into single muscle action potentials.
The earliest clinical application of electromyography was made by Probster
(1928) who obtained signals from muscles with peripheral nerve paralysis. Studies of
muscle locomotion by kinesiologists began and the first study of movement of the
shoulder region by Inman (1944) gained wide acceptance.
The earliest note o f myoelectrical fatigue was made by Piper (1912) who noted
that the frequency component o f the surface myoelectric signal decreased when a muscle
contraction was sustained. Cobb and Forbes (1923) not only noted this shift o f frequency
toward the lower end of the frequency spectrum but also described a consistent increase
of the amplitude o f the surface myoelectric amplitude with fatigue.
The first descriptive studies of function of the erector spinae in conjunction with
movement and posture were made by Floyd and Silver (1951, 1955) and o f the anterior
abdominal wall by Floyd and Silver (1950). Floyd and Silver used a combination of
electromyogram, photographic and radiographic techniques. Morris (1962) performed an
admirable early study using embedded copper wire electrodes o f the intrinsic muscles of
the back and determined the individual actions in the erector spinae; multifidus,
rotatores, iliocostalis lumborum, iliocostalis dorsi and longissimus dorsi in simple and
combined movements.
Much pioneering research was performed on the electromyogram of the Lumbar
spine by Andersson in the 1970's. Studies of sitting postures (Andersson 1974) compared
surface and fine wire electrodes and found that surface electrodes gave smaller
coefficients of variation as compared to fine wire electrodes. In conjunction with in vivo
intradiscal pressure an early form o f power spectrum analysis o f the lumbar muscles was
used by Andersson (1977a) It was found that the amplitude o f the myoelectric signal
correlated well the magnitude of the power spectrum at several levels o f the lumbar
spine. Andersson observed that the greatest shifts in power spectra occurred where the
electromyogram signal amplitudes were greatest and hypothesised that localised
Development of power spectra analysis in the
lumbar spine
It was not until the advent of powerful computers and the development of the fast
Fourier transformation that power spectral analysis developed. Recently Kondraske
(1987), Siedel (1987), Rosenburg (1989), Mayer (1989), Roy (1989), Sward (1990)
Biedermann (1991) and Klein (1991) have used modifications o f varying sophistication
o f power spectral analysis techniques in to analyse electromyogram activity in the lumbar
spine. Cooper (1993), recently attempted to determine the proportion o f paraspinal
fatiguability that is contributable to ‘central’ or ‘peripheral’ processes. Although using
surface electrodes the frequency analysis was as integrated electromyogram signal and no
frequency analysis o f components o f the signal was made.
Surface electromyogram is attractive because it is non invasive and has direct and
indirect relationships to physiological, biochemical, anatomical and pathological events
within the muscle. Other currently used techniques and devices for evaluating the
performance o f back muscles measure mechanical variables associated with force,
velocity, or displacement of the trunk. All approaches share a common flaw in that the
measured kinematics and force variables may be voluntarily regulated in a manner that
can meaningfully effect the values o f the variables being measured. A highly motivated
individual interested in knowing the upper limits of their strength would perform to the
full extent of their capability. Whereas an individual with less motivation would perform
at a lesser level, thus not revealing their full potential (DeLuca 1993, Mayer 1989).
Electromyogram measurement techniques of paraspinal muscle are not routinely used
within the United Kingdom although commercial machines capable of performing limited
aspects o f spectral analysis have recently become available. Some o f the newer black-box
type o f machines have no real-time electromyogram display and could be misleading as
artefacts unknowingly may be recorded.
Spinal muscular power is important as in a weakened state due to pain trunk
muscles would have a reduced capacity to splint against excessive spinal segment
motion, prevent ligamentous and capsular ligament sprains and withstand and control
loads during functional activities (Andersson 1977a, Smidt 1983, Smidt 1988, Wolf
measures o f trunk muscle activity should be included in any estimation of a patient
physical impairment assessment. Objective information is important in assessing low-
back function, identifying changes in physical capability and the effect o f a rehabilitation
program.
The multiple spinal motion segments involved make it difficult however to
standardise body position or body movement to a particular task. It is also very difficult
to exactly mimic the exact task in the workplace. A recurrent problem occurring not only
in animal testing but in human testing as well is that unnatural force, environment and
testing apparatus are used to assess a subject that would not mimic the normal human
daily activities. Little is known about the transferability of isolated muscle function to
occupational and non occupational activities (Smidt 1988).
Andersson (1977a), Kondraske (1987), Siedel (1987), Rosenburg (1989), Mayer
(1989), Roy (1989), Roy (1990), Sward (1990), Simms (1989), Biedermann (1991) and
Klein (1991) have all performed clinical studies o f the lumbar spine employing the
technique of spectral analysis. These studies are all o f small series of subjects, the best
studied group series is that o f Roys (1989) comparing twelve normal subjects with
twelve back pain subjects. All the workers performed fatigue studies o f the lumbar
extensor muscles and used some form of frequency analysis. Only Mayer (1989), Roy
(1989), Roy (1990), Sward (1990) Biedermann (1991) and Klein (1991) used fast
Fourier transforms to interpret their results. The subjects tested were placed in vertical or
stooped postures and all the studies attempted to control posture and electrode
placement to some degree. None of the researchers performed any reliability studies with
freshly applied surface electrodes. Roy (1989) and Mayer (1989) both found significant
differences between normal and back pain subjects. Roys' paper used the ‘Back Analysis
System’ that was developed by their research team consisting of a six channel recording
system that averages fatiguability from the multiple inputs. It is argued that this kind of
multichannel system produces more reproducible results. Roy used the ‘back analysis
system’ and was able to identify control subjects with an accuracy o f 84% (10 of 12) and
lower back subjects with an accuracy o f 91% (11 o f 12) purely on the basis of the
electromyogram spectral variable test. In the two groups of Roy's series the maximum
voluntary contraction was indistinguishable at the 95% confidence level.
Little work on spectral analysis in other disease conditions in the back has been
subjects with low back pain. The information maps from the ‘back analysis system’ of
five subjects with fibromyalgia syndrome who complained o f pain in the back were
compared to twelve subjects who had idiopathic low back pain and ten age-weight
matched normal control subjects who never had experienced back pain. The fibromyalgia
subjects were identified according to currently proposed diagnostic criteria. By
orthogonal t-tests it was found that the information map from the ‘back analysis system’
for the low back subjects was statistically distinctive (P <0.05) from that of both the
control and fibromyalgia subjects. The fibromyalgia and control groups were statistically
indistinguishable at the P = 0.05 level.
Spectral analysis has been described by Deluca (1985) as having possible future
roles in pre-employment screening of a work force, however, before spectral analysis
could be used for such a use the technique would need to be very carefully evaluated and
multicentre tested for reproducibility and reliability amongst a broad spectrum of the
population. Other uses o f spectral analysis have been described for uses in athletic
training (Sward 1990), ergonomics (Lacuna 1983), (Hosea 1986), diagnosis of
neuromuscular disorders (Boruta 1981), (Linssen 1991) and rehabilitation (Smidt 1988).
Many studies throughout the body using spectral analysis to quantify fatigue have been
made and caution must be taken extrapolating upper arm (Moritani 1982), forearm
(Daanen 1990), hand (Alfonsi 1991), thigh (Linssen 1991), leg and cervical spine (Philips
1983) to the lumbar spine. Extrapolation would have to take into account many factors
including relative blood flow and fibre types to each muscle.
A discussion of muscular fatigue in the lumbar
spine
The general concept of fatigue
The concept o f fatigue is ambiguous and often misapplied. Fatigue may mean many
different things to health specialists, scientists and patients. In man fatigue is a complex
interaction of physiological and psychological phenomena. Testing fatigue is difficult and
testing and secondly the observer may incorrectly set the expectation o f fatigue limit.
Fatigue does not always occur within a specific definable time. When an individual
becomes fatigued they may not be able to perform a definite task and this should not
simply be defined as the 'endpoint of failure. DeLuca (1984) gives the example of a steel
girder in a bridge that stands for many years. Although the bridge remains in place for
many years with no apparent signs of physical wear there may suddenly in one instant be
a fracture in one o f its girders. The bridge may then suddenly fail and collapse. If one
observed from a distance the main structure of the bridge no outward sign of fatigue
would be seen. All the while however the crystalline structure o f the steel girder was
undergoing an internal alteration caused by chemical and physical processes. To monitor
fatigue, specimens o f data firom within the girder itself or externally observable
modifications related to its internal structure need to be monitored. The girder in the
bridge has a failure point that can only be seen to occur when it is no longer able to
support a load and the fatigue becomes visible. Overt fatigue may be represented by a
failure to perform a task previously satisfactorily performed. A similar parallel can be
made to muscle which have internal changes before they manifest overt failure and can
no longer sustain load. Physiological fatigue has been simply be defined 'as a reduction
in muscle tension' (Sandercock 1985) or 'failure to maintain desired or expected force'
(Edwards 1981). These simple definitions do not reflect the electrophysiological changes
of fatigue seen with power spectral shifts during constant isometric loading. Access to
physiological and biochemical data from within the muscle or nervous system can reveal
time dependent change's indicative o f a fatigue process, even though the externally
observable mechanical performance would not be altered until the 'failure point. Table 1
Table 1. Possible meanings of fatigue
Table 1. Possible meanings of fatigue
Definition
1. Impaired intellectual performance 2. Impaired motor performance
3. Increased electromyogram activity for given performance 4. Shift of electromyogram power spectrum to lower frequencies 5. Impaired force generation
Confusion of perception associated with fatiguing muscular activity
1. Increased effort maintaining force
2. Discomfort or pain associated with muscular activity 3. Perceived impairment of force generation
After-Edwards (1981)
Bills (1943) suggested that fatigue be divided into three major categories. The first was
subjective fatigue characterised by a decline in alertness, mental concentration and other
numerous psychological factors. The second was objective fatigue characterised by a
decline in work output. The third was physiological fatigue characterised by changes in
physiological processes.
The mechanism underlying physiological muscle fatigue has been considered in
terms o f central nervous system fatigue versus peripheral fatigue by Bigland-Ritchie
(1978, 1981). Table 2 presents a practical classification o f fatigue. It was estimated by
Bigland-Ritchie using surface electromyogram recordings that change occurring
proximal to the neuromuscular junction (central fatigue) can consistently account for up
to 30% of the total force loss even in apparently well motivated subjects (in the
Table 2. Practical classification of fatigue
Table 2. Practical classification of fatigue
Physiological mechanism Central fatigue
Failure (voluntary or involuntary) of neural drive, resulting in:
1 ) reduction in number of functioning motor units
2) reduction of motor unit firing frequency
Peripheral fatigue
Failure offeree generation of whole muscle:
high frequency fatigue
a) impaired neuromuscular transmission
b) failure of muscle action potentials
low frequency fatigue
impaired excitation-coupling
Clinical condition
Neurasthenia, hysterical paralysis, and other conditions lacking motivation
a) myasthenia gravis cooling, curare
b) myotonia congenita glycolytic disorders
mitochondrial disorders dantolene sodium treatment
? myotonia congenita ? hypokaelaemic periodic paralysis
duchenne dystrophy
After-Edwards (1981)
Myoelectric parameters of fatigue
The study o f the surface myoelectric signal to demonstrate localised muscular fatigue has
been very extensively employed. Many authors since Piper in 1912 have described the
increase in myoelectrical signal with fatigue. The frequency shift towards lower
frequencies has been observed in many muscles throughout the human body by:
(1984), Moritani (1986), Shochina (1986), Krondraske (1987), Siedel (1987), Mayer
(1988), Roy (1989), Sward (1990), Biedermann (1991), Klein (1991). These two
phenomena are interrelated as during a sustained contraction the low frequency
components of the myoelectric signal increase and more myoelectric signal will be
transmitted through the low-pass filtering effect o f the body tissue. The magnitude of
these two phenomena will be dependant on many physiological factors such as force
level o f contraction, duration of contraction, posture, the type o f electrode used and the
particular muscle being investigated (DeLuca 1984).
Four hypotheses to account for the increase in amplitude and frequency shifts of
the myoelectric signal during sustained constant force isometric contractions have been
proposed and summarised by DeLuca (1984). Deluca argues a case for motor unit
recruitment, motor unit synchronisation, changes in conduction velocity of the muscle
fibres and regularity (coefficient of variation) of the motor unit discharge.
Moritani (1986) recorded elbow flexor surface electromyograms and
intramuscular motor unit spikes simultaneously so that surface electromyogram spectral
analysis and intramuscular spike amplitude frequency analysis could be performed under
the same conditions, it was found that the mean power frequency fell more rapidly at
maximum voluntary contraction than at 50% maximum voluntary contraction. During
these fatiguing contractions intramuscular spike recording suggested equivocal new
recruitment of motor units. Failure to record new recruitment was attributed to central
fatigue. Synchronisation o f the firing rate was thought to be the major factor, whereas
Mills (1982) attributed the shift to changes in the motor unit action potential
configuration. Sandercock (1985) stimulating cat gastronemius at high frequency to elicit
'high frequency fatigue' observed changes in the amplitude and duration o f motor unit
action potentials that correlated highly with changes in tension development but that did
not correlate with lower frequency stimulation and tension. Sandercock concluded that
the electromyogram signal is dependant on a summation and cancellation o f individual
motor unit action potentials and that the electromyogram provides a reasonable estimate
of high-frequency fatigue but an unreliable measure o f low-frequency fatigue. In
evaluating the spectral shift Bigland-Ritchie (1981) concluded that changes in muscle
Mathematical models and the fast Fourier
transformation
Mathematical models o f the myoelectric signal have been used Blinowska (1987) to
evaluate firing and synchronisation degree. These models only provide a limited insight
as they are highly dependant on assumptions about the discharge statistics o f motor units
and the shapes o f action potentials.
Time and fi'equency domain analysis, otherwise known as spectral analysis o f the
electromyogram since the common availability o f the micro-computer has had
considerable attention. The mathematics of the fast Fourier transforms are well known
and its relationship to surface electromyogram has been reviewed by DeLuca (1984) and
Basmajian (1985). Fast Fourier transforms in real time Basano (1986), and Castaldo
(1991) has allowed almost instantaneous viewing o f the power spectrum.
Shape of the myoelectric action potential waveform
The shape of the wave form of the motor unit action potential contributes to the power
density spectrum o f the myoelectric signal. The waveform is affected by many known
factors. The tissue filtering determines the actual motor unit action potential shape and
the conduction velocity of the muscle fibres modifies the characteristics o f the waveform.
The amount of tissue filtering is determined by; the three-dimensional arrangements of
the muscle fibres o f an active motor unit, the distance between the surface electrodes and
the active muscle fibres and the location of the electrode on the surface of the muscle as
a function o f the distance between the innervation zone and the tendon o f the muscle
(DeLuca 1984). It is therefore very important to control these confounding factors if any
degree o f reliability is to be achieved in experimental studies. The thickness of the fatty
tissue between the electrode and the muscle affects the amount o f spatial filtering on the
Measurement of electromyogram frequency shift
Measurement of the frequency shift can be performed in several ways. DeVries (1968b),
Lloyd (1971), Petrofsky and Lind (1980) measured modifications o f the root means
square value o f the myoelectric signal. As the myoelectric spectrum is modified by a
concurrent increase in the low frequency components with a decrease in the high
frequency components this measure of the total power density spectrum had a reduced
sensitivity to any fi'equency shift of the spectrum. Therefore to look just at the amplitude
or root means square value or integrated electromyogram (Moritani 1978) is not very
accurate in defining a shift. Ratio parameters of the root mean squares were used by
Bigland-Ritchie (1981) but have more recently been replaced by analysis o f components
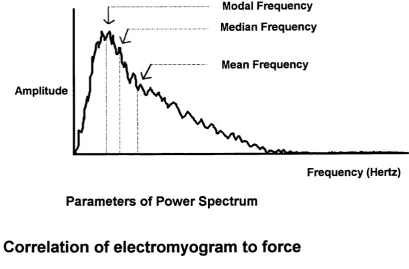
of the power spectrum. The median-ffequency, the mean frequency and the mode
frequency are commonly used. The median frequency (sometimes called centre
frequency) is the frequency at which the power density spectrum is divided into two
equal regions o f equal power. The mean frequency is the average frequency and the
mode frequency is the frequency of the peak amplitude o f the spectrum. All three are in a
mathematical sense related to the conduction velocity of the muscle fibres (Stulen and
DeLuca 1981).
The mean frequency has been usefully employed by: Moritani (1986), Barnes
(1987), Siedel (1987), Mayer (1989), Rosenburg (1989), Daanen (1990), Alfonsi (1991)
and Castaldo (1991). The mean frequency was said to be a more robust parameter and
has a greater noise immunity on mathematical grounds (Castaldo 1991).The median
frequency has been used by Petrofsky and Lind (1980a), Merletti (1983), Kranz (1983),
Roy (1989), Merletti (1990), Biedermann (1991), DeAngelis (1990), Klein (1991) and
Dolan (1992). The mode frequency is not very useful as it superficially may appear
because even for a relatively minor change in the variance of the spectrum there would
be a large change in the mode. Schweitzer (1979) estimated that the coefficient of
variation for the estimate of mode frequency was five times greater than that of the mean
frequencies obtained from the human diaphragm. It would be possible to produce
instantaneous real time results if required. Parameters o f the frequency shift are
Figure 1 Parameters of the Power Spectrum
Modal Frequency
Median Frequency
Mean Frequency
Amplitude
Frequency (Hertz)
Parameters of Power Spectrum
Correlation of electromyogram to force
Correlation o f electromyogram with force has remained problematic. Lawrence (1983)
found under careful and controlled conditions in the biceps, deltoid and first dorsal
interossei that the myoelectric signal to force relationship exhibited considerable
variability. Although the maximum voluntary contraction is a reliable reference level of
force there was no consistent reference quantity for amplitude of the electromyogram
signal. The signal to force relationship in the first dorsal interossei was linear but in the
biceps and deltoid was non-linear; this may partially due to variation in fibre types within
the muscles and different patterns of fibre recruitment.
Both the mean and median frequency have been shown to reduce as a function of
time during sustained contractions and the rate o f decrease has been found to be
approximately quasi-linear (Petrofsky 1980a 1980b) or quasi exponential Lindstrom
(1977), Hagberg (1981), Stulen and DeLuca (1982). The reduction in median frequency
can be attributed to fatigue but some differences may be due to different muscles being
studied or different processing schemes (Lawrence 1983). It is not known what the
Reliability, repeatabiiity and reproducibiiity of the
power spectrum
Reproducibility o f a physiological experiment is crucial to the credibility of a technique.
True reproducibility o f results will be only be observed from several centres replicating a
technique. Reliability will show the chance of a series of results repeating themselves on
more than on occasion. Repeatability will give a measure of the reliability o f these results
(Fleiss 1986). There have only been scant reports o f reproducibility, reliability and
repeatability o f median frequency recording techniques in the lumbar spine. The
efficiency o f electrical activity was used by Stokes (1987) to characterise the integrated
electromyogram-extensor torque relationship. The efficiency index was found to be non
linear in each subject. The coefficient of variability (within subjects) was greater in day to
day testing (24%) than with repeated pulls at the same testing session (14%). About 25%
of the variability between subjects in Stokes series were found to be related to
anthropometric differences. The efficiency of electrical activity is therefore not a useful
parameter in assessing the torque of the lumbar muscles as assessed by the
electromyogram. There have been no large reliability studies of spectral parameters on
median frequency and power spectra published to date. Roy (1989) ascertained the error
induced in the value of the electromyogram spectral variable by repeating a contraction
within 15 minutes under similar conditions; the error was found to be 2% for the initial
value and 6% for the slope o f the median frequency. Performing similar evaluations on
test/retest measurements, Biedermann (1990) found that the error in the repeatability of
the median frequency slope measurement increased to approximately 10% when the
electrode was replaced after a 5 day interval.
Bazzy (1986) noted in the biceps that the change in the length and geometry as
muscle contracts isometrically can alter or induce indirectly an increase in the power of
the low frequency content of the electromyogram. Muscle length would be very
important to control in isometric studies. Isometric dynamometers that have a spring that
will easily stretch will therefore not truly record muscle length. Daanen (1990) has
shown in the forearm flexors that with the mean power frequency, the inter individual
Some difference in individual differences may be due to electrode placement and would
be important for longitudinal studies.
Komi (1970) in the elbow and Wolf (1991) in the lumbar spine compared surface
and fine wire electrodes in the same subjects. Surface electrodes record a larger portion
of erector spinae muscle than needle electrodes. Komi (1970) at a test-retest interval of
55 days obtained relatively high reliability coefficients o f repetition with surface
electrodes as compared to needle electrodes. Using surface electrode recording
techniques the multifidus muscle at L5 was shown by to give more consistent results than
at LI or L2 during fatiguing intermittent isometric extension by Van Dieen (1993).
Surface electrodes have the advantage of being non invasive.
strength and the lumbar spine
Males as a group are stronger than females, but when strength is normalised to body
weight, females may be equivalent to males (Nachemson 1969, Smidt 1983). The spinal
extensors are stronger than the flexors with an average extension to flexion ratio of 1.3
male and 1.7 female (Gomez 1991), 1.3 all (Sward 1990). Any value given to the
extensor to flexion ratio is dependent on the type o f muscle contraction, trunk angular
velocity, fixity o f the upper and lower limits of motion and spatial orientation of the
trunk (McIntyre 1990, Smith 1985, Thorstensson 1982). Females have been shown to
have a superior trunk muscle endurance to that o f males (Smidt 1983). Savage (1991)
using magnetic resonance imaging showed that lumbar muscularity declines with age in
males and was surprisingly not significantly affected by occupation or by a history of
low-back pain
Normalisation of maximum voluntary contraction has been used by Kondraske
(1987) by expressing maximal voluntary contraction as a percentage o f body weight in
quantifying trunk muscle fatigue. This would normalise muscle performance concerning
an anthropometric measure that is assumed to be related to muscle strength. However
body weight has been shown to be a poor predictor o f trunk muscle strength (Nicolaissen
1985).
The contribution to isometric trunk muscle strength in low back pain by either a
surface integrated electromyograms in more flexed positions supported a muscle
deficiency model o f back pain.
Effect of exercise and training on the iumbar spine
In an early study, Chapman and Troup (1969) attempted to evaluate mechanical and
electrical changes in the back extensor muscles as a result of resistive exercise. In this
study the isometric exercise produced similar gains in peak isometric strength and
integrated electromyogram. In a six-week training session Smidt (1988) showed that in
normal males and females who underwent high-intensity resistive exercise that trunk
muscle strength gains occurred and were superior in eccentric (lengthening) exercise and
that trunk muscle strength endurance was maintained when gains had occurred at six
weeks. Resistive eccentric exercises require a well-motivated person to co-operate with
the testing program and these exercises are known to be painful. Relatively rapid gains in
strength should be expected early in an exercise training program and more gradual gains
thereafter (Komi 1986). Morphological changes in muscle do not occur for several
weeks into an exercise program, so early gains in strength can logically be attributed to
an increased neural drive to the muscle (Komi 1986, Moritani 1979). The proportion of
contribution from increased neural drive versus biological changes of structure,
hypertrophy and biochemistry within muscles is unanswered.
Endurance testing by Mayer (1989) involved holding the trunk unsupported on a
Roman chair' while mean power frequency was measured. Comparing normal and unfit
deconditioned subjects there were significant differences between groups throughout
early rehabilitation and at seven weeks. The test sensitivity was poor at identifying
subjects with low endurance. There was no significant correlation between
electromyogram initial mean power frequency measures and isokinetic extensor trunk
exercises even though all subjects showed a isokinetic improvement. Although the group
statistics reflected a change this could not be extrapolated to a normative database. There
was also found a 5% non responder rate to treatment.
In elite athletes, wrestlers were found to be stronger than tennis players by Sward
(1990). Wrestling demands more isometric and explosive strength than tennis that is
addition were noted to have asymmetrical strength and endurance development,
suggesting that asymmetrical endurance may be developed by training.
Screening the lumbar spine
Isometric lifting strength has been shown by Batti'e (1989) to be an ineffective measure
of the predictability o f a back pain report and that greater strength was associated vrith a
higher risk o f industrial back injury claims. Stronger subjects were found to be at a
greater risk of claims. If isometric lifting strength had been used for screening it would
not have reduced the number of back injury claims in this population. With sophisticated
lumbar dynamometry such as the Isostation B-200, Hirsh (1991) has shown that there
was a positive relationship between excessive illness behaviour and almost all
biomechanical variables tested. Poor performance o f this kind o f population may be a
form o f abnormal illness behaviour and may not accurately reflect organic alterations of
neuromusculoskeletal function. Therefore none of these more modern methods o f testing
have had any great impact on medico-legal cases in the settlement o f malingering and
compensation (Jayson 1992).
Early in the development o f electromyogram screening for low-back pain, Hoyt
(1981) suggested that surface electromyogram assessment may be a useful tool. Using a
non-stressful measurement procedure in eighty subjects with band-passing between 100-
200Hz only, he found it possible to differentiate between normals and low back pain
subjects. Testing in Hoyts paper was performed in a sound attenuated box with a one
way mirror to attempt to eliminate extraneous stimulus during testing. Large left-right
differences in paraspinal activity were demonstrated in this study that did not use
sophisticated frequency analysis.
A study by Roy (1990) was performed on varsity rowers and the cohort was
tested without a prior knowledge of which, if any, of the subjects suffered from low back
pain. There were thirteen port rowers and ten starboard rowers. After the tests, six of the
rowers had supporting evidence that they had low back pain. Four had acute pain but
were not experiencing pain during the tests; two had chronic pain, and were in pain
during the tests. In this study the information map from the ‘back analysis system’
minute recovery. The test identified 100% (six) o f the subjects with low back pain and
93% (fourteen o f fifteen) without low back pain, 100% of the starboard rowers, and
100% of the port rowers. Klein (1991) compared conventional clinical measures with
electromyogram spectral variables in twenty sweep rowers to identify individuals with
low back pain. A discriminant analysis for range o f motion and maximum extensor
voluntary contraction identified 57% of the rowers with low back pain and 63% o f the
rowers without low back pain. A similar discriminant analysis procedure for
electromyogram spectral parameters identified 88% o f the rowers with low-back pain
and 100% of the rowers without low-back pain at one minute recovery time and 100%
of the rowers without low-back pain and 88% o f the rowers with low back pain at two
minutes recovery time.
Application of artificial intelligence to the
analysis of electromyogram power spectra
Background to artificial intelligence
Artificial intelligence systems such as neural networks have been used for a
variety o f medical data classification and image processing tasks (Wasserman 1989,
Nishikawa 1990, Simpson 1990). Neural networks are computational techniques for
recognising patterns that have undergone a renaissance o f interest over the last decade.
Networks employing various architectures and learning algorithms have found uses in
both academic medical and industrial applications. Research into neural networks was
active in the 1940s but has undergone recent increased interest because o f the advent of
powerful desk-top computers. A comprehensive revue o f the medical applications of
neural networks is given by Miller (1992). Wasserman (1989) gives an insight into the
design and neural modelling o f various networks.
A neural network consists o f simple processing units called ‘neurons’ or ‘nodes’
which have a passing resemblance to actual biological neurons. Each neuron is connected
to other neurons in the network by unidirectional neurons o f different strength or
weights. Early designs were based on the ‘perceptron’, a processing element that
output. Currently networks exist which use both linear and non-linear functions and have
either binary or continuous activation’s.
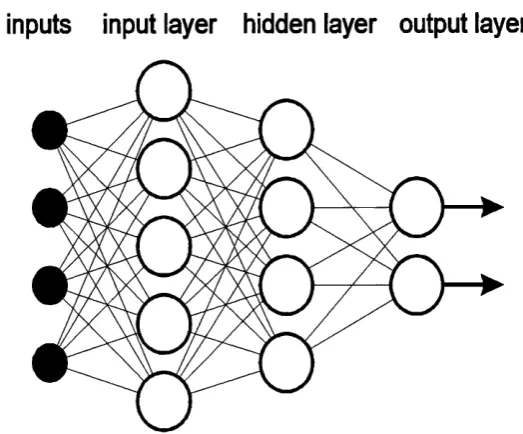
The neurons are usually arranged in a series of layers bounded by input and
output layers encompassing a variable number of hidden layers connected in a structure
that depends on the complexity of the problem to be solved. Connections usually feed
from the input to the output layers, a feedforward network, although feedback
connections from hidden layer to input layer is possible. Information from the input layer
is thus propagated down through the network to the output layer. A layer is fully
connected if each node in the layer is connected to all the nodes in the adjacent layer.
The input layer only serves as a means of acquiring an input and distributing it to the
other network neurons.
The most important feature o f neural networks is their ability to learn from
examples. Because the learnt information is stored across the network weights can be
used to generalise input information. This means appropriate classifications will be made
even for input patterns not actually in the training set, provided the training set covered a
representative group of patterns. The ability for to learn and generalise means that neural
networks have the potential for solving image and signal processing problems that are
not possible with rule based problem solving. Previous networks training times have been
very long but since the advent o f the desk-top personal computer these have been
dramatically shortened.
Neural networks can be divided into two main classes, those employing
supervised learning and those with unsupervised learning. Hybrid systems using both
stategies have been developed.
There are several interpretations for the way neural nets work. A neural net is an
abstract concept. It is a set of algorithms that could be implemented in hardware, but
more often are simulated with a digital computer. When the neural net is regarded as a
black box, then all there is to see is a number of inputs and a number of outputs. A neural
network can be trained to associate sets of inputs with a set o f output values.. Various
neural networks have been described by Lippman (1987) as being constructed by “dense
interconnection o f simple computational elements”. These are similar to structures found
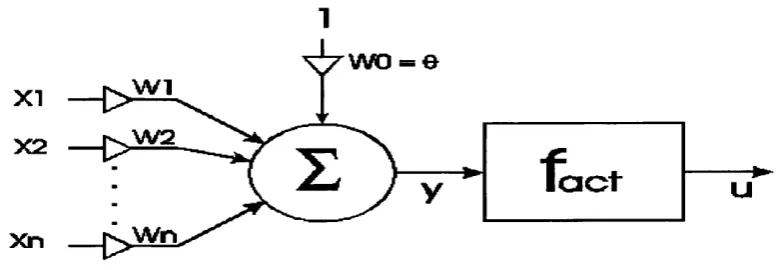
in the human nervous system. The computational elements are called nodes or neurons.
A schematic diagram of a node is given in figure 2. The node was described by
wo - e
X I — 1 > ^X 2 ---- [ > ^
a c t
X n __ [^ W n .Figure 2 Diagram of a node; after Lippmann (1987)
The perceptron has an n-dimensional input vector; a bias value 9 is added, which is the
same as subtracting a threshold value -6. The value of y is the weighted sum of all the
inputs; this value is then the input of a non-linearity, the activation function (fact)^ which
produces output u o f the node. The relation between)/ and the input vector x is given by
a linear equation: y = -x where w is the vector containing all the weights, including
M>o, X o is set to 1. The original perceptron had a hard-limiter as activation function, with
u=-l ÏOX y<0 and u ^ l for )/>0, which mapped the output to the interval [-1.1]. The
non-linearity used in this project is the logistic or sigmoid function, given by:
1
f a c t i y ) =
l + e~
Figure 3 is a plot o f the logistic function. The function maps input value y to the interval
[0..1]. The disadvantage o f the hard-limiter as activation function is that it is not
differentiable. The sigmoid is, which allows gradient search learning algorithms for
multiple layer networks.
■15 10 -5 0 5
Figure 3: Logistic activation function; input y at the horizontal, output f(y) at the