Philip Nagy
a n dRandall Penfield
The Ontario Institute for Studies in Education of the University of Toronto
A Procedure for Detecting Student Profile
Patterns in a Performance Assessment
This study investigates student score profiles of the mathematics component of the 1997 Ontario grade 3 assessment. In addition to an overall score, students are given scores on three knowledge or skill dimensions, and five scores on content strands. The purpose of this investigation was threefold: (a) to assess the extent to which student profiles contain differen-tially diagnostic information, (b) to examine classroom-level patterns in the student profiles, and (c) to develop alternative methods of analyzing profile data to gain classroom-level diagnostic information. The results show that 70% of the students have the same score on all three knowledge/skill categories (flat profiles) and thus provide no differentially diagnostic information. The profiles for the remaining 30% of the students consisted almost exclusively of contoured profiles in which there was a difference of only one unit between one of the categories and the other two. Using algorithms developed in this article, these profiles were used to assess the relative strengths and weaknesses at the classroom level, as well as examining within-classroom diversity. This investigation found that nearly 60% of class-rooms hada relative weakness in comprehension, and 25% of classclass-rooms displayed substan-tial diversity. Examination of profiles of the five content strands indicated that nearly 69% of the students also had either flat or contoured profiles, whereas the remainder had more complex patterns. Methodologies for interpreting relative strengths and weaknesses on the mathematics strands at the student and the classroom level are discussed.
Cette recherche étudie le rendement d'élèves de troisième année en mathématiques à l'examen provincial en Ontario en 1997. Les élèves y obtiennent une note globale, une note sur trois catégories visant les connaissances ou les habiletés, et cinq notes pour le contenu. La présente étude avait trois buts: (a) évaluer jusqu'à quel point les profils d'élèves contiennent de l'information diagnostique différentielle, (b) discerner les patterns à l'échelle de la salle de classe à partir des profils d'élèves et (c) développer des méthodes alternatives d'analyser les données du rendement pour permettre la cueillette d'information diagnostique à l'échelle de la salle de classe. Les résultats indiquent que 70% des élèves ont eu la même note sur les trois catégories visant les connaissances ou les habiletés (les profils plats); ces résultats ne fournis-sent donc aucune information diagnostique différentielle. Les profils de l'autre 30% des élèves consistaient presque exclusivement de profils courbés où il y avait une différence d'une unité entre une des catégories et les deux autres. A l'aide d'algorithmes développés pendant l'étude, on s'est servi de ces profils pour évaluer les forces et les faiblesses relatives à l'échelle de la salle de classe et pour étudier la diversité à l'intérieur de la salle de classe. L'étude a révélé que dans presque 60% des salles de classe, il y avait une faiblesse relative au niveau de la compréhension et qu'une diversité considérable existait dans 25% des salles de classe. L'étude des cinq notes pour le contenu a indiqué que presque 69% des élèves avaient un profil qui était soit plat ou courbé, alors que les autres avaient des profils plus complexes. On
Philip Nagy is a professor in the Measurement and Evaluation program. His interests are in large-scale assessment and data analysis.
discute de méthodologies servant à interpréter les forces et les faiblesses relatives en mathé-matiques à l'échelle de l'individu et à l'échelle de la salle de classe.
Introduction
In recent years, large-scale assessment has m o v e d a w a y f r o m multiple-choice tests to m o r e c o m p l e x performance assessments. O n e reason for this shift has been criticism of the n a r r o w i n g c u r r i c u l a r impact of multiple-choice testing, m u c h of w h i c h can be construed as variations o n the theme of inappropriate teaching to the test ( C a n n e l l , 1988; M a d a u s , 1991; M o o r e , 1994; N a t i o n a l C o m -m i s s i o n o n Testing a n d P u b l i c Policy, 1990). U n l i k e -multiple-choice ite-ms, performance assessments are seen as authentic i n their relationship to educa-tional goals.1 The a r g u m e n t is that if the assessment tasks are truly w h a t w e
w a n t students to learn, then teaching to the test is turned f r o m a liability to a benefit.
Performance assessments take the f o r m of tasks m o r e i n k e e p i n g w i t h classroom a n d r e a l w o r l d d e m a n d s than s i m p l y c h o o s i n g one of several o p -tions to a m u l t i p l e - c h o i c e question. The tasks are u s u a l l y paper-and-pencil, a l t h o u g h laboratory a n d other m a n i p u l a t i v e skills are sometimes required. T h e y are often e m b e d d e d i n the c u r r i c u l u m a n d require m o r e time to a d -minister, b u t proponents argue that the a d d i t i o n a l time is instructionally beneficial to students. O n e important aspect of such assessments is that they require expensive g r a d i n g b y panels of experts, u s u a l l y teachers. T h u s issues of costs versus benefits require close scrutiny ( H a r d y , 1995).
E l a b o r a t i o n of this issue requires some historical context. Performance (and portfolio) assessments g r e w out of the m o v e m e n t to u n d e r s t a n d a n d i m p r o v e classroom testing ( W i g g i n s , 1993). T h e y were seen as tools useful i n the class-r o o m , i n the h a n d s of teacheclass-rs w h o alclass-ready k n e w the students w e l l , a n d as " o n e m o r e piece of i n f o r m a t i o n " about the student. In this context they were p r o m o t e d a n d continue to be accepted as p o w e r f u l techniques, but as tech-niques m o r e of formative assessment a n d instruction than of s u m m a t i v e as-sessment. A s one tool i n the ongoing conversation between teacher a n d student, they were treated, b y and large rightly, as not subject to the require-ments of basic measurement principles. That is, w h e n c o u p l e d w i t h a d d i t i o n a l i n f o r m a t i o n about the student in the teacher's h a n d s , the danger of t a k i n g u n w i s e , especially s u m m a t i v e , action o n inaccurate i n f o r m a t i o n w a s m i n i -m i z e d .
Performance assessments were b o r r o w e d f r o m this w i t h i n c l a s s r o o m c o n -text b y the large-scale testing movement, a n d once r e m o v e d f r o m that con-text they lost their i m m u n i t y f r o m examination u s i n g the traditional canons of measurement (Bateson, 1993). In the e n s u i n g f e w years, a variety of technical concerns were raised: problems of l o w generalizability (Brennan & Johnson, 1995; G a o , Shavelson, & Baxter, 1994); score stability over time ( R u i z - P r i m o , Baxter, & Shavelson, 1993); and accuracy of i n d i v i d u a l a n d even g r o u p average scores ( C r o n b a c h , L i n n , Brennan, & Haertel, 1997).
w a s m i n i m a l . In s u m m a r y , the s w i t c h f r o m multiple-choice testing has s o l v e d some p r o b l e m s , but others have emerged, a n d the hoped-for benefits appear elusive. H e n c e cost benefit issues continue to be a concern.
A n o t h e r context i n w h i c h multiple-choice testing a n d performance assess-m e n t c a n be e x a assess-m i n e d are the questions of breadth versus d e p t h a n d instruc-tional utility. Large-scale multiple-choice testing p r o g r a m s have been suggested as able to y i e l d instructionally diagnostic i n f o r m a t i o n . H o w e v e r , if a multiplechoice test covers a substantial a m o u n t of c u r r i c u l u m , then the n u m -ber of items possible o n any topic is too s m a l l for reliable i n d i v i d u a l diagnosis of a specific difficulty.2 For example, a test b r o a d e n o u g h to cover the
mathe-matics c u r r i c u l u m for a n entire grade c o u l d not contain m o r e than a few items o n a n y t h i n g as specific as, say, a d d i t i o n of fractions, a l t h o u g h collection of items u n d e r a broader u m b r e l l a , perhaps i n v o l v i n g skills rather than content, w o u l d ameliorate this p r o b l e m . A l t h o u g h s u c h a subtest does not u s u a l l y contain e n o u g h items to be h i g h l y reliable at the i n d i v i d u a l level, supporters of s u c h tests argue that at the g r o u p (e.g., classroom) level, even a few items can p r o v i d e u s e f u l diagnostic i n f o r m a t i o n .
So if results f r o m a three-item subtest o n , again, a d d i t i o n of fractions s h o w sufficiently n a r r o w confidence intervals at the classroom level, the a r g u m e n t is that w e can d r a w conclusions about classroom performance o n this subtopic. The counterargument is that s u c h conclusions need to be limited specifically to performance o n the actual items used a n d not to a m o r e general category; that is, to a d d i t i o n of these three specific items rather than to a d d i t i o n of fractions i n general. T h i s seems to be the crux of the breadth-depth issue w i t h respect to large-scale multiple-choice tests of the type described a n d of their potential for instructional diagnosis.
The p u r p o s e of this s t u d y w a s to examine the potential benefit of perfor-mance assessments i n p r o v i d i n g g r o u p - l e v e l instructional diagnosis. Scoring systems t y p i c a l l y u s e d i n performance assessments d o not offer the seductive lure of great specificity, for example, a d d i t i o n of fractions. Instead, designers of performance assessments ask scorers to a p p r o a c h student w o r k f r o m a variety of perspectives. F o r example, the O n t a r i o assessment system u n d e r e x a m i n a -tion p r o d u c e s a score for each of three k n o w l e d g e / s k i l l categories, Understand-ing, ApplyUnderstand-ing, a n d CommunicatUnderstand-ing, o n a 4-point scale.
In the rationale for this analysis, w e used a l i m i t e d d e f i n i t i o n of diagnosis. In k e e p i n g w i t h G i p p s , B r o w n , M c C a l l u m , a n d M c A l i s t e r (1995), w e recognize that f e w teachers, especially g o o d teachers, are particularly s u r p r i s e d b y the results of large-scale assessments. Teachers tend to k n o w w h i c h students are d o i n g w e l l a n d w h i c h are d o i n g less w e l l . O u r definition of diagnosis focuses o n those students w h o s h o w u n e v e n (contoured, i n o u r terminology) rather than even (flat) achievement profiles. O u r a r g u m e n t is that large-scale assess-m e n t scores are assess-most useful to teachers w h e n they s h o w different levels of skill i n different categories of outcomes. In effect o u r c l a i m is that a flat profile tells a teacher n o t h i n g the teacher d i d not already k n o w , a n d if large-scale assess-m e n t is to contribute to u n d e r s t a n d i n g of the student's achieveassess-ment, it w i l l be m o r e likely to occur w h e n the profile is contoured.
for C o m m u n i c a t i n g ) . O u r argument is that, a l t h o u g h flat profiles (111, 222,333, 444) reveal each student's general level of performance, they d o not p r o v i d e differentially diagnostic i n f o r m a t i o n (i.e., a pattern of relative strengths a n d weaknesses). O n the other h a n d , a pattern such as 112 reveals a relative strength i n one area (in this case, C o m m u n i c a t i n g ) . O u r analysis focuses o n these c o n t o u r e d profiles, l o o k i n g f o r classroom-level patterns i n relative strength a n d weakness. W e explore w a y s to examine trends (i.e., n u m b e r s of students i n a class s h o w i n g the same relative strength o r weakness) a n d d i v e r -sity (i.e., classrooms w i t h a n u m b e r of students s h o w i n g strength i n a n area, a n d a n u m b e r of students s h o w i n g weakness i n the same area).
T w o different aspects of these classroom vectors can be e x a m i n e d , o v e r a l l trend a n d internal d i v e r s i t y . If a teacher has a large n u m b e r of students w i t h weakness i n A p p l y i n g , a n d a s m a l l n u m b e r w i t h strength i n A p p l y i n g , then there is a clear trend that the teacher can try to deal w i t h at the classroom level. H o w e v e r , if a teacher has a n u m b e r of students w i t h weakness i n A p p l y i n g , a n d a s i m i l a r n u m b e r w i t h strength i n A p p l y i n g , then there is some serious diversity that w i l l require considerably more i n d i v i d u a l i z a t i o n a n d be m u c h m o r e difficult to deal w i t h . A l t h o u g h all g o o d teachers engage i n i n d i v i d u a l i z a -tion, o u r concern is to shed light o n the extent to w h i c h it is necessary. W e sought w a y s to examine each of these situations separately.
W e d o w n p l a y the fact that a pattern of 111 tells a teacher s o m e t h i n g dif-ferent than a pattern of 333 o n the g r o u n d s that this is s o m e t h i n g the teacher w a s m o r e p r o b a b l y already aware of a n d that s u c h flat patterns d o not p r o v i d e the teacher w i t h diagnostic i n f o r m a t i o n o n differences i n relative strengths a n d weaknesses. T h e d o w n s i d e of o u r decision is that patterns s h o w i n g the same relative strength are treated the same (e.g., 112, 223, 334 a l l s h o w a relative strength i n C o m m u n i c a t i n g ) , setting aside the i n f o r m a t i o n c o n v e y e d b y the overall levels of performance.
The designers of external tests are a l w a y s clear that scores o n i n d i v i d u a l s s h o u l d n o t be used i n the absence of other i n f o r m a t i o n about the student, a position that h o l d s as w e l l for performance assessment as for any other assess-ment ( C r o n b a c h et al., 1997; Shavelson, Baxter, & G a o 1993). S o w e address o u r questions p r i m a r i l y at the classroom level of data aggregation, a n d tangentially at the i n d i v i d u a l level as w e aggregate the data.
A l t h o u g h there is a s m a l l literature o n profile analysis, it does n o t address performance assessment. The more c o m m o n definition of a profile arises f r o m a test battery context i n w h i c h scores f r o m test components are c o m p a r e d (Mehrens & L e h m a n n , 1991; Sax, 1997). The literature offers little discussion of the use of profiles i n interpreting assessment data. H i l l s (1993) briefly discusses pitfalls often o c c u r r i n g i n profile interpretation, a n d several studies have a d -dressed m e t h o d s to estimate the reliability of a profile of measures (Rae, 1991; Y a r n o l d , 1984). H o w e v e r , w e have been unable to locate any discussion of the extent to w h i c h profiles p r o v i d e differentially diagnostic i n f o r m a t i o n at the student, class, or higher level.
reliability of i n d i v i d u a l profiles, g r o u p results are more reliable, a n d w e take a pattern s h o w i n g m a n y students i n a class w i t h the same strength or deficit as h a v i n g potential diagnostic value.
S o m e brief caveats are i n order. First, w e recognize the benefits of i n -d i v i -d u a l stu-dent test score i n f o r m a t i o n use-d i n conjunction w i t h everything else the teacher k n o w s about the student, even t h o u g h score reliability m i g h t not be a l l that is h o p e d for. W e also recognize that g o o d teachers always make a n attempt to i n d i v i d u a l i z e , even t h o u g h o u r focus is o n g r o u p instructional diagnosis. Further, it is not o u r intention to deal w i t h the substance of remedia-tion of difficulties. O u r focus is o n the presence a n d m a g n i t u d e of differential patterns i n the achievement results o n l y . F i n a l l y , this analysis is exploratory; one of o u r goals is to u n c o v e r alternative w a y s of l o o k i n g at the data.
Data
In the s p r i n g of 1997 the O n t a r i o E d u c a t i o n Q u a l i t y a n d A c c o u n t a b i l i t y Office ( E Q A O ) a d m i n i s t e r e d to a l l 130,000 grade 3 students i n the province a t w o -w e e k c u r r i c u l u m - e m b e d d e d assessment that p r o d u c e d several scores i n each of r e a d i n g , w r i t i n g , a n d mathematics. T h e scores f o r mathematics are ex-a m i n e d i n this s t u d y . Eex-ach student received ex-a n overex-all mex-athemex-atics score. In a d d i t i o n scores were reported for the f o l l o w i n g three k n o w l e d g e / s k i l l catego-ries, U n d e r s t a n d i n g , A p p l y i n g , a n d C o m m u n i c a t i n g ( U , A , a n d C ) a n d for the f o l l o w i n g five content strands: N u m e r a t i o n , G e o m e t r y , Measurement, Pattern-i n g , a n d D a t a M a n a g e m e n t .
Performance o n each category a n d strand w a s reported u s i n g a four-point anchored scale. F o r example, the four points for the example k n o w l e d g e / s k i l l category Applying procedures were:
• 1—shows basic application of some procedures i n attempting some simple tasks;
• 2 — s h o w s some application of procedures to complete simple tasks w i t h accuracy;
• 3 — s h o w s regular application of procedures to complete tasks w i t h accuracy; a n d
• 4 — s h o w s regular a p p l i c a t i o n of a wide variety of complex procedures to p r o d u c e accurate and complex responses.
F o r the descriptions of the four levels of the G e o m e t r y a n d spatial sense strand, the levels were:
• 1—shows basic geometry concepts and procedures i n some simple tasks; • 2 — s h o w s some required geometry concepts and procedures i n simple tasks; • 3 — s h o w s required geometry concepts and procedures to complete tasks of
some complexity with accuracy; a n d
• 4 — s h o w s , beyond what is required, a variety of geometry concepts and procedures to complete complex tasks accurately.
Method and Results
The analysis w a s c o m p l e t e d i n several stages, w i t h the procedures of each subsequent stage dependent o n the results of the p r e v i o u s stage. T h u s the results are presented together w i t h the m e t h o d for each stage of the analysis.
Formation of Individual Score Vectors
The first step i n e x a m i n i n g the scores w a s to combine each student's set of three scores for U n d e r s t a n d i n g , A p p l y i n g , a n d C o m m u n i c a t i n g i n mathematics into a single 3-digit vector described earlier. A m i s s i n g value o n a n y of the three resulted i n a m i s s i n g v a l u e for the vector.
D a t a f r o m 120,315 grade 3 students were then s u m m a r i z e d , revealing that 69.3% of the students h a d flat profiles (approximately 13%, 32%, 21%, a n d 3 % at each of levels 1 t h r o u g h 4); another 30.5% h a d contoured profiles consisting o n l y of adjacent values (e.g., 434, 112). O n l y 0.22% (265 students) h a d un-balanced profiles consisting of either nonadjacent n u m b e r s (e.g., 313) o r three different n u m b e r s (e.g., 423). I n a l l , 47 of the 64 (43) possible combinations
appeared i n the data. N o students h a d both Is a n d 4s.
In o r d e r to m o v e f r o m the i n d i v i d u a l to the classroom level, w e needed some d e c i s i o n rules. A n y classroom-level differential patterning that m i g h t be gleaned f r o m the i n d i v i d u a l vectors lay i n the 30% of cases that h a d contoured profiles, rather than the large n u m b e r w i t h flat profiles o r the trivially s m a l l n u m b e r w i t h u n b a l a n c e d profiles. A l l flat profiles were c o d e d as 0, a n d the few u n b a l a n c e d profiles were treated as m i s s i n g data. T h e r e m a i n i n g contoured profiles w e r e categorized as s h o w i n g either a relative strength (one category u p , t w o d o w n ) o r relative weakness (two categories u p , one d o w n ) i n a catego-ry. U s i n g this system, 99.8% of the students c o u l d be classified into one of seven i n d e p e n d e n t categories, flat or 0 ( w h i c h w a s n o t used i n the analysis), p l u s these six:
• + U , strength i n u n d e r s t a n d i n g (211,322,433); • - U , weakness i n u n d e r s t a n d i n g (122,233,344); • + A , strength i n applications (121,232,343); • - A , weakness i n applications (212,323,434); • +C, strength i n c o m m u n i c a t i n g (112 223,334); a n d • - C , weakness i n c o m m u n i c a t i n g (221,332,443).
N o t e again that the c o d i n g for each student is independent of the student's overall performance i n that, for example, 443 a n d 221 are treated the same, relatively w e a k i n C o m m u n i c a t i n g .3 W e then f o r m e d a classroom profile
con-sisting of a vector of seven n u m b e r s , each representing the n u m b e r of students i n each c l a s s r o o m i n each of the categories 0, + U , - U , +A, - A , +C, a n d - C .
Construction of Classroom Vectors
decision to eliminate smaller classes w o u l d thus eliminate a disproportionate share of the students i n split classes. There seems g o o d reason to suspect that patterns of achievement of students i n straight grade 3 classes, 2-3 splits, a n d 3-4 splits m i g h t be systematically different, so w e decided to keep all the classes. H o w e v e r , the procedures described b e l o w are m u c h m o r e likely to reveal patterns i n larger classes than i n smaller.
T o get a general u n d e r s t a n d i n g of o u r data distribution, w e s u m m e d the n u m b e r of c o n t o u r e d profiles so that w e h a d for each class a n u m b e r of flat profiles (0) a n d a n u m b e r of contoured profiles (categories +U, - U , +A, - A , +C, a n d - C a d d e d together). Table 1 s h o w s a cross-tabulation of these n u m b e r s . F o r example, i n the top left entry, 89 classes h a d 0-2 students w i t h flat profiles a n d 0-2 students w i t h contoured profiles. A g a i n , almost i n the center of the table, 205 classes have 1516 students w i t h flat profiles a n d 78 students w i t h c o n -toured profiles. W i t h i n the limits of o u r category w i d t h s , every class size4 i n the
p r o v i n c e can be read f r o m Table 1. The b o d y of Table 1 has been b r o k e n into nine regions for ease of discussion.
C o n s i d e r first the c o l u m n o n the left. F r o m the c o l u m n totals, 44.8% of the classrooms have four or fewer contoured profiles o n w h i c h to base a search for differentially diagnostic i n f o r m a t i o n . T h e classrooms i n the first r o w are smaller, v a r y i n g i n size f r o m one to 14. Further, although they contain a substantial proportion of students w i t h contoured profiles, there is little l i k e l i h o o d of f i n d i n g diagnostic i n f o r m a t i o n i n data f r o m these classes. There s i m p l y are not e n o u g h contoured profiles i n the classes i n the first r o w to s h o w a pattern. Those classes i n the second a n d t h i r d r o w s (left h a n d column) are larger. U n l i k e the first r o w , the p r o p o r t i o n of contoured profiles is s m a l l . C o n s e q u e n t l y , like the classes i n the first r o w , there is little chance of uncover-i n g duncover-iagnostuncover-ic uncover-i n f o r m a t uncover-i o n .
T h e right c o l u m n of Table 1 contains the classes w i t h the largest n u m b e r s of c o n t o u r e d profiles. A s s h o w n b y the s u m of the s u b c o l u m n totals, 5.9% of the classrooms have at least 11 students w i t h a contoured profile. The first a n d t h i r d r o w s are essentially e m p t y . In contrast, the n u m b e r of classrooms i n the second r o w is large, a n d the chances of f i n d i n g potentially diagnostic i n f o r m a -tion i n these classes are excellent. There are e n o u g h contoured profiles that, w h e n w e break t h e m d o w n b y the three categories of U n d e r s t a n d i n g , A p p l y -ing, a n d C o m m u n i c a t i n g (our next step), useful patterns are likely.
The m i d d l e c o l u m n of Table 1 includes 49.1% of the classes. Those i n the top r o w , some 800 or 12% of classes, offer the best chance of f i n d i n g diagnostic i n f o r m a t i o n , b u t the m i d d l e g r o u p , w i t h about one t h i r d of students s h o w i n g a c o n t o u r e d profile, also s h o w p r o m i s e . The bottom g r o u p , w i t h some 300 clas-ses, has a smaller p r o p o r t i o n of contoured profiles, a n d thus less chance of f i n d i n g diagnostic i n f o r m a t i o n .
Table 1
Numbers of Classes at Combinations of Flat and Contoured Profiles
Contoured 0-2 3-4 5-6 7-8 9-10 11-12 13-14 15-16 Total Total
Flat %
0-2 89 49 10 3 0 0 0 0 236 3.3
3-4 258 173 49 13 1 1 0 0 495 7.1
5-6 312 251 109 35 7 1 1 0 716 10.2
7-8 271 262 180 56 18 8 1 0 796 11.4
9-10 169 245 175 75 88 12 7 0 732 10.5
11-12 109 173 181 117 121 54 12 5 730 10.5 13-14 75 134 158 172 48 66 20 6 751 10.8 15-16 38 97 165 205 166 70 19 5 765 10.9 17-18 21 92 206 235 134 64 8 1 761 10.9
19-20 11 92 161 170 93 32 6 0 565 8.1
21-22 8 54 85 79 38 7 2 0 273 3.9
23-24 6 39 44 25 6 2 0 0 122 1.7
25-26 3 8 8 3 1 0 0 0 23 .4
27-28 1 9 2 1 0 0 0 0 13 .2
Total 1,454 1,678 1,534 1,189 711 317 76 17 6,978 100 Total % 20.8 24.0 21.9 17.1 10.1 4.6 1.1 .2 100
Classroom Indices of Strength and Weakness
The next step i n the analysis m o v e d b e y o n d aggregates of contoured profiles to the specifics of relative strengths a n d weaknesses. A l t h o u g h the analysis c o m -i n g o u t of T a b l e 1 m -i g h t suggest that further w o r k focus o n o n l y a subset of classrooms, because this is a n exploratory examination w e decided to proceed w i t h a l l classes.
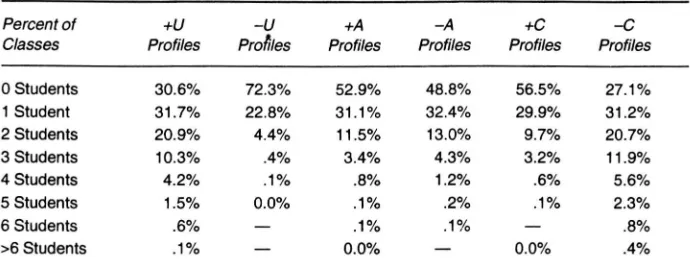
Table 2 s h o w s percentages of classes as a function of n u m b e r s of class m e m b e r s w i t h each of the six possible contoured profiles. F o r example, the + U c o l u m n gives i n f o r m a t i o n for profiles strongest i n U n d e r s t a n d i n g : 211, 322, o r 433. Some 3 0 % of classes have n o s u c h students, whereas about 16% have three or m o r e s u c h students. Table 2 reflects the fact that overall achievement is highest i n U n d e r s t a n d i n g a n d lowest i n C o m m u n i c a t i n g . M o r e than half the classes h a v e n o students at a l l w i t h a profile s h o w i n g relative strength i n C o m m u n i c a t i n g (112,223, or 334), whereas one quarter of classes have three o r m o r e students w i t h a relative weakness i n C o m m u n i c a t i n g (221, 332, 443). These differences are quite large w h e n v i e w e d i n the context that o n l y 30.5% of the students h a v e c o n t o u r e d profiles.
Seeking Trends
Table 2
Percentages of Classes Containing Numbers of Students with Each Indicator
Profile
Percent of +U -U +A -A +C -C
Classes Profiles Profiles Profiles Profiles Profiles Profiles
0 Students 30.6% 72.3% 52.9% 48.8% 56.5% 27.1%
1 Student 31.7% 22.8% 31.1% 32.4% 29.9% 31.2%
2 Students 20.9% 4.4% 11.5% 13.0% 9.7% 20.7%
3 Students 10.3% .4% 3.4% 4.3% 3.2% 11.9%
4 Students 4.2% .1% .8% 1.2% .6% 5.6%
5 Students 1.5% 0.0% .1% .2% .1% 2.3%
6 Students .6% — .1% .1% — .8%
>6 Students .1% — 0.0% — 0.0% .4%
w a s assigned a 3-element vector ( A U , A A , A C ) based o n the contoured profiles o n l y .
F o r e x a m p l e , consider a classroom of 22 students, containing 12 students w i t h flat profiles a n d 10 w i t h contoured profiles, g i v i n g a total class distribu-tion of (0, + U , - U , +A, - A , +C, - C ) = (12, 4, 2, 1, 0, 1, 2). O n conversion to a 3-digit profile, this becomes (2,1, -1), m e a n i n g that i n this class there are slight trends to relatively h i g h scores o n U n d e r s t a n d i n g a n d A p p l i c a t i o n a n d rela-tively l o w scores o n C o m m u n i c a t i o n . That is, students w i t h relative strength i n U a n d A o u t n u m b e r those w i t h relative weakness, w h i l e those w i t h relative weakness i n C o u t n u m b e r students w i t h relative strength.
P r e l i m i n a r y investigation of patterns a m o n g these 3-digit classroom vectors revealed that positive A U s tended to go w i t h negative A C s a n d vice versa. That is, classes that h a d relative strength i n C o m m u n i c a t i n g h a d relative weakness i n U n d e r s t a n d i n g . The A A values tended to be less variable; about one third of classes h a d A A = 0 (equal n u m b e r s of +A a n d - A students) a n d o n l y 16% h a d A A > 2 or < - 2 .5 There is little variability i n the relative strength or weakness i n
A p p l i c a t i o n at the class average level. W e therefore decided to focus o u r attention o n the relationship between U n d e r s t a n d i n g a n d C o m m u n i c a t i n g .
Table 3 s h o w s the cross-tabulation of A U versus A C . N e g a t i v e A C values were observed for 55.9% of classrooms, i n d i c a t i n g that there was at least one m o r e student w i t h a weakness i n C o m m u n i c a t i n g (221, 332, 443) than w i t h a strength. O f these classrooms, 35.2% possessed a relative strength i n U n d e r -s t a n d i n g . O n the right h a n d -side, 15% of cla-s-sroom-s have a relative -strength i n C o m m u n i c a t i n g , a n d one eighth of these, almost 2% of the entire set, also have a relative weakness i n U n d e r s t a n d i n g . There appears to be the potential for d r a w i n g useful classroom-level instructional implications f r o m these data.6
Seeking Diversity
Table 3
Cross-tabulation, Percentages of Classrooms by AU and AC
AC<0 AC = 0 AC>0 Total
4.7% 2.5% 1.8% 8.9%
A U < 0
AU = 0 16.1% 10.8% 4.8% 31.6%
A U > 0 35.2% 15.6% 8.6% 59.4%
Total 55.9% 28.9% 15.1% 100.0%
taken a n d s u m m e d across all three scores. For example, w i t h 22 students i n a classroom, the values (12,4, 2 , 1 , 0 , 1 , 2) yield 2 + 0 + 1 = 3 ; that is, m i n (4, 2) + m i n (1, 0) + m i n (1, 2). This value p r o v i d e s a measure of diversity i n the classroom.
T h e p r i n c i p l e b e h i n d this measure is simple. C o n s i d e r pairs of elements for +U a n d - U f r o m t w o different classrooms (4, 2) versus (2, 0). Both y i e l d a A U score of +2, i n d i c a t i n g t w o m o r e students w i t h relatively h i g h scores o n U n d e r -standing. H o w e v e r , i n the first case the teacher m u s t contend w i t h four stu-dents relatively strong i n U n d e r s t a n d i n g a n d t w o relatively weak, whereas i n the second case the teacher has n o students relatively w e a k i n U n d e r s t a n d i n g . The t w o d i v e r s i t y scores of +2 a n d 0 reflect this difference. O n e of these t w o teachers is faced w i t h considerably more i n d i v i d u a l i z a t i o n .
The d i v e r s i t y scores for all classes are reported i n Table 4.7 A l t h o u g h w e
cannot determine whether this analysis has uncovered classes w i t h h i g h l y divergent student p o p u l a t i o n s , about 25% of classes have a diversity measure of 2 or larger. These classes are more likely to require greater i n d i v i d u a l i z a t i o n o n the part of the teacher.
A skeptical v i e w of the above is that w e have ignored reliability issues a n d , even w o r s e , relied h e a v i l y o n differences between unreliable numbers. W e have m a d e classroom-level recommendations based o n data f r o m an u n k n o w n subset of the classroom members w h o d i d not have flat profiles. This m a y be true, a n d it can be e x a m i n e d , at least o n a case basis. W e isolated i n d i v i d u a l profiles f r o m the m e m b e r s of three classes, chosen n o n r a n d o m l y , i n an attempt to e x e m p l i f y the a p p r o a c h .
The first class comes f r o m the subsample of classes w i t h positive A U a n d negative A C values (third r o w , first c o l u m n , Table 3). In this class 28 students h a d 15 flat profiles, 11 h a d contoured profiles, and t w o students d i d not r e s p o n d to a sufficient p o r t i o n of the assessment to be g i v e n scores o n w h i c h to base o u r indices. The b r e a k d o w n is as follows:
• the flat profiles are four at level 2,10 at level 3, a n d one at level 4; • there are n o cases of +A, - A , +C or - U ;
• there are three cases of +U, t w o at 433 and one at 322; • there are eight cases of - C , five at 332 a n d three at 221.
Table
4
Frequencies and Percentages of Classes at each Diversity Level
Diversity Measure Number of Classes Percent of Classes
0 3,003 43.0
1 2,216 31.8
2 1,152 16.5
3 426 6.1
4 148 2.1
5 28 .4
6 5 .1
a relative strength i n C o m m u n i c a t i n g . G r o u p i n s t r u c t i o n a l implications, a l -t h o u g h a d m i -t -t e d l y general, are rela-tively clear.
The second example classroom comes f r o m the s m a l l n u m b e r of classrooms w i t h negative A U a n d positive A C (first r o w , t h i r d c o l u m n , Table 3). There are 15 flat profiles a n d eight contoured i n the class. The b r e a k d o w n is as f o l l o w s : • the flat profiles are three at level 2,10 at level 3, a n d t w o at level 4; • there are n o cases of +A, - A or - C ;
• there is one case of +U, 433, a n d four cases of - U , t w o at 233 a n d t w o at
344-J i t /
• there are three cases of +C, one at 223 a n d t w o at 334.
A g a i n , this appears to be a h i g h - a c h i e v i n g class. In classrooms like this, g r o u p instructional implications are not so clearcut. The n u m b e r of students i d e n -tified as h a v i n g a relative weakness i n u n d e r s t a n d i n g is smaller a n d balanced b y one student w i t h a relative strength.
T h e t h i r d example classroom comes f r o m the s m a l l g r o u p of classrooms w i t h h i g h d i v e r s i t y scores, as s h o w n i n the sixth r o w of Table 4. In this last class there are 30 students; 11 have flat profiles, 18 have contoured profiles, a n d one student's score is m i s s i n g . The b r e a k d o w n is as f o l l o w s :
• the flat profiles are five at each of levels 2 a n d 3, a n d one at level 4; • a l l six possibilities of contoured profiles exist;
• there are four cases of - U (233), balanced w i t h one case of +U, 322; • there five cases of - A , one at 212, three at 323, a n d one at 434, balanced b y
one case of +A at 232;
• there are four cases of - C , three at 332 a n d one at 443, balanced b y three cases of +C t w o at 223 a n d one at 334.
N o t o n l y is this a h i g h l y diverse class, b u t it is also o n average m u c h l o w e r a c h i e v i n g than the p r e v i o u s t w o examples. A l t h o u g h there are n o s i m p l e diagnostic prescriptions for a class like the example class, the data give a clear signal that considerable i n d i v i d u a l i z a t i o n w o u l d be required.
Strands
s i m i l a r l y converted into a 5-digit vector so that, for example, a vector of 32334 meant that a student h a d 2 o n G e o m e t r y , 4 on Data M a n a g e m e n t , a n d 3s o n each of N u m e r a t i o n , M e a s u r e m e n t , a n d Patterning. In this case 498 of the 1,024 (45) possible c o m b i n a t i o n s appeared i n the data.
A g a i n , a m i s s i n g v a l u e o n any strand resulted i n a m i s s i n g value o n the overall vector. W i t h five rather than three scores required for the content strand, there were m o r e cases of m i s s i n g data for the content strands, 9.1% versus 7.1%.
In total, 117,706 students y i e l d e d complete data. O f these, 31.6% h a d flat profiles (e.g., 22222), a n d another 61.9% h a d profiles consisting of adjacent values o n l y , s u c h as 22333 or 43444. The r e m a i n i n g 6.5% of students h a d unbalanced profiles. W i t h five pieces of i n f o r m a t i o n to w o r k f r o m rather than three, o u r d e c i s i o n rules h a d to be different a n d more complex.
Coding the Strands
A n i m p o r t a n t difference between the 3-digit k n o w l e d g e / s k i l l vectors a n d the 5-digit content vectors is that i n the first case, each student c o u l d be classified into one of o n l y seven independent categories. F o l l o w i n g the same procedure w i t h the 5-digit strands was not possible, as w e needed to a l l o w for the possibility of strength or weakness i n more than one strand. W e decided to categorize each student as relatively strong, average, or weak (+1, 0, or -1) on each of the five strands a n d then to examine each strand i n t u r n rather than all of t h e m together as i n the a p p r o a c h for the skill categories.
O u r p r o c e d u r e is illustrated u s i n g the second position i n the 5-element vector, but o u r argument is s y m m e t r i c a l for all five strands. C o n c e p t u a l l y , our p r o c e d u r e compares each strand score to the m e a n of the other four, a l t h o u g h w e actually w o r k e d b y c o m p a r i n g four times each score w i t h the total of the other four. C o n s i d e r the t w o cases 34333 a n d 44333. W e w a n t each of these to result i n a +1 for the second content strand Geometry. That is, if a strand has the highest score i n the vector, even if tied w i t h one other strand, o u r methods s h o u l d give a positive value. F o u r times the G e o m e t r y score, 16, is a l w a y s greater b y at least 3 than the s u m of the r e m a i n i n g four strands, w h i c h w i l l have a m a x i m u m of 13. The s u m of the r e m a i n i n g four is 13 for 44333, 12 for 34333, a n d less if any of the 3s are changed to a l o w e r score. The argument is parallel for 33222 a n d 22111. If w e h a d 44334, then this case w o u l d be scored -1 for the third a n d fourth strands, and 0 for the other three. The rule for a score of +1, then, is that four times the strand score m u s t exceed the s u m of the other four strands by 3 or more.
Table 5
Frequencies of Classes by Numbers of Geometry Scores
+1 -1
0 1-2 3-4 5-6 7-8 9-10 Total
0 595 760 220 51 13 1 1,642
1-2 969 1,545 593 142 74 4 3,276
3-4 412 750 291 60 3 1 1,517
5-6 118 214 62 9 1 404
7-8 38 55 8 1 102
9-10 17 11 29
11-12 1 1 1 3
Total 2,152 3,336 1,176 263 40 6 6,973
A t the i n d i v i d u a l level, 9% of students have a relative weakness i n G e o m e t r y (-1 as described above) a n d 11% of cases s h o w a relative strength (+1) . T h e r e m a i n i n g 80% of students receive a v a l u e of 0 a c c o r d i n g to the a l g o r i t h m a n d thus are d e e m e d to have a n achievement level i n G e o m e t r y close to their overall achievement.
T o investigate the distribution of these cases across classrooms, w e counted the n u m b e r of cases of +1 a n d - 1 scores i n G e o m e t r y i n each class a n d tabulated these n u m b e r s i n Table 5. W i t h o n l y 20% of the students h a v i n g a n o n z e r o score i n G e o m e t r y , about 10% of classes have n o students at all w i t h scores of either +1 o r - 1 i n G e o m e t r y . A p a r t f r o m this g r o u p , the t o p left h a n d corner of Table 5, about 1,000 classes (the top r o w ) have clear strengths i n geometry, a n d another 1,500 classes (left h a n d c o l u m n ) have clear weaknesses.
In general, classes o n the right h a n d side of the table have strengths i n G e o m e t r y , a n d those t o w a r d the b o t t o m of the table have weaknesses. A s w e m o v e i n t o the center of the table, a n d especially t o w a r d the b o t t o m right (where, h a p p i l y , there are f e w classes), w e find the classes w i t h h i g h diversity. C l e a r l y the content strand data reveals potential for y i e l d i n g diagnostic infor-m a t i o n .
Summary
T h i s is a p r e l i m i n a r y attempt to d e v e l o p m e t h o d o l o g y to identify classroom-level patterns i n student profiles. T h e analysis w a s based o n c o n s i d e r i n g each student's score i n relation to his o r her other scores i n the set. In the set of three k n o w l e d g e / s k i l l scores, some systematic patterns c o u l d be f o u n d at the class-r o o m level. In the set of five content stclass-rand scoclass-res, classclass-room-level diffeclass-rences i n relative strength were f o u n d i n one example strand.
Further w o r k o n the content strands is p l a n n e d . Patterns of strength a n d weakness i n combinations of content areas n e e d to be e x a m i n e d , a n d levels of error need to be discussed.
Notes
1. This point can be debated.
3. Other decisions could have been made. For example, data from lower-achieving students could be given more importance, or relative weaknesses could be treated as more important than relative strengths. One could also choose to take into account the level of the flat profiles. 4. For split classes we have included only the number of grade 3 students.
5. The question of whether some of these AAs of 0 consist of a +A of, say, 6 and a - A of 6 is addressed below when we discuss diversity. Briefly, the answer is no; almost 98% of classes have both +A and - A A 3.
6. Table 2 reports data for schools at all levels of AA. To examine the possibility of different patterns at different levels of AA, we repeated the analysis for schools at each of the five levels of AA separately. With minor exceptions results were parallel to Table 2.
7. The diversity index reported is in the spirit of exploratory data analysis. However, we also calculated traditional within-class variances on the student-level raw data. The two approaches correlate 0.93.
8. This algorithm is not perfect. It gives counterintuitive results in extreme cases such as 41111. Refinements of the algorithm are being considered for further work.
Acknowledgment
We wish to thank the Education Quality and Accountability Office for access to the data for this report.
References
Bateson, D. (1993). Psychometric and philosophic problems in "authentic" assessment: Performance tasks and portfolios. Alberta Journal of Educational Research, 40,233-245. Black, P.J. (1994). Performance assessment and accountability: The experience in England and
Wales. Educational Evaluation and Policy Analysis, 16,191-203.
Brennan, R.L., & Johnson, E.G. (1995). Generalizability of performance assessments. Educational
Measurement: Issues and Practice, 14(4), 9-12.
Cannell, J.J. (1988). Nationally normed elementary achievement testing in America's public
schools: How all 50 states are above the national average. Educational Measurement Issues and
Practice, 7(2), 5-9.
Cronbach, L.J., Linn, R.L., Brennan, R.L., & Haertel, E.H. (1997). Generalizability analysis for performance assessments of student achievement or school effectiveness. Educational and
Psychological Measurement, 57,373-399.
Firestone, W.A., Mayrowetz, D., & Fairman, J. (1998). Performance-based assessment and
instructional change: The effects of testing in Maine and Maryland. Educational Evaluation and
Policy Analysis, 20,95-113.
Gao, X., Shavelson, R.J., & Baxter, G.P. (1994). Generalizability of large-scale performance
assessments in science: Promises and problems. Applied Measurement in Education, 7,323-342. Gipps, C , Brown, M . , McCallum, B., & McAlister, S. (1995). Intuition or evidence? Milton Keynes,
UK: Open University Press.
Hardy, R.A. (1995). Examining the costs of performance assessment. Applied Measurement in
Education, 5(2),121-134.
Hills, J.R. (1993). Interpreting profiles. Educational Measurement: Issues and Practice, 12(4), 26,32-33. Madaus, G.F. (1991). The effects of important tests on students. Phi Delta Kappan, 72,226-231. Mehrens, W.A., & Lehmann, I.J. (1991). Measurement and evaluation in education and psychology (4th
ed.). Toronto, O N : Holt, Rinehart & Winston.
Moore, W.P. (1994). The devaluation of standardized testing: One district's response to a mandated test. Applied Measurement in Education, 7,343-367.
National Commission on Testing and Public Policy. (1990). From gatekeeper to gateway:
Transforming testing in America. Boston, M A : National Commission on Testing and Public
Policy, Boston College.
Rae, G. (1991). Another look at the reliability of a profile. Educational and Psychological
Measurement, 51,89-93.
Ruiz-Primo, M.A., Baxter, G.P., & Shavelson, R.J. (1993). On the stability of performance assessments. Journal of Educational Measurement, 30, 41-53.
Sax, G. (1997). Principles of educational and psychological measurement and evaluation (4th ed.). Toronto, O N : Wadsworth.
Shavelson, R.J., Baxter, G.P., & Gao, X. (1993). Sampling variability in performance assessment.
Shepard, L.A., Flexer, R.J., Hiebert, E.H., Marion, S.F., Mayfield, V., & Weston, T.J. (1996). Effects of introducing classroom performance assessments on student learning. Educational
Measurement: Issues and Practice, 15(3), 7-18.
Wiggins, G. (1993). Assessing student performance: Exploring the purpose and limits of testing. San Francisco, CA: Jossey-Bass.