Simulation and Control of Spray Drying Using
Nozzle Atomizer Spray Dryer
L.W. Tan, F.S. Taip
*, N. Abdul Aziz
Abstract-- S pray drying is a commonly used method of drying a liquid feed through a hot gas. This study aims to obtain the empirical model of the spray drying process of full cream milk using a nozzle atomizer spray dryer, Lab-Plant S D 05 Laboratory S cale S pray Dryer. Inlet air temperature was chosen as the manipulated variable and outlet air temperature was the controlled variable. No disturbance was considered in this process. The model was obtained from empirical model development and it can be represented using first order plus time delay (FOPTD). The empirical dynamic model of the spray drying of full cream milk was simulated using S IMULINK to evaluate the performance and robustness. The PI and PID controllers were applied to implement the control strategies of the process. The effects of parameter uncertainties were investigated. From the observation, the direct synthesis tuning method has been found as a good controller tuning for both controllers in spray drying control system.
Index Term-- S pray drying, PID controller, simulation, process control
I.
I
NTRODUCTIONSpray drying is the transformation of fluid state or pasted material into dried particulate form by spraying the feed into a hot drying medium where the moisture is evaporated Error! Reference source not found. Error! Reference source not found.. Spray drying can forms a powdered spherical, granule or agglomerated product directly depending upon the physical and chemical properties of the feed, the dryer design and operation
Dr. F.S. T aip, PhD, is working as senior lecturer at Department of Process and Food Engineering, Faculty of Engineering, Universiti
Putra Malaysia, Malaysia. Her area of interest is in the field of Process Control and Food Process Engineering. She is the corresponding author. (Phone: +603 -89466357; Fax:
+603-86567123; email: [email protected])
Dr. N. Abdul Aziz, PhD, is a senior lecturer at Department of Process and Food Engineering, Faculty of Engineering, Universiti Putra Malaysia, Malaysia. Her major fields of research interests are Fouling and Cleaning and Mathematical Models for Processes (email:
L. W. T an received the B. Eng. in Universiti Putra Malaysia and currently pursues her M.Sc. in Food Engineering at Universiti Putra Malaysia, Malaysia. Her current research int erests include dynamic
modeling, simulation and controlling (email: [email protected]).
Error! Reference source not found.. Spray dryers represent the important unit operation and are widely used in the chemical, pharmaceutical and dairy indus tries where heat-sensitive materials have to be dried Error! Reference source not found.. In the dairy industry, this technology is the core component for the dried milk products production plant Error! Reference source not found.. In the food processing industry, one of the primary objectives of process control is to maintain the desired product quality. In spray drying process control system, the control of moisture content is the key to maintain the dried product’s quality. According to Error! Reference source not found., they found that on line measurement of dried product moisture content is difficult due to lack of robust sensors. Product moisture content is the most effective product parameter and could be influenced by operating parameters. The inlet air temperature is a major and important variable affecting the moisture content of the dried product Error! Reference source not found.. Increasing the inlet air temperature will decrease the moisture content of the dried product Error! Reference source not found.Error! Reference source not found..
The design of a good control system rests on appropriate understanding the dynamic behavior of the process. This requires the development of effective dynamic models. The steps in spray drying control system design include the selection of controlled and manipulated variables; selecting the control strategy and the specification of controller settings. Once the control system is installed, the controller settings need to be tuned; therefore the control system can perform satisfactorily Error! Reference source not found.. The dynamic model is never perfect because of errors in the model identification procedure. Changes of operating conditions affect the dynamic behavior of the feedback process and indirectly affecting the dried product quality.
and robustness are central themes in the field of process control Error! Reference source not found..
II.
M
ETHODOLOGYThe dynamic model studies were focused on nozzle atomizer spray dryer (Lab-Plant SD 05 Laboratory Scale Spray Dryer manufactured by L.P. Technology LTD, England). The full cream milk (UHT milk, manufactured from Dutch Lady, M alaysia) was used as a feed material. The spray dryer was controlled manually with constant feed flow rate. The control objective of spray dryer control system was to keep the outlet air temperature, Tout
(process output) at the set-point by manipulating the inlet air temperature, Tin(process input).
The data of step change in inlet air temperature which were obtained from experiment will be used as the main source for empirical model development. The control strategy used was feedback control system that involved PI and PID controllers and tuned by four tuning methods which were direct synthesis (M 1)
Error! Reference source not found., Rovira (M 2) Error! Reference source not found., Chidambaram (M 3) Error! Reference source not found. and Ziegler-Nichols (M 4) Error! Reference source not found.. M 1 is a model-based technique and it is recommended for control system design. M 2 is referred as a minimum error integral tuning. M 3 method is a simple method to design PI and PID controllers for stable FOPTD systems and M 4 is a classical method used as a preliminary design for designing PID controllers.
The performances of controller settings obtained by different tuning methods were analyzed by using step responses of the closed loop system and the overshoot, rise time, settling time (based on time required to reach ±5% of the steady state value) and integral error measures (integral of the absolute value of the error, IAE and integral of square of the error, ISE) were compared. The robustness of this control system was analyzed by comparing the relative stability metrics: gain margin (GM ) and phase margin (PM ). The effects of model uncertainties were evaluated by applying ±25% change from the process model nominal values.
III. RESULTS AND DISCUSSION
3.1 Dynamic of Empirical Model
An empirical model of Lab-Plant SD 05 Laboratory Scale Spray Dryer was developed by using the data of step change in inlet air temperature and plotted by using cftool in M ATLAB program. The spray dryer was controlled manually with constant feed flow rate. The predicted curve shows the first order plus time delay (FOPTD) model. The FOPTD model parameters can be obtained by graphic analysis of the process reaction curve. The process gain, Kp =2
which is determined by ratio of outlet air temperature changes to the inlet temperature change. Time delay, θ=1 minute, was determined as the intersection of the tangent with the maximum slope with the time axis. Time constant, τ=6.8 minutes, was determined as time at 63.2% of output process minus θ. The values of Kp, τ and θ are
substituted into the Equation (1) which shows the transfer function for FOPTD model. The obtained model is applicable since the
ratio
/
is 0.147, therefore the proposed existing tuning methods can be extrapolated.1 8 . 6 2 ) ( 1 s e s G s p
3.2 Simulation Studies
The simulation studies were done using SIM ULINK from M ATLAB software. For M 1 tuning method, the closed loop time constant, τc was the single tuning parameter to be selected. Several
values of τc were suggested in the literature. As a rule of thumb, τc=0.5τwas chosen. According to Error! Reference source not found., τc=0.25τ was suggested and Error! Reference source not found. proposed a suggested value with τc=θ. Table I showed the
values of tuning parameters obtained from M 1 usingM ATLAB Command for both PI and PID controllers. It can be concluded that the closed loop time constant, τc is inversely proportional to
controller gain, Kc. Other tuning parameters such as integral time, τI and derivative time, τD were not affected by τc.
The responses of closed loop process tuned by M 1 with different closed loop time constant, τc for both PI and PID controllers were
shown in Fig. 1. τc is user-specified parameter that corresponds to
closed loop speed of response. As τc decreased, Kc increased
causing the closed loop to become unstable. If a larger τc is
specified, the more sluggish response is expected. The choice of τc
is a key decision in M 1. Simulations were done to fine tune M 1 to obtain the best suggested value of τc for this particular process.
Based on the results, τc= θ was found to be the most suitable
value that achieved satisfactory performance for both PI and PID controllers. This can be seen in Fig. 1 where the output responses were the fastest with small overshoot.
TABLE I
TUNING PARAMETERS FOR PI AND PID CONTROLLERS TUNED BY M1
Closed loop PI controller PID controller
time constant, τc
Kc τI Kc τI τD
Fig. 1. T he process responses tuned by M1 for (a) PI controller and (b) PID controller
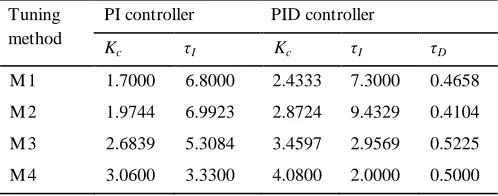
Four tuning methods were used to tune both types of controllers. As observed in Table II, the tuning parameters values obtained from these tuning methods for both PI and PID controllers. Table II showed integral time, τI was inversely proportional to controller gain, Kc. PI and PID controllers tuned by M1 and M2 had smaller controller gain,
Kc and larger integral time, τI corresponding to slower response. On the other hand, the controllers tuned by M3 and M4 had larger Kc and smaller τI therefore generally resulted in oscillatory response as expected.
TABLE II
TUNING PARAMETERS FOR PI AND PID CONTROLLERS TUNED BY
DIFFERENT TUNING METHODS
Tuning method
PI controller PID controller
Kc τI Kc τI τD
M 1 1.7000 6.8000 2.4333 7.3000 0.4658 M 2 1.9744 6.9923 2.8724 9.4329 0.4104 M 3 2.6839 5.3084 3.4597 2.9569 0.5225 M 4 3.0600 3.3300 4.0800 2.0000 0.5000
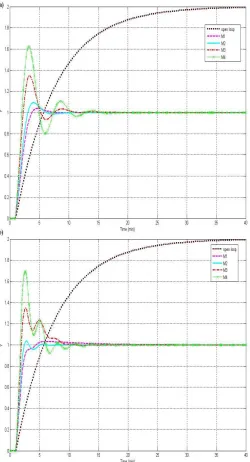
In Fig. 2, the open and closed loop responses due to step point change have been compared for this system. As expected,
the open loop response (without controller) did not reach set point and giving 100% offset. The closed loop processes (with controller) had desirable dynamic and steady state response characteristics. M 3 and M 4 resulted in oscillatory while M 1 and M 2 resulted in overdamped responses before reach steady state. Therefore, M 1 and M 2 can be considered as the suitable tuning methods to control both PI and PID controller for this spray drying control system. For controller strategies, PI controller gave more stable and less oscillatory response than PID controller because PI controller had smaller Kc and larger τI than PID
controller.
3.3 Performance Analyses
The output control performances of spray drying process with obtained FOPTD dynamics were analyzed and shown in Table III. . The well known performance criteria such as overshoot, rise time, settling time, IAE and ISE.
From Table III, it is observed that the overshoot (OS)
was proportional to settling time (ts) but inversely proportional to rise time (tr). As overshoot increases, rise time tends to decrease but settling time, IAE and ISE increases. This situation was strongly related to the controller gain, Kc. Controller tuned using M4 tuning method resulted in largest Kc (refer to Table II), therefore the output response exhibited the largest overshoot, fastest rise time, longest settling time and produces large values of IAE and ISE. The largest IAE represents that the largest sum of area below and above the set point and the larger ISE indicates that poorer performance of controller tuned using M4. M1 resulted in the smallest Kc, which caused the sluggish output response and with the lowest overshoot, longest rise time and fastest settling time for both PI and PID controllers.
TABLE III
PERFORMANCE CHARACTERISTICS FOR PI AND PID CONTROLLERS TUNED BY DIFFERENT TUNING METHODS
Tuning method
PI controller PID controller
OS tr ts IAE ISE OS tr ts IAE ISE
M 1 4.0400 3.7490 3.3950 2.1690 2.5040 3.2000 4.3880 2.8740 2.1100 2.1780 M 2 9.4200 3.0550 5.1020 2.1120 2.3740 3.8000 2.4370 2.2610 1.6900 2.0670 M 3 34.7600 2.2700 6.6780 2.4400 2.2340 35.0000 1.9080 8.0390 2.5150 2.0940 M 4 62.2800 2.0390 9.6780 3.2380 2.4750 69.0000 1.7390 7.1640 2.7910 2.3230
3.4 Robustness Analyses
For a fair comparison of different controller settings, both performance and robustness should be considered because these performance criteria do not address directly another important factor of a closed loop system-robustness. Gain and phase margins are two well-known measures for maintaining the robustness of the control system that indicate how close the system is to becoming unstable. The range of GM and PM used are (2≤GM≤5) and (30º≤PM≤75º) in PID specifications Error! Reference source not found.. Table IV showed the stability of PI and PID controllers checked by calculating the GM and PM respectively.
TABLE IV
GAIN MARGINAND PHASE MARGIN OF CLOSED LOOP RESP ONSE
FOR BOTH P I AND PID CONTROLLERS.
Tuning method
PI controller PID controller
GM PM (degree) GM PM (degree) M 1 3.1415 61.3521 2.3272 68.9515 M 2 2.7100 57.1588 2.0661 63.6032 M 3 1.9608 41.4557 1.5967 50.9776 M 4 1.6069 27.6157 1.4259 38.3962
The larger gain margin (GM) value shows that the greater safety factor designed into the control system. The greater the safety factor resulted in the smaller the controller gain,
Kc. Therefore the controller is less sensitive to model parameter errors. Both PI and PID controllers tuned using M1 had the largest GM value which was resulted by the smallest Kc and, therefore the tuned controller could withstand greater changes in system parameters before becoming unstable. M3 and M4 methods resulted in very low GM (<2) indicating that those methods may not be suitable to control the process.
Phase margin (PM) indicates relative stability, the smaller its value the more tendency for it to oscillate. M4 showed the smallest PM value for both controllers and its response tends to more oscillate before reaching the steady state value. Both controllers tuned by M1 yield the largest PM, therefore the largest phase angle can be added to the control loop before it goes unstable.
In general, robustness can be achieved by choosing controller setting with small Kcand large τIbut it tends to result in poor performance. It leads to tradeoff between performance and stability of process control systems to maximize performance while ensuring robustness. After considering both performance and robustness, the suitable tuning method was M1. The applicable control strategy used involves PI feedback controller as it provides sufficient robustness and performance, and less sensitive to errors compared to PID controller.
3.5 Process Model Mismatches
In practical situations, the dynamic model is only an approximation of the true process dynamics. It is important to understand how robust the control system to uncertainty of the process dynamics. Errors in the process model parameters lead to poorer control performance and potential instability. Since the tuning based on model, the tuning procedure should account for the errors to provide acceptable control performance as the process dynamics change. Therefore ±25% uncertainty in each nominal model parameters was calculated.
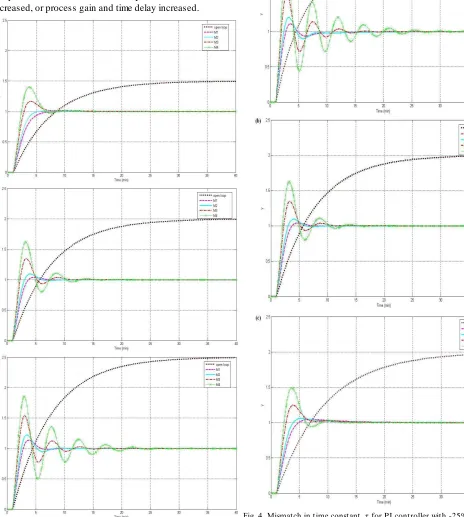
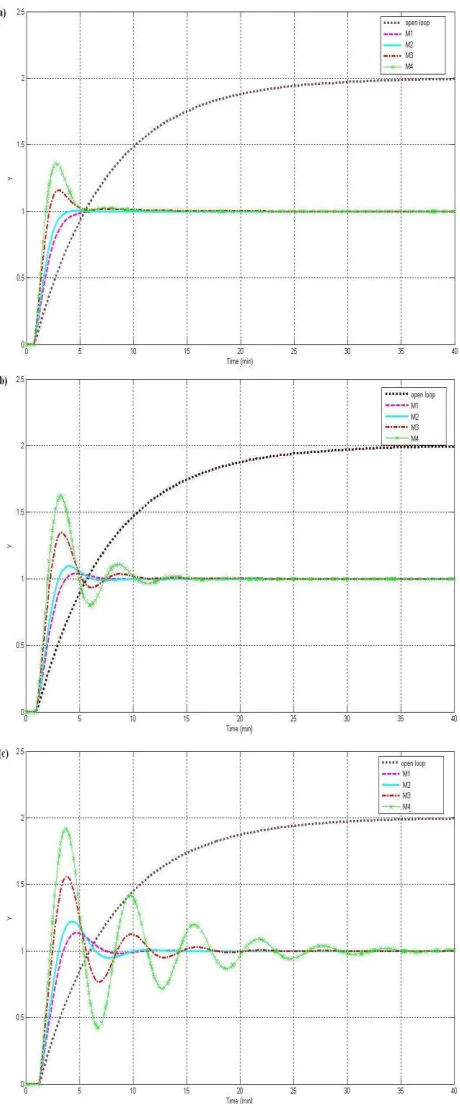
Fig. 3, 4 and 5 presented the closed loop responses for PI controller after mismatch in process gain, Kp, time constant,
τ, and time delay, θ respectively. All closed loop responses became slower and stable when τ was increased, Kp or θ were decreased. As expected, the closed loop responses will become oscillatory if τ was decreased, Kp or θ were increased.
Generally, stability problem arises for PI and PID controllers tuned using M3 and M4 methods, especially for PID controller tuned by M4 where the output became unstable. In term of stability, the closed loop responses for all controllers tuned by M1 and M2 would give bett er responses and oscillation free responses. After process model mismatch, M1 would give good performances as well as the nominal process and the suitable control strategy is PI feedback controller. The performances of PI controller are acceptable and cons istent when process model mismatch was considered.
The empirical model of nozzle atomizer spray dryer was a first order plus time delay (FOPTD) model. PI controller tuned by M1 is suitable due to best achievable controller performances and highly robust when the nominal process parameters are different than that used for controller design. The process became slower if time constant increased, or process gain and time delay decreased. On the other hand, the process will became oscillatory when time constant decreased, or process gain and time delay increased.
Fig. 3. Mismatch in process gain, Kp for PI controller with -25%, nominal
and +25% respectively.
Fig. 5. Mismatch in time delay, θ for PI controller with -25%, nominal and +25% respectively.
ACKNOWLEDGEM ENT
We wish to thank the Department of Process and Food Engineering, Faculty of Engineering, Universiti Putra M alaysia (UPM ) for their support.
REFERENCES
[1] Jayasundera, M., Ahhikari, B., Aldred, P., & Ghandi, A. (2009). Surface modification of spray dried food and emulsion powders with surface-active protein: A review. Journal of Food Engineering, 93, 266-277.
[2] Nijdam, J. J., Guo, B., Fletcher, D. F., & Langrish, T . A. G. (2006). Lagrangian and Eulerian models for simulating turbulent dispension and coalescence of droplets within a spray. Applied Mathem atical Medelling 30, 1196-1211.
[3] Masters, K. (1985). Spray Drying Handbook (4th edition ed.). London: George Godwin.
[4] Patel, K. C., & Chen, X. D. (2005). Prediction of spray -dried product quality using two simple drying kinetics models.
Journal of Food Process Engineering, 28, 567-594.
[5] Langrish, T . A. G. (2009). Muti-scale mathematical modelling of spray dryers. Journal of Food Engineering, 93, 218-228.
[6] Pérez-Correa, J. R., & Zaror, C. A. (1993). Recent advances in process control and their potential applications to food processing Food Control, 4(4), 202-209.
[7] Chiou, D., & Langrish, T . A. G. (2008). A comparison of cystallisation approaches in spray drying. Journal of Food Engineering, 88, 177-185.
[8] Langrish, T . A. G. (2009). Muti-scale mathematical modelling of spray dryers. Journal of Food Engineering, 93, 218-228.
[9] Seborg, D. E., Edgar, T . F., & Melichamp, D. A. (2004).
Process Dynam ics and Control (2 ed.). New York: John Wiley.
[10]Vijaya Selvi, J. A., Radhakrishnan, T . K., & Sundaram, S. (2007). Performance assessment of PID and IMC tuning methods for a mixing process with time delay. ISA Transactions, 46, 391-397.
[11]Smith, C. A., & Corropio, A. B. (2006). Principle and Practice of Autom atic Control (3 ed.). New York: John Wiley.
[12]Padma Sree, R., Srinivas, M. N., & Chidambaram, M. (2004). A simple method of tuning PID controllers for stable and unstable FOPT D systems. Com puter and Chem ical Engineering, 28, 2201-2218.
[13]T an, W., Liu, J., Chen, T ., & Marquez, H. J. (2006). Comparison of some well-known in PID tuning formulas.
Com puter and Chem ical Engineering, 30, 1416-1423.