E-ISSN 2308-9830 (Online) / ISSN 2410-0595 (Print)
Spatial Cognitive Simulation Using Informed Virtual Geographic
Environments
Mehdi Mekni
St. Cloud State University, Department of Computer Science & Information Technology, St. Cloud,
Minnesota, United States
ABSTRACT
In this paper, we address two challenging issues underlying spatial cognitive simulation using software agents immersed in Virtual Geographic Environments (VGE). First, the way to describe virtual VGE models using accurate spatial decomposition approaches structured using graph theory techniques. Second, the use of graph abstraction techniques to realistically support advanced navigation and path planning capabilities for software agents. In order to illustrate our contributions to the growing field of spatial simulations, we present and discuss a case study involving an urban VGE model populated with agents who autonomously and differently interact with multiple abstractions of the same physical environment.
Keywords:Virtual Geospatial Environments, Multi-Agent Systems, Spatial Cognition, Environment Abstraction.
1 INTRODUCTION
During the last decade, the Multi-Agent Geo-Simulation (MAGS) approach has attracted a growing interest from researchers and practitioners to simulate phenomena in a variety of domains including traffic simulation, crowd simulation, urban dynamics, and changes of land use and cover, to name a few [1]. Such approaches are used to study phenomena (i.e. car traffic, mobile robots, sensor deployment, crowd behaviors, etc.) involving a large number of simulated actors (implemented as software agents) of various kinds evolving in, and interacting with, an explicit description of the geographic environment called Virtual Geographic Environment (VGE) [15].
A critical step towards the development of MAGS is the creation of a VGE, using appropriate representations of the geographic space and of the objects contained in it, in order to efficiently support the agents’ situated reasoning [30]. Since a geographic environment may be complex and large scale, the creation of a VGE is difficult and needs large quantities of geometrical data originating from the environment characteristics (terrain elevation, location of objects and agents, etc.) as well as semantic information that qualifies space
(building, road, park, etc.) [28].
In order to yield realistic MAGSs, a VGE must precisely represent the geometrical information which corresponds to geographic features. It must also integrate several semantic notions about various geographic features [22]. To this end, we propose to enrich the VGE data structure with semantic information that is associated with the geographic features. Moreover, we propose to abstract this semantically-enriched and geometrically-precise VGE description in order to enable large-scale and complex geographic environments modeling.
243
M. Mekni / International Journal of Computer Networks and Communications Security, 4 (8), August 2016
abstraction approach. Finally, Section 6 concludes and presents the future perspectives of this work.
2 RELATED WORK
Virtual environments and spatial representations have been used in several application domains. For example, Thalmann et al. proposed a virtual scene for virtual humans representing a part of a city for graphic animation purposes [4]. Donikian et al. proposed a modeling system which is able to produce a multi-level data-base of virtual urban environments devoted to driving simulations [26]. More recently, Shao et al. proposed a virtual environment representing the New York City’s Pennsylvania Train Station populated by autonomous virtual pedestrians in order to simulate the movement of people [24]. Paris et al. also proposed a virtual environment representing a train station populated by autonomous virtual passengers, in order to characterize the levels of services inside exchange areas [23]. However, since the focus of these approaches is computer animation and virtual reality, the virtual environment usually plays the role of a simple background scene in which agents mainly deal with geometric characteristics [19]. Indeed, the description of the virtual environment is often limited to the geometric level, though it should also contain topological and semantic information for other types of applications using advanced agent-based simulations. Current virtual environment models do not support large-scale and complex geographic environments and fail to capture real world physical environments’ characteristics. When dealing with large-scale and complex geographic environments, the spatial subdivision which can be either exact or approximate produces a large number of cells [9]. The topologic approach allows representation of such a spatial subdivision using a graph structure and to take advantage of efficient algorithms provided by the graph theory [23]. However, the graph size may still remain large when dealing with geographic environments with dense geographic features [9]. Moreover, geographic features with curved geometries (Figure 1) produce a large number of triangles since they are initially represented by a large number of segments.
An environment abstraction is a process used to better organize the information obtained at the time of spatial subdivision of the geographic environment. The unification process is addressed principally in two ways: (1) a pure topological [10] unification which associates the subdivision cells according to their number of connexions; (2) a
more conceptual unification which introduces a semantical definition of the environment, like with the IHT-graph structure [26]. Lamarche and Donikian proposed a topologic abstraction approach which assigns to each node of the graph resulting from the space decomposition a topological qualification according to the number of connected edges given by its arity [10]. The topologic abstraction algorithm aims to generate an abstraction tree by merging interconnected cells while trying to preserve topological properties [10]. When merging several cells into a single one, the composition of cells is stored in a graph structure in order to generate the abstraction tree. The topologic abstraction proposed by Lamarche and Donikian relies on the topological properties of the cells and reduces the size of the graph that represents the space subdivision [10]. However, the topological characteristics are not sufficient to abstract a virtual environment when dealing with a large-scale and complex environment involving areas with various qualifications (buildings, roads, parks, sidewalks, etc.). (a) Curved geometries. (b) Alignment anomalies.
Fig. 1. Cells resulting from curved geometries (a) and alignment anomalies (b) [23].
Not much research has been done on semantic integration in the description of a virtual environment. The Computer Animation and Behavioral Animation research fields provide a few attempts to integrate the semantic information in order to assist agents interacting with their environments. Semantic information has been used for different purposes, including the simulation of inhabited cities [4], computer animation [8], and simulation of virtual humans [5]. Farenc has first used the notion of Informed Environments [4]. She defined informed environments as a database which represents urban environments with semantic information representing urban knowledge [4]. An informed environment is thus characterized as a place where information (semantic and geometrical) is dense, and can be structured and organized using rules [4]. Building an informed environment as presented by Farenc consists of adding a semantic layer onto a core corresponding to classical scenes (a set of graphical objects) modeled using graphical software for computer animations purposes [4].
the creation of geometrically-accurate and semantically-enriched geographic content is still an open issue. Indeed, research has focused almost exclusively on the geometric and topologic characteristics of the virtual geographic environment. However, the structure of the virtual environment description, the optimization of this description to support large-scale and complex geographic environments, the meaning of the geographic features contained in the environment as well as the ways to interact with them have received less attention.
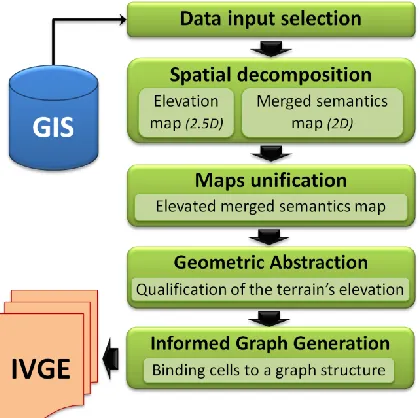
Fig. 2. The IVGE global architecture of IVGE generation including the environment abstraction process.
Moreover, several elevation layers can be specified, the model being able to merge them automatically. Second, semantic layers are used to qualify various features of the geographic space. As shown in Figure 3, each layer indicates the geographic boundaries of a set of features having identical semantics, such as roads and buildings. The boundaries of the features can overlap between two layers, our model being able to merge this information.
3 INFORMED VIRTUAL GEOGRAPHIC
ENVIRONMENT
A. Spatial decomposition
The second step of our method consists in obtaining an exact spatial decomposition of the input data in cells. This process is entirely automatic, using a Delaunay triangulation, and can
be divided into two parts in relation to the previous phase. First, an elevation map is computed, corresponding to the triangulation of the elevation layers. All the elevation points of the layers are injected in a 2D triangulation, the elevation being considered as an additional datum. This process produces an environment subdivision composed of connected triangles (Figure 4). Such a subdivision provides information about coplanar areas: the elevation of any point inside the environment can be deduced using the elevation of the three vertices of the corresponding triangle. Second, a merged semantics map is computed, corresponding to a Constrained Delaunay Triangulation (CDT) of the semantic layers. Indeed, each segment of a semantic layer is injected as a constraint which keeps track of the original semantic data using an additional datum. Consequently, the resulting map is a CDT merging all input semantics: each constraint represents as many semantics as the number of input layers containing it. For example, Figure 4 presents the resulting CDT of the geographic features provided in Figure 3 by using the same colors.
B. Maps unification
The third step to obtain the VGE data consists in merging the two maps previously obtained. This phase corresponds to the mapping of the 2D merged semantic map on the 2:5D elevation map in order to obtain the final 2:5D elevated merged semantics map (Figure 4). First, a pre-processing is carried out on the merged semantics map in order to preserve the elevation precision inside the unified map. Indeed, all the points of the elevation map are injected in the merged semantics triangulation, creating new triangles. Then, a second process elevates the merged semantics map. The elevation of each merged semantics point P is computed by retrieving the triangle T of the elevation map whose 2D projection contains P. Once T is obtained, the elevation is simply computed by projecting P on the plane defined by T using the Z axis. When P is outside the convex hull of the elevation map, no triangle can be found and the elevation cannot be directly deduced. In this case, we use the average height of the points of the convex hull which are visible from P.
C. Propagation of Borders Semantics
245
M. Mekni / International Journal of Computer Networks and Communications Security, 4 (8), August 2016
dealing with the semantics associated with a position, as for example if we want to check if a position is inside a building. This is why we propose to enhance the information provided by the VGE by spreading the boundaries’ semantics to the
cells. Three related processes are necessary, and explained in the following subsections: graph analysis, potential conflicts resolution, and semantics assignation.
Fig. 3. Various semantic layers related to Quebec City (Canada): (From left to right) road network; old city wall; marina; governmental buildings; houses
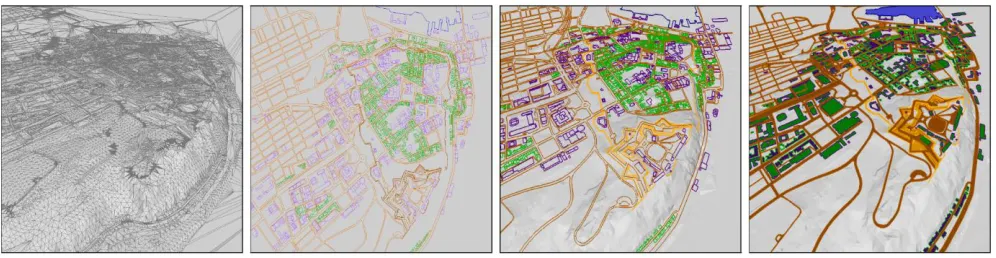
Fig. 4. From left to right: triangulated elevation map (2:5D); merged semantics map (2D); borders semantics; illustrates the unified maps after semantics propagation. The semantic colors are the same as in Figure 3. Grey lines represent unconstrained triangulation segments.
D. Graph analysis
The graph analysis is a traversal algorithm which explores the environment’s graph while qualifying the cells towards a given semantic (See Algorithm 1). This algorithm is applied to the entire graph one time for each semantic to propagate, starting from a user-defined set of entry cells. While exploring the graph, the algorithm collects three kinds of cells which are stored in three container structures for future use: Inside cells are within an area delimited by borders associated to the propagated semantic. Outside cells are outside any area defining the propagated semantic. Conflict cells are both qualified inside and outside by the algorithm. Three parameters influence the traversal:
Semantic information to propagate.
Set of starting cells, indicating where to start the exploration of the graph. A set is provided instead of a single cell in
order to be able to manage disconnected graphs. By default, the outer cells of the environment can be chosen.
Boolean value indicating whether the semantic must be assigned to the starting cells or not.
While exploring the graph, the algorithm collects three kinds of cells which are stored in three container structures for future use:
Inside cells are within an area delimited by borders associated to the propagated semantic.
Outside cells are outside any area defining the propagated semantic.
Conflict cells are both qualified inside and outside by the algorithm.
Algorithm 1: Graph Analysis
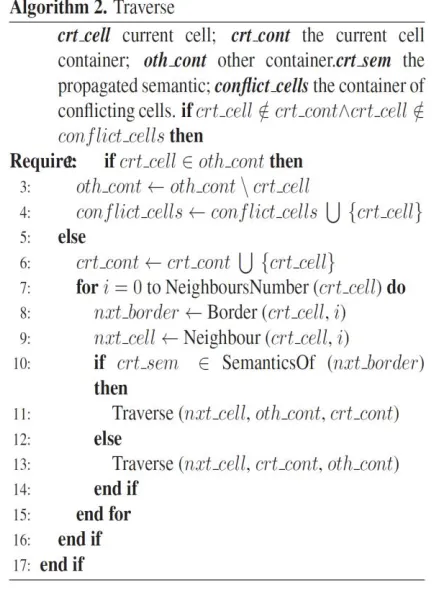
The graph traversal (see Algorithm 2 below) recursively explores the graph while collecting the three kinds of cells (inside, outside, and conflicting). Line 1 checks if the current cell has not already been processed. Then, line 2 detects conflicting cells, i.e. cells which have already been assigned to the other container. If so, lines 3 and 4 assign the cell to the conflict container, and stop the recursion. Otherwise (line 5), the cell is assigned to the current container (line 6), and the cell’s neighbors are explored (line 7). Finally, line 10 checks if a border with the propagated semantic is traversed, which results in a swap of the filled containers for the recursive call (line 11), or in a standard recursion otherwise (line 13).
A. Resolution of Conflicts
After each graph traversal, we must resolve the cells that are potentially in conflict. Indeed, these cells must be assigned to either the inside container or to the outside container in order for the system to continue with the next phase. Cells are in conflict when the shapes of two input features with the same semantic share a segment. Two alternative methods are proposed: (1) a fast assignment where the conflicting cells are arbitrarily transferred to one of the target containers; and (2) a deductive assignment where an algorithm selects the best option based on geometric considerations.
Algorithm 2: Graph Traverse
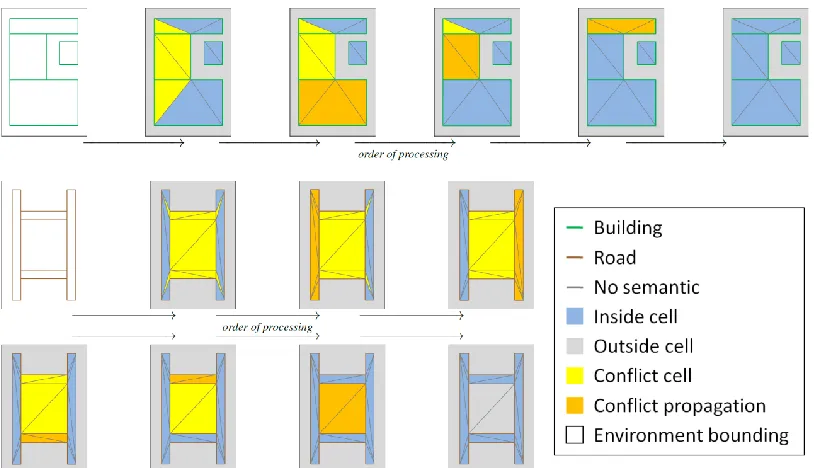
The arbitrary assignment is used when the internal details of a shape are not relevant for the target application. For example, the left hand side of Figure 7 presents two buildings. The building on the left-hand side has internal walls producing conflicting cells. These conflicts can be resolved using the arbitrary assignment since they are not relevant when considering a building as an obstacle. The deductive assignment is used when the internal details of a shape are relevant. For example, the right hand side of Figure 7 presents four connected roads producing conflicting cells. They are resolved using the deductive method in order to determine which parts are effectively roads, and which parts are not. Both methods are carried out in two steps applied to each conflicting cell: (1) a local conflicting graph extraction which is the same for both methods; and (2) a decision step which is specific to each method.
247
M. Mekni / International Journal of Computer Networks and Communications Security, 4 (8), August 2016
to the local list (line 3). Then, the algorithm recursively explores the neighbors (line 4) which are reachable through a border which is not marked by the propagated semantic (line 6).
Algorithm 3: Extraction of Local Conflict Cells
The decision part of the arbitrary assignment only consists in transferring the local conflicting cells to one of the inside or the outside containers.
The decision part of the deducing algorithm is based on geometric considerations (see Algorithm 4 below). If the local conflicting zone is mainly surrounded by outside cells, then the conflict is
inside, and vice versa. This decision process is carried out in two steps (the imposed parameter being set to false, and then to true). First, the conflict cells can remain in an unknown state, no decision being taken if the algorithm is not conclusive. Second, a decision is imposed even if inconclusive. Three perimeter lengths are computed (lines 1-18): inside perimeter which corresponds to the zone boundaries connected to inside cells; outside perimeter for outside cells; and unknown perimeter when connected to cells which are still in conflict. If a decision is imposed, the unknown perimeter is ignored (lines 19-21). Finally, if the inside perimeter is predominant (lines 22-24), the conflicts are set to outside cells, or to inside cells in the other case (lines 25-27). The two successive conditions (lines 22 and 25) allow the first step of the algorithm to maintain the conflicting state, waiting for other resolutions.
Finally, the second step is done for all undecided local conflicts once all the first decision steps have been carried out. The need for two decision steps is illustrated in Figure 4. If the last conflict resolution in this figure had been made first, the decision would have been impossible, the zone being totally surrounded by unknown cells; the displayed resolution order avoids any decision failure, and only requires one step.
B. Semantics Assignment
The last step of the semantic propagation consists of assigning the final semantics to the cells. The process is very simple: each propagated semantic is assigned to all the cells of the corresponding Inside cells. One can notice some cells may have multiple semantics when they are present in more than one Inside container. Additionally, it is possible to keep track of the Outside cells by assigning them a negative semantic, as for example in order to know which cells correspond to a road in the environment and which do not.
Finally, an optional process can be performed to remove the borders’ semantics of some detected conflicting cells. Indeed, such borders may distort some spatial reasoning algorithms. For example, when considering road borders as obstacles to plan a path, a simulated vehicle would not be able to go through some passageways. After resolution, the semantic of the problematic borders is removed, making them crossable. These problematic borders are the ones which are marked with a propagated semantic and which connect two Inside cells. One can note only the cells previously detected as conflicting need to be tested.
4 ENVIRONMENT ABSTRACTION
A. Geometric Abstraction
The spatial decomposition subdivides the environment into convex cells. Such cells encapsulate various quantitative geometric data which are suitable for accurate computations. Since geographic environments are seldom flat, it is important to consider the terrain’s elevation, which
is quantitative geometric data. Moreover, while elevation data are stored in a quantitative way which suits to exact calculations, spatial reasoning often needs to manipulate qualitative information. Indeed, when considering a slope, it is obviously simpler and faster to qualify it using an attribute such as light and steep rather than using numerical values. However, when dealing with large scale geographic environments, handling the terrain’s elevation, including its light variations, may be a complex task. To this end, we propose an abstraction process using geometric data to extract the average terrain’s elevation information from spatial areas. The objectives of this Geometric Abstraction are threefold. First, it aims to reduce the amount of data used to describe the environment. Second, it helps for the detection of anomalies, deviations, and aberrations in elevation data. Third, the geometric abstraction enhances the environmental description by integrating qualitative information characterizing the terrain’s elevations. In the following section, we first present the algorithm which computes the geometric abstraction.
1) Geometric
abstraction algorithm
244
M. Mekni / International Journal of Computer Networks and Communications Security, 4 (8), August 2016
Algorithm 4: Solve Conflict Cells
Algorithm 5: Geometric Abstraction
A group is a container of adjacent cells. The grouping strategy of this algorithm is based on a coplanarity criterion which is assessed by computing the difference between the normal vectors of two neighboring cells or groups of cells (Figure 6). Since a group is basically composed of adjacent cells it is obvious to characterize a group by its boundaries, its neighboring groups, its surface, as well as its normal vector. However, the normal vector of a group depends on an interpretation of the normal vectors of its composing cells. In order to compute the normal vector of a group, we adopt the area-weight normal vector [26] which takes into account the unit normal vectors of its composing cells as well as their respective surfaces. Let denote the surface of a cell c and ⃗⃗⃗⃗ be its unit normal vector, the area-weight normal vector ⃗⃗⃗⃗⃗ of a group G is computed as follow:
⃗⃗⃗⃗⃗ ∑ ⃗⃗⃗⃗ ⁄∑ (1)
lesser than gradient. The recursive geometric abstraction algorithm is composed of five steps:
1. For each cell c of the starting cells, create a new group G and do step 2.
2. For each neighboring group or cell n of G, depending if the neighbor has already been processed, do step 3.
3. If angle (⃗⃗⃗⃗⃗ ⃗⃗⃗⃗⃗ ) gradient then do step 4. Otherwise do step 5.
4. Merge n in group G. Then, evaluate
⃗⃗⃗⃗⃗ using equation (1). Do step 2 again for G.
5. If n is an unprocessed cell, create a new group G with n and do step 2.
Using the proposed algorithm (Algorithm 5), the geometric abstraction produces coherent groups whose cells are coplanar and respect the gradient threshold. Moreover, the geometric abstraction allows abstracting the initial topological graph and produces a new graph with fewer nodes helping to enhance performance of spatial reasoning mechanisms.
The analysis of the resulting groups helps identify anomalies in elevation data. Such anomalies need to be fixed in order to build a realistic virtual geographic environment. Furthermore, the average terrain’s elevation which characterizes each group is quantitative data described using area-weighted normal vectors. Such quantitative data are too precise to be used by qualitative spatial reasoning. Hence, a qualification process would greatly simplify spatial reasoning mechanisms. The geometric abstraction allows improving VGE by filtering the elevation anomalies, qualifying the terrain’s elevation using semantics and integrating such semantics in the description of the geographic environment.
Fig. 6. (a) Adjacent cells with normal vectors perpendicular to their respective plans and the angle between their normal vectors.
2) Filtering elevation anomalies
The analysis of the geometric abstraction may reveal some isolated groups which are totally surrounded by a single coherent group. These groups are characterized by a large difference between their respective area-weighted normal vectors. Such isolated groups are often characterized by their small surfaces and can be considered as anomalies, deviations, or aberrations in the initial elevation data. The geometric abstraction process helps for their identification and allows to automatically filter such anomalies using a two phase process. First, isolated groups are identified (Figure 7). The identification of isolated groups is based on two key parameters: 1) the ratio between the surface of surrounded and surrounding groups, and 2) the difference between the area-weighted normal vectors of the surrounded and surrounding groups. Second, these isolated groups are elevated at the average level of elevation of the surrounding ones (Figure 7). In fact, the lowest and the highest elevations (low elevation, high elevation) of the isolated group (isolated grp) are computed. Then, elevations of all the vertices of
isolated grp are updated using the average between lowest elevation and highest elevation. As a consequence, we obtain more coherent groups in which anomalies of elevation data are corrected.
Fig. 7. View of anomalous Isolated Groups (red color)
246
M. Mekni / International Journal of Computer Networks and Communications Security, 4 (8), August 2016
the area-weighted normal vectors (b) Fixing elevation anomalies. Isolated groups are elevated to the average elevation level.
3) Extracting elevation semantics
The geometric abstraction algorithm computes quantitative geometric data describing the terrain’s inclination. Such data are stored as numerical values which allow accurate characterizing of terrain elevations. However, handling and exploiting quantitative data is a complex task as the volume of values may be too large and as a consequence difficult to transcribe and analyze. Therefore, we propose to interpret the quantitative data of terrain’s inclination by qualifying areas’ elevations. Semantic labels, which are called semantics elevation, are associated to quantitative intervals of values that represent the terrain’s elevation. In order to obtain elevation semantic, we propose a two-step process taking advantage of the geometric abstraction:
Discretization of the angle between the weighted normal vector ⃗⃗⃗⃗⃗ of a group g and the horizontal plane.
Assignment semantic information to each discrete value which qualifies it.
The discretization process can be done in two ways: a customized or automated approach. The customized approach qualifies the terrain’s elevation and requires the user provide a complete specification of the discretization. Indeed, the user needs to specify a list of angle intervals as well as their associated semantic attributes. The algorithm iterates over the groups obtained by the geometric abstraction. For each group grp, it retrieves the terrain inclination value I. Then, this process checks the interval bounds and determines in which falls the inclination value I. Finally, the customized discretization extracts the semantic elevation from the selected elevation interval and assigns it to the group grp. For example, let us consider the following inclination interval and the associated semantic elevations: ([10; 20] ; light slope); ([20; 25] ; steep slope). Such a customized specification associates the semantic elevation “light slope” to
inclination values included in the interval [10; 20] and the semantic elevation “steep slope” to
inclination values included in the interval [20; 25]. The automated approach only relies on a list of semantic elevations representing the elevation qualifications. Let N be the number of elements of this list, and T be the total number of groups
obtained by the geometric abstraction algorithm (see Algorithm 5). First, the automated discretization orders groups based on their terrain inclination. Then, it iterates over these ordered groups and uniformly associates a new semantic elevation from the semantics set, each T/N processed groups. For example, let us consider the following semantic elevations: flight; medium; steep. Furthermore, let us consider an ordered set S of groups. S may be composed of six groups of cells and is denoted as follows: {
{ }} with respectively the following terrain’s inclination values: {5, 10, 15, 20, 25, 30}. For every 2 groups (as T = 6 and N = 3, T/N = 2), the automated discretization assigns a new semantic elevation. The automated discretization assigns a new semantic elevation. Let us compare these two discretization approaches. On the one hand, the customized discretization process allows one to freely specify the qualification of the terrain’s elevations. However, qualifications resulting from such a flexible approach deeply rely on the correctness of the interval bounds’ values. Therefore, the customized discretization method requires having a good knowledge of the terrain characteristics in order to guarantee a valid specification of inclination intervals. On the other hand, the automated discretization process is also able to qualify groups’ elevations without the need to specify elevation intervals’ bounds. Such a qualification usually produces a visually uniformed semantic assignment. This method also guarantees that all the specified semantic attributes will be assigned to the groups without a prior knowledge of the environment characteristics.
4) Enhancing the geometric abstraction
registered as members of the new group. Finally, the area-weighted normal vector is computed for the new group. Hence, this process guarantees that every group is only surrounded by groups which have different semantic elevations.
In this section, we proposed a geometric abstraction process as well as three heuristics which take advantage of this process. The geometric abstraction is built using a graph traversal algorithm. It groups cells based on their area-weighted normal vectors. The objectives of the geometric abstraction are threefold. First, it qualifies the terrain’s elevation of geographic environments to simplify spatial reasoning mechanisms. Second, it helps identifying and fixing elevation anomalies in initial GIS data. Third, it enriches the description of geographic environments by integrating elevation semantics.
B. Semantic Abstraction
Two kinds of information can be stored in the description of an IVGE. Quantitative data are stored as numerical values which are generally used to depict geometric properties (like a path’s width of 2 meters) or statistical values (like a density of 2.5 persons per square meter). Qualitative data are introduced as identifiers which can range from a word with a given semantics, called a label, to a reference to an external database or to a specific knowledge representation.
Such semantic information can be used to qualify an area (like a road or a building) or to interpret a quantitative value (like a narrow passage or a crowded place) [7]. An advantage of interpreting quantitative data is to reduce a potentially infinite set of inputs to a discrete set of values, which is particularly useful to condense information in successive abstraction levels to be used for reasoning purposes. Furthermore, the semantic information enhances the description of the IVGE, which in turn extends the agents’ knowledge about their environment. However, the integration of the semantic information raises the issue of its representation. Therefore, we need a standard formalism that allows for precisely representing the semantic information which qualifies space and which is computationally tractable in order to be used by spatial reasoning algorithms used by agents.
Several knowledge representation techniques can be used to structure semantic information and to represent knowledge in general such as frames [21], rules [11] (also called If-Then rules), tagging [27], and semantic networks [25] which have originated from theories of human information processing.
Since knowledge is used to achieve intelligent behavior, the fundamental goal of knowledge representation is to represent knowledge in a manner that facilitates inference (i.e. drawing conclusions) from knowledge.
In order to select a knowledge representation (and a knowledge representation system to logically interpret sentences in order to derive inferences from them), we have to consider the expressivity of the knowledge representation. The more expressive a knowledge representation technique is, the easier (and more compact) we can describe and qualify geographic features which characterize IVGE. Various artificial languages and notations have been proposed to represent knowledge. They are typically based on logic and mathematics, and can be easily parsed for machine processing. However, Sowas’s Conceptual Graphs [25] are widely considered an advanced standard1 logical notation for logic based on existential graphs proposed by Charles Sanders Peirce and on semantic networks. Syntactically, a conceptual graph is a network of concept nodes linked by relation nodes. Concept nodes are represented by the notation [Concept Type: Concept instance] and relation nodes by (Relationship-Name). A concept instance can be either a value, a set of values or even a CG. The formalism can be represented in either graphical or character-based notations. In the graphical notation, concepts are represented by rectangles, relations by circles and the links between concept nodes and relation nodes by arrows. The most abstract concept type is called the universal type (or simply Universal) denoted by the symbol ┴.
MAGS usually involves a large number of situated agents of different types (human, animal, static, mobile, etc.) performing various actions (moving, perceiving, etc.) in virtual geographic spaces of various extents. Using CGs greatly simplifies the representation of complex situated interactions occurring at different locations and involving various agents of different types. In order to create models for MAGS we consider three fundamental abstract concepts: 1) agents; 2) actions; and 3) locations.
1
248
M. Mekni / International Journal of Computer Networks and Communications Security, 4 (8), August 2016
Fig. 8. Illustration of the action, agent and location concepts using a concept type lattice. Taking advantage of the abstraction capabilities of the CGs formalism (through the Concept Type Lattice(CTL)2 instead of representing different situated interactions of various agents in distinct locations, we are able to represent abstract actions performed by agent archetypes in abstract locations.
Moreover, we first need to specify and characterize each of the abstract concepts. The concept type lattice enables us specialize each abstract concept in order to represent situated behaviors such as path planning of agents in space. Figure 8 presents the first level of the concept type lattice refining the agent, action, and location concepts. Figures 9(a), (b), and (c) present the expansion of the concept type lattice presented in Figure 8. Figure 9(a) illustrates some situated actions that can be performed by agents in the IVGE such as sailing for maritime vehicles, rolling for terrestrial vehicles, walking for humans, and accessing for humans to enter or exit buildings (we assume that buildings are not navigable locations from the perspective of outdoor navigation). Figure 9(b) depicts how the location concept may be specialized into Navigable and Not Navigable concepts. The Navigable concept may also be specialized into Terrestrial Vehicle Navigable, Pedestrian Navigable, Marine Vehicle Navigable, and Bike Navigable which are dedicated navigable areas with respect to agent archetypes and environmental characteristics as specified by the elementary semantics. Figure 9(c) illustrates a few agent archetypes that are relevant to our geo-simulation including pedestrians, cars, trucks, and bikes.
(a)
(b)
2 2Concept types are organized in a hierarchy according to
levels of generality. However, this hierarchy is not a tree, since some concept types may have more than one immediate super type
(c)
Fig. 9. an example of a conceptual description of agent archetypes (a), actions performed (b), and locations situated in a geographic environment (c).
In order to show how powerful such a representation may be, let us consider the following example. We want to build a MAGS simulating the navigation of three human agents (a man, a woman, and a child), two bike riders (a man and a woman), and three vehicles (a car, a bus, and a boat) in a coastal city. The navigation behaviors of these different agent archetypes must respect the following constraints (or rules): 1) pedestrian agents can only move on sidewalks, on pedestrian streets, and eventually on crosswalks if needed; 2) vehicles can move on roads and highways; 3) boats sail on the river and stop at the harbor port; and 4) bikes move on bikeways, roads, and streets but not on pedestrian streets.
Using standard programming languages, it might be difficult to represent or develop the functions related to such simple navigation rules which take into account both the agents’ and the locations’ characteristics. However, the representation of these navigation rules becomes an easy task when using CGs and our defined concept type lattice. Here are their expressions in CGs:
[PEDESTRIAN:*p]<-(agnt)<-[WALK:*w1]->(loc)-
>[PEDESTRIAN NAVIGABLE:*pn]
[VEHICLE:*v]<-(agnt)<-[ROLL:*r1]->(loc)- >[TERRESTRIAL NAVIGABLE:tn]
Indeed, these agent archetypes are subtypes of the Pedestrian concept and pedestrian streets, sidewalks, and crosswalks are subtypes of the Pedestrian Navigable concept. To conclude, CGs offer a powerful formalism to easily describe different concepts involved in MAGS including agents, actions, and environments.
5 DISCUSSION
Thomas and Donikian proposed an Informed Hierarchical Topologic (IHT) [26] graph representing a part of the city of Renne (France) for human behavior animation purposes. This graph is composed of three layers: (1) the Basic Topological layer which contains real urban objects modeled as simple spaces such as buildings and road sections; (2) the Composite Space layer which is composed of simple spaces or composite spaces of lesser importance; (3) the Local Area layer which is the highest level of the IHT-graph and which is composed of composite spaces. This hierarchical urban model allows manual abstraction of buildings into blocks and road-sections and crossings into roads. The abstraction process is done by the user which constrains and considerably limits its application to real world large-scale and complex geographic environments. Thomas’s approach relies on a predefined decomposition of the virtual environment which is dedicated to urban environments. This decomposition is application-dependent (urban environments) and does not take into account the topologic and the geometric characteristics of the environment [2].
In contrast with Thomas [26] and Lamarche [10] approaches, our abstraction technique optimizes the representation of the geographic environment while taking into account the geometric, topologic and semantic characteristics of the geographic environment. This abstraction approach relies on an exact space decomposition technique (Constrained Delaunay Triangulation) in order to preserve the geometric and topologic characteristics of the geographic environment rather than on predefined space decomposition.
It also integrates semantic information associated with GIS data in order to enrich the description of the IVGE. Embedding the information directly in the environment allows the support of agents’ spatial reasoning capabilities [17]. However, the preparation of the fully augmented geometric model is very time consuming and difficult due to the sheer amount of data [16]. For example, a typical model of a city quarter as used by Farenc can contain several thousands of primitives of many types (such as polygons modeling sidewalk pieces,
benches, trees, bus stops, etc.). Moreover, Farenc built the urban environment using data provided by Computer Assisted Graphic Design systems since the purpose of the simulation is computer animation. However, when building virtual geographic environments representing large-scale and complex geographic environments based on reliable GIS data, Farenc’s approach cannot be used since it is dedicated to exclusively represent urban environments.
Indeed, the manual hierarchical space partitioning as proposed by Farenc is not feasible when dealing with geometrically complex environments. Moreover, the data structure of the urban environment’s description as proposed by Farenc needs to be enhanced in order to manage a large amount of geometric and topologic data. Finally, the hierarchical structure should be built using the geographic environments’ characteristics rather than being defined a priori as Farenc proposed. The work done towards representation of semantic information in virtual environments has been mostly carried out at a geometric level [5, 13, 29]. Gutiuerez proposed a semantic model which aims to represent the meaning, and functionality of objects in a virtual scene [6]. However, since the purpose of Gutiuerez’s approach is computer animations, the semantic information integration is located at the object description level rather than enriching the description the geographic environments. Virtual environments are usually created as computer graphics applications, with minimal consideration given to the semantic information [6, 12].
Moreover, semantic information has been used in an ad hoc way without any standard formalism. There is a gap between geometry and semantic information in current virtual geographic environment models. Since we believe that semantic information integration into a VGE’s description is by nature a knowledge representation problem, suitable and standard knowledge representation formalism has been proposed to integrate semantic information in the VGE’s description [14].
6 CONCLUSION AND FUTURE WORKS
250
M. Mekni / International Journal of Computer Networks and Communications Security, 4 (8), August 2016
IVGE description with terrain semantics. Moreover, the geometric abstraction process helps to detect and filter elevation anomalies and qualifies the terrain shape, specifically slope. Second, we detailed a topologic abstraction which builds hierarchical topologic graphs in order to deal with large-scale virtual geographic environments. This hierarchical structure reduces the size of the topological graph representing the IVGE. Third, we showed how the semantic abstraction process enhances the hierarchical topological graph using the concept type lattice in order to build different views of the IVGE. We are currently working on the leverage of our enhanced IVGE model to support hierarchical path planning algorithms which take into account both the abstracted description of the IVGE and the agent type’s characteristics.
7 ACKNOWLEDGMENT
This research project has been partially funded by the professional developmental fund provided by St. Cloud State University. The author would like to thank faculty from Department of Computer Science and Information Technology for their valuable comments and continuous support.
8 REFERENCES
[1] S.-G. Chen and J.-Y. Wu, "A geometric interpretation of weighted normal vectors and its improvements," in Proceedings of the International Conference on Computer Graphics, Imaging and Vision: New Trends, Beijing, China, 2005.
[2] I. Benenson and P. Torrens, Geosimulation:
Automata-Based Modeling of Urban
Phenomena, John Wiley and Sons Inc., 2004. [3] M. Wooldridge, Introduction to Multiagent
Systems, London, UK: {J}ohn {W}iley and {S}ons Inc., 2001.
[4] J. Zhu, J. Gong, H. Lin, W. Li, J. Zhang and X. Wu, "Spatial analysis services in virtual geographic environment based on grid technologies," MIPPR 2005: Geospatial Information, Data Mining, and Applications, vol. 6045, no. 1, pp. 604-615, 2005.
[5] W. Shao and D. Terzopoulos, "Environmental
Modeling for Autonomous Virtual
Pedestrians," Digital Human Modeling for Design and Engineering Symposium, 2005. [6] G. Thomas and S. Donikian, "Virtual humans
animation in informed urban environments," Computer Animation 2000, pp. 112-119, 2000.
[7] S. Rodriguez, V. Hilaire, S. Galland and A. Koukam, "An analysis and design concept for self-organization in Holonic Multi-Agent Systems," Artificial Intelligence, Engineering Self-Organizing Applications, vol. 4335, pp. 15-27, 2007.
[8] S. Jiancheng, Z. Taiyi and L. Feng, "Nonlinear prediction of mobile-radio fading channel using recurrent least squares support vector machines and embedding phase space," in International Conference on Communications, Circuits and Systems, ICCCAS'04, 2004. [9] D. D. Dajab, "Perspectives on the Effects of
Harmattan on Radio Frequency Waves," Journal of Applied Sciences Research, vol. 11, no. 2, pp. 1014-1018, 2006.
[10]O. Eyo, A. Menkiti and S. Udo, "Microwave Signal Attenuation in Harmattan Weather Along Calabar-Akampkpa Line-of-Sight Link," Turkish Journal of Physics, vol. 27, pp. 153-160, 2003.
[11]P. Graniero, "A Spatial Analysis of GPS Availability and Radio Data Transmission Reliability for Real-Time, Wireless GIS Updating in Urban Environments," 2004. [12]P. Graniero and H. Miller, "Real-time, wireless
field data acquisition for spatial data infrastructures," in GeoTec Event 2003, Vancouver BC, Canada, 2003.
[13]N. Savage, D. Ndzi, A. Seville, E. Vilar and J. Austin, "Radio wave propagation through vegetation: Factors influencing signal attenuation," Radio Science, vol. 38, no. 5, pp. n/a--n/a, 2003.
[14]O. S. G. F. (OSGEO), GDAL-OGR: Geospatial Data Abstraction Library / Simple Features Library Software, 2008.
[15]J. Gong and L. Hui, "Virtual Geographical Environments: Concept, Design, and Applications," in International Symposium on Digital Earth (ISDE), Beijing, China, 1999. [16]N. Sahli and B. Moulin, "EKEMAS, an
agent-based geo-simulation framework to support continual planning in the real-word," Applied Intelligence, 2008.
[17]A. Valadares, E. Gabrielova and C. V. Lopes, "On Designing and Testing Distributed Virtual
Environments," arXiv preprint
arXiv:1508.04465, 2015.
[18]R. Andersen, J. L. Berrou and A. Gerodimos, "On some limitations of grid-based (CA) pedestrian simulation models," in Proceedings of the First International Workshop on Crowd Simulation (V-Crowds'05), 2005.
Graphics Forum, vol. 21, no. 4, pp. 753-765, 2002.
[20]B. Moulin, G. Gancet and W. Chaker, "PADI-Simul, an agent-based software which simulates the behaviors of hundreds of actors in a geographic space," Journal on Computers, Environment and Urban Systems, vol. 28, no. 4, pp. 387-420, 2003.
[21]M. Kallmann, H. Bieri and D. Thalmann, "Fully Dynamic Constrained Delaunay Triangulations," Geometric Modelling for Scientific Visualization, 2003.
[22]F. Lamarche and S. Donikian, "Crowds of Virtual Humans: a New Approach for Real Time Navigation in Complex and Structured Environments," Computer Graphics Forum, Eurographics'04, 2004.
[23]S. Paris, S. Donikian and N. Bonvalet, "Environmental Abstraction and Path Planning Techniques for Realistic Crowd Simulation," Computer Animation and Virtual Worlds, vol. 17, pp. 325-335, 2006.
[24]N. Mufti, D. Siddle and M. Warrington, "Statistical results from radio signal strength Measurement Campaign over two over-sea paths in Channel Islands, UK," in Antennas and Propagation (EuCAP), 2015 9th European Conference on, 2015.
[25]G. Li, S. Yang, Y. Liu and Z. Nie, "A Variable
Step Length Hybrid Approach for
Electromagnetic Ray Tracing in Ionosphere," Electromagnetics, vol. 27, no. 6, pp. 331-340, 2007.
[26]S. Seidal and T. Rappaport, "Site-Specific Propagation Prediction for Wireless In-Building Personal Communication System Design," IEEE Transactions on Vehicular Technology, vol. 43, no. 4, pp. 879-891, 1994. [27]G. Comparetto, J. Schwartz, N. Schult and J.
Marshall, "A Communications Analysis Tool Set that Accounts for the Attenuation Due to Foliage, Buildings, and Ground Effects," in MILCOM 2003: Proceedings of the Military Communications Conference, Boston, MA, USA, 2003.
[28]J. Schwartz, G. Comparetto and J. Marshall, "The communications resource planning tool," in Military Communications Conference, 2003. MILCOM 2003. IEEE, Boston, MA, USA, 2003.
[29]S. Y. Willassen, "A method for implementing mobile station location in {GSM}," 1998. [30]M. A. Weissberger, "An initial critical