Abstract—Solid waste management has become an ever growing problem world-wide due to rapid urbanization and population growth. South Africa was found to have generated 59 million tons of general waste in 2011 with the Western Cape generating 675kg/capita/annum. The convention of management has been that of landfilling, however this method is fast becoming insignificant due to the lack of space and detrimental nature to environment. In light of the energy security issue South Africa is facing, and the global drive of finding alternate sources of fuel with the depletion of fossil fuel, attention has turned to MSW as a sustainable source of energy while remediating its effect on the environment. Thermochemical conversions of Municipal Solid Waste (MSW), thus presents an attractive means of harnessing the potential value in this waste stream thus thermochemical conversion pose an attractive means of converting this waste stream into valuable fuel products. Study was conducted making use of RDF pellets produced from the MSW. Pellet density was varied by varying the starch binder to MSW ratio, thus the effect of this on energy content and thermal degradation behavior was studied. The energy content of MSW in Cape Town was investigated using a bomb calorimeter and the thermal degradation behavior was studied using Thermogravimetric Analysis (TGA). The MSW calorific value was found to average at 19MJ/kg and 3 distinguishable major mass loss regions were found between temperatures 55 – 265oC, 270 - 410oC and 410 -
502oC. The total mass reduction was found to be 76%.
Index Terms—Calorific value (CV), proximate analysis, refuse derived fuel (RDF), thermo-gravimetric analysis (TGA), derivative thermogravimetry (DTG).
I. INTRODUCTION
Solid waste management is an ever growing challenge for any major city, not only in South Africa, but on a global scale. Due to urbanization, populations of major cities grow immensely on an annual basis. It stands to reason that with an increasing amount of people flocking into an area, the amount of solid waste generated would also show a substantial increase, exhibiting a relationship of direct proportionality. This then poses a challenge to the municipalities with regards to the management of the ever increasing volumes of waste generated.
Comprehensive Municipal Solid Waste (MSW) characterization data is not available in more recent documentation, however, a study conducted by the DEAT in
conjunction with the Council for Scientific and Industrial Research(CSIR) South Africa in 2011 reports that generation data according to per capita per annum was found to be still relevant in 2011 [1].
Table I illustrates clearly the link between urbanization and waste generation. Gauteng followed by the Western Cape Province show the highest amount of waste generation being 761 and 675 kg/capita/annum respectively. These respective provinces are also considered as the two most urbanized provinces in South Africa
According to the Population Education report published by the City of Cape Town in 2011, the population of the city increases by 2.6% every year. In this document, Statistics South Africa reported that in 2011, the population of Cape Town was 3.74 million. With a population growth rate of 2.6% annually, it means that Cape Town currently has a population of 4.03 million showing an increase of approximately 290 000 people over the past 3 years. Treasury reports that approximately an average of 0.8 to 3 kg per capita per day is generated suburban areas in South Africa. This amounts to quite a substantial amount when considering all the contributors of MSW in a specific town, city, or metropolitan area. City of Cape Town municipality website reports that approximately 1.9 mega tons of waste is generated annually in the city [2]-[4].
Modeled waste data shows that South Africa as a whole generated 59 million tons of general waste in 2011 (see Table II) [3]. Recycling efforts only account for an estimated 5.8 million tons while the balance of 53 million tons.
The composition of general waste in South Africa as contributed by industrial, commercial and household waste streams can be represented in terms of plastic, paper, glass, tyres, organic waste, construction and demolition waste, and non-recyclable municipal waste. Paper, plastics, glass and tyres are regarded as the mainline recyclables.
Non-recyclable Municipal waste
34%
Organic waste 13%
Construction and demolition waste 21% Paper
7%
Plastic 6%
Glass
4% Metals14%
Tyres 1%
General waste composition, 2011
Fig. 1. The waste composition for general waste, 2011 (percentage by mass) [3].
Thermochemical Conversion of Municipal Solid Waste —
An Energy Potential and Thermal Degradation Behavior
Study
A. Hlaba, A. Rabiu, and O. A. Osibote
Taking a closer look at the composition of the MSW namely in the City of Cape Town and the Gauteng province of South Africa, only a few studies of characterization have been carried out to date . With regards to the organic fraction of the waste, it can be split into putrescibles, greens and garden waste. Adding these streams together however and reporting them as organic waste shows that the City of Cape Town alone is very closely comparable to the whole province of Gauteng.
Fig. 2. Municipal waste composition (Percentage by Mass) [3].
In most developing countries, burning and landfilling are the common placed methods for MSW management, with glass and plastics being recycled. These methods are however largely inadequate and also pose a threat to the environment, public health, quality of air, landscape and ground water [5].
Thermo-chemical conversion thus provides an attractive means to managing waste whilst obtaining an alternative sustainable energy source.
Landfilling in particular is increasingly being globally recognized as an unsustainable method for waste management due to the adverse effects it has on the environment in terms of polluting contaminants [6]-[9]. Waste-To-Energy (WTE) conversion technologies are largely gaining positive acclaim with numerous municipalities worldwide [10]. These technologies can be separated into biological/chemical, physical or thermal technologies.
Biological/chemical technologies are low temperature operations running below 200oCand hence with low reaction rate as reaction rate is directly proportional to reaction temperature [11]. Some technologies are comprised of the manufacturing of products by means of physical chemistry and chemical processes applied in multiple steps. A vast range of by-products are obtained ranging between compost, chemicals and electricity.
Physical technologies deal with the changing of the characteristics of the organic fraction from the MSW feedstock. These organic materials may be separated, shredded and dried resulting in a material formally known as refuse-derived fuel (RDF). This fuel can come in the form of densified or pelletized homogenous fuel pellets which are used in thermal technologies.
Thermal technologies, unlike the biological/chemical technologies, operate at much higher temperatures ranging from 400oC to 5000oC. Electricity is commonly the primary by-product from most thermal technologies currently in application. Thermal technologies include advanced thermal conversion processes in the form of incineration, pyrolysis, and gasification.
This paper focuses on understanding the energy potential of Refuse Derived Fuel (RDF) pellets from MSW in the City of Cape Town and their respective thermal degradation behavior. This can be regarded as a preliminary study in order to understand the thermal characteristics of this alternate source of energy as a basis for application in thermo-chemical conversion technologies in future applications for the production of energy, be it in the form of electricity or even transportation fuels. This is in light of the current energy security issue that South Africa faces in terms of insignificant fossil fuel reserves in terms of coal and natural gas.
South Africa’s most abundant energy source is coal and most of the coal is of low quality, low heating value and high ash content. According to the Electricity Supply Commission, also known as “ESKOM” in South Africa, the organization relies on this coal to generate 90% of South Africa’s electrical energy supply. Even with the coal, South Africa is still facing a crisis in terms of balancing power supply with demand which has resulted in ESKOM resorting to a relief procedure known to South African citizens as “Load shedding”.
Sasol uses the gasification of coal to produce syng as for petroleum production. However, coal is somewhat, “dirty” source of fuel due to its polluting nature. Petro SA converts natural gas into liquid fuels, however reserves are low.
MSW on the other hand offers a sustainable, non-exhaustible and non-season dependent source of raw material for the production of any form of energy.
II. MATERIALS AND METHODOLOGY
A. Source of Sample
All MSW samples used were collected from the mixed waste sections of the drop-off facilities and transfer stations around the City of Cape Town municipal area. The mixed waste section is chosen as this is the waste that is to be disposed off in the landfills. At least four sample bags of mixed waste samples were collected from each site in order to get a good representative of the specific sample site.
B. RDF Production
MSW poses a processing challenge due to its heterogeneous nature. The production of RDF pellets is put in place as a remedial strategy to this. However, due to different locations and sometimes seasonal waste, the pellets themselves may still have differing characteristics in terms of composition. In order to limit the variations of the RDF properties in terms of the composition and thermal properties the following steps were implemented in production: 1) The MSW samples were reduced in size proportions
with regards to the large components of the collected samples by means of a hand held scissor. All the large components of a specific sample must be cut into smaller pieces to allow for ease of handling.
2) Samples are then dried in a temperature controlled oven at approximately 60oC over a 5 hour period.
4) A sample splitter is then used to obtain composites of the now powdered form MSW sample.
5) Modified corn starch mixed with water is then used as a binder where the starch to MSW ratio is varied and the pellets are formed using a hand held pellet press. 6) Pellets are then dried as in step 2.
By applying this method, the sample should exhibit the same kind of properties or a very small to negligible range of variation.
C. Calorific Value Determination
It is important to know the amount of energy the MSW mixed waste samples contain as means of understanding the potential of the waste feed stock as a source of fuel. This was done by means of an E2K Bomb Calorimeter. The instrument is used to determine a sample’s energy content in terms of the calorific value. This measurement is achieved by combusting the sample in a pressurized vessel which is pressurized with oxygen up to 3000 kPa. Since the vessel is filled with oxygen, the apparatus is able to achieve complete combustion of the sample in question. After the process is complete, the device gives a result as a CV value in MJ/kg. The sample mass used in the apparatus is 0.5 grams. Through the bomb calorimeter, the energy that will be liberated from the MSW during a combustion process will be determined, thus giving an idea of how and where the energy can be used.
D. Thermo-Gravimetric Analysis
The significance in understanding the thermal stability of the MSW sample is that it gives a clear picture of how the feedstock will degrade under thermal processing. This will help in the fact that it gives a guide as to how the process parameters can be manipulated during an optimization procedure.
The method used in the analysis is as follows:
1) The analysis begins where the waste sample is heated in an inert environment of N2 from 20°C-920°C at a heating rate of 20°C/min
2) At 920°C the temperature is then maintained for 15 min in N2environment.
3) With the temperature still maintained at 920°C, O2is then introduced to the system and maintained for 15 min. The TG curve is obtained from plotting the mass loss% against the temperature. From these curves, the data for proximate analysis can be obtained by finding the major mass loss regions and correlate them to the relevant property in terms of volatile matter, fixed carbon, ash content and moisture content
III. RESULTS AND DISCUSSION
A. Calorific Value
In total, 30 samples were tested amounting to 10 sample sites completed. Each sample site was analyzed 3 times to ensure the integrity of the results. The averaged results for each sample site are presented on Fig. 3.
The results presented in Fig. 3 represent the raw ground up samples of MSW on a dry basis. The averaged calorific value measurements, of the samples in total range from
approximately 15 to 25 MJ/kg averaging out to approximately 19 MJ/kg. In analysis of the samples, there were samples that showed higher energy levels with one sample from Ladiesmiles maxing out at 28.9 MJ/kg. This sample and others that had calorific values above 20 MJ/kg were all found to have one thing in common and that is there was a significant amount of non-recycled plastics, like plastic bags and some plastic bottles. Columbia University Earth Engineering Center, these plastics have a calorific value of approximately 32 MJ/kg [12].
0 5 10 15 20 25 30
Average CV of MSW per site (MJ/kg)
Fig. 3. Calorific values of each site on average with overall average.
TABLEI:CALORIFIC VALUE OF NON-RECYCLABLE PLASTICS (NRP) BROKEN DOWN INTO THE DIFFERENT CONSTITUENTS THAT MAKES UP THE
MATERIAL [12]
Materials % in NRP MJ/kg MJ/kg NRP
Polyethylene terephthalate
(PET) 12.4 24 2.93
High density polyethylene
(HDPE) 17.8 44 7.76
Polyvinyl chloride (PVC) 5.5 19 1.05
Low density polyethylene/ Linear low density polyethylene (LDPE/LLDPE)
19.6 28 5.39
Polypropylene (PP) 13.9 44 6.08
Polystyrene (PS) 8.70 41 3.56
Other 22.0 5.55
Total NRP 100 31.96
value. As mentioned earlier, the averaged range is between 15 and 25 MJ/kg. The areas with calorific value of approximately 15 MJ/kg had MSW of similar composition as displayed in Fig. 2; however the organics fraction in these areas was found to be much higher. The Woodstock site for instance possesses the lowest calorific values. This is due to the fact that the sample from Woodstock is mainly comprised of biomass which is essentially only wood chippings. Wood has a calorific value of about 14.4 MJ/kg according IGNIS Energy and the average for Woodstock was 14.8 MJ/kg which is fairly consistent. This site along with Coastal Park and Belharexhibit similar characteristics in terms the waste composition and calorific value. The common factor among these sites is that they are all situated near residential areas thus the waste is mainly from domestic sources which is mostly kitchen waste and garden waste, of which both fall under the organic fraction of the waste. The higher CV sample sites are situated in densely populated areas where industry and commerce are dominant meaning that the waste contains mostly plastic (packaging, bottles, carrier bags etc.), paper (office paper, cardboard packaging etc.) and still with some domestic waste from residential complexes. However this domestic waste understandable doesn’t have garden waste as residences are in a city center like setting.
TABLEII:PERCENTAGE MUNICIPAL WASTE CONTRIBUTION BY PROVINCE IN SOUTH AFRICA,2011[3]
Province kg/capita/annum Waste generated as % of Total waste
Western Cape 675 20
Eastern Cape 113 4
Northern Cape 547 3
Free State 199 3
KwaZulu Natal 158 9
North West 68 1
Gauteng 761 45
Mpumalanga 518 10
Limpopo 103 3
TABLEIII:MODELED WASTE DATA [3] General
Waste 2011
Generated Recycled Disposed Recycled
Tonnes %
Municipal waste
7, 88 - 7, 88 0
Organic waste 2, 95 1, 03 1, 92 35
Construction and demolition waste
4, 73 0, 756 3, 97 16
Paper 1, 69 0, 966 0,728 57
Plastic 1, 28 0, 230 1, 05 18
Glass 0, 938 0, 300 0, 637 32
Metals 3, 12 2, 49 0, 624 80
Tyres 0, 247 0.00987 0, 237 4
Other 36,2 - 36,2 0 Total general
waste [T]
59, 0 5, 79 53, 2 10
The 15 to 25 MJ/kg result obtained is quite a vast range and just averaging from that does not give a very accurate picture in terms of the calorific value of MSW in Cape Town. Thus it was decide that a composite sample must be prepared and analysed to get a more reputable idea of what the calorific value of the city’s MSW would be on an overall
basis (see Fig. 4). In comparison of the results in Fig. 3 and Fig. 4, it is deduced that the latter representing the composite sample ranges between 13 and 23 MJ/kg. However, with the composite, only one sample out of 10 runs was at the extreme low of 13 MJ/kg, as the other reading ranged from approximately 17 to 23 MJ/kg which is not as vast. This shows that the sample is fairly close to being homogeneous which means it is a good representative sample for the overall energy content of the city’s MSW.
0 5 10 15 20 25
CV
of
composite
sample
(MJ/kg)
Fig. 4. Calorific value of composite sample and overall average.
In comparing the average CV for the composite sample and the average from the site samples, it is established that the average is reasonable close as the composite averaged out at 18.9 MJ/kg while the site sample overall average was found to be 19 MJ/kg. This indicates that it can be assumed with good reason that the average Calorific Value of the MSW is approximately 19 MJ/kg.
Studies conducted in India, Germany and Japan, show calorific values of 12-13 MJ/kg, 15-18 MJ/kg and 18 to 20MJ/kg respectively [14]. These calorific values were obtained from RDF pellets manufactured from MSW. On average, RDF is expected to have calorific value ranging from 12 to 15 MJ/ kg [14]. Interestingly so, the RDF from India with its low calorific value compared to others is used as fuel for electricity generation, thus the MSW from Cape Town is more than appropriate for the same type of application in terms of CV. It is reported that the energy –return-on-energy-invested (EROEI), for the RDF from India is in the range of 10 to 15. This is referred to as the ratio between the energy provided by a certain fuel and the energy required in the acquiring and delivery of this energy [15]. The 10 to 15 range can be compared to the EROEI of a crude oil well of approximately 2000m in depth which is quite significant [14].
In this study, the RDF pellets produced were of the same diameter of approximately 18mm with varying ratio of the starch binder used. The ratio’s used in terms of starch content to MSW in the production of the pellets were 0:1, 0.5:1, 1:1 and 2:1 with pellet density of 326, 461, 516, and 641 kg/m3. RDF pellet density is a measure of its hardness ranging from 250 to 700 kg/m3 which relates to a measure of soft to very hard [16]. These results show that the pellet density is directly proportional to the amount of binder added during pelletization.
however the range of the CV from the pelletized samples was somewhat more narrow ranging from 16.8 to approximately 20 MJ/kg. This shows that the pelletized MSW or RDF is more homogenous than the unprocessed waste.
B. Thermal Degradation Behavior of MSW
Thermal degradationof the MSW was studied using TGA. A total of 6 different samples were studied and the comparison was aimed at studying the effect of the starch content on the degradation behavior of the RDF pellets produced. Also the thermal degradation of the unpelletized MSW was analyzed including that of virgin biomass which is normally the conventional feedstock for alternative fuel production applications due to its homogenous nature in terms of composition which allows ease of operation in production plants. The results obtained are presented in Fig. 5 below.
Fig. 5. TGA curves describing thermal degradation of various RDF.
In analysis of the results obtained, it can be deduced that from all the RDF pellet samples including the unpelletized MSW sample exhibit a similar trend in terms of the thermal degradation behavior. It can be distinguished that all the samples, except the virgin biomass, show 3 distinct regions of major mass loss. Out of the 3 distinguishable regions, the second region of major mass loss is observed to have the most significant mass loss.
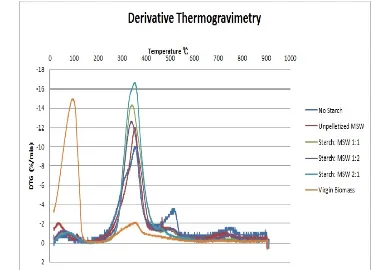
Fig. 6. DTG curves describing the rate of mass loss with temperature.
This is also evident in the Derivative Thermogravimetry (DTG) which describes the rate of mass loss with temperature for the samples. A third region of major mass loss is not easily disguisable from the TGA curves, however the DTG shows slight peaks after the second major peak which indicates a third region of mass loss. Taking into consideration that the analysis takes place in a nitrogen environment (inert), it can be stated that the samples were thermally degraded in pyrolytic conditions. Therefore, each
degradation step can be attributed to the attributes of the samples which would be obtained in proximate analysis. The first region of mass loss can be attributed to the removal of all moisture content present in each sample. Thus the 2nd and 3rd regions describe the removal of all volatile matter from the samples. The average percentage of mass remaining at the end of the analysis for the pellet samples and the unpelletized MSW was found to be approximately 24% which is attributed to the ash content. This means that the samples are degraded by approximately 76% which is quite significant if looking at it in the perspective of size reduction of the waste.
The removal of moisture content begins at temperatures around 55°C as the TGA and DTG curves show a slight decrease and peak respectively around this temperature and this decrease of TGA curve continues to approximately 265°C. On average, for all pelletized MSW samples (RDF) and the unpelletized MSW, this amount to approximately 7% of the sample degraded thus can be correlated to a moisture content of about 7% for these samples. The boiling point of water is 100°C which explains the evaporation of moisture in this region of mass loss. A study of combustion characteristics of RDF in oxygen environment shows similar kind of behavior at temperatures between 50 and 150°C[17].
The removal of volatile matter distinguished by a massive decrease in the TGA curve and a very high peak in the DTG curve occurs at temperatures approximately between 270 and 410°C accounting to an average mass loss for the unpelletized MSW and RDF pellets of 51% from the previous degradation region. During this phase of decomposition of volatiles, taking into consideration the mixed nature of the MSW used in this study, cellulose being the major component in paper materials, hemicellulose, lignin as well as any inorganic components in the waste are completely de-volatized and the crystallinity and degree of polymerization of these polymers will impact the degradation behavior [17], [18]. Decomposition of fixed carbon is not expected as analysis is carried out in an inert atmosphere.
The third major loss region is not so evident in the TGA curve; however slight peaks are noticeable in the DTG curves, more especially with the ‘No Starch’ pellet sample as this shows a region of increase in rate of decomposition. This mass loss phase is attributed to the removal of more volatile matter from temperatures of approximately 410°C from the preceding peak to approximately 502°C. In total, the amount of volatile matter removed on average for all samples was found to be approximately 69% of the MSW samples (RDF Pellets and unplelletized).
The degradation behavior of these samples along with the estimated proximate analysisvalues approximated from the TGA data correlate with several studies conducted with RDF and raw MSW with respect to thermal processing and pretreatment [14] and [19], comparison of fuel value and combustion characteristics [17], [20] and the pyrolysis of RDF [21].
found to be decreasing. This can be directly linked to the density of the RDF pellets produced. The starch to MSW ratio was found to be directly proportional to the density of the final pellet product. This then shows that the more dense the sample is, the more stable the thermal degradation behavior observed. Taking into consideration, the pellet sample of starch to MSW ratio 2:1 being the sample with the most amount of starch was found to have less than 20% ash content and all others were found to be above 20% with each ratio varying in terms of the fact that starch content was inversely proportional to the ash content at the end of analysis. This sample was also found to show the most stability in terms of thermal degradation behavior.
IV. CONCLUSION
The study conducted using MSW from the City of Cape Town Municipality in South Africa shows that the MSW has a calorific value of approximately 19 MJ/kg which is significantly high meaning that the waste can be directly used as fuel in many applications but more importantly that of electricity generation. The MSW can be convertedinto RDF pellets for direct use as boiler or furnace fuel for the production of high pressure steam in power generation.
This is not the only possibility, more advanced thermochemical conversion techniques can also be applied to the waste in order to obtain high value products like fuel gases and liquid fuel products. This then warrants the understanding of the thermal degradation behavior of the MSW.
Using TGA in inert atmosphere, which can be related to that of pyrolysis, 3 distinguishable major mass loss regions were found between temperatures 55 - 265°C, 270 - 410°C and 410 - 502°C. The total sample reduction was found to be 76% which is quite significant reduction of the waste. Studies have shown that oxygen availability in the process shows higher size reduction. This is because the process moves more towards combustion which produces CO2 [19].
This is significant if a gasification process is to be applied as it also uses oxygen but less than stoichiometric requirements to create reducing conditions for the production of what is called syngas which can be converted to various valuable fuel products.
ACKNOWLEDGMENT
All the authors would like to thank Cape Peninsula University of Technology for funding towards the project and attendance at the conference.
REFERENCES
[1] D. Kilian, H. Fiehn, J. Ball, and S. Lewis, “National state of the environment project background research paper produced for the South Africa,” December, pp. 1–37, 2005.
[2] S.-A. Engledow, “Integrated analysis solid waste baseline report,”
Environ. Conserv., 2007.
[3] DEA and D. of E. Affairs, “National waste information baseline report,” 2012.
[4] C. Town, “An introduction to the city of cape town integrated waste management by-law,” 2009.
[5] I. Adefeso, D. Ikhu-Omoregbe, and A. Rabiu, “Sustainable co-generation plant: Refuse-derived fuel gasification integrated with high temperature PEM fuel cell system,” vol. 33, pp. 125–129, 2012.
[6] M. Aucott, “The fate of heavy metals in landfills: A review by ‘industrial ecology, pollution prevention and the NY-NJ Harbor,’” February, 2006.
[7] DEAT, “State of environmental systems,” 2006.
[8] A. A. Adesuyi, K. L. Njoku, and M. O. Akinola, “Assessment of heavy metals pollution in soils and vegetation around selected industries in Lagos State , Nigeria,” September, pp. 11–19, 2015.
[9] A. Odukoya and A. Abimbola, “Potential soil contamination with toxic metals in the vicinity of active and abandoned dumpsites,” Agric. Biol. J. North Am., vol. 2, no. 5, pp. 785–790, 2011.
[10] D. P. Zine, J. Hahn, B. Parks, and G. Smith, “Evaluation of alternative solid waste processing technologies,” p. 500, September 2005. [11] H. S. Fogler, Elements of Chemical Reaction Engineering, vol. 42.
Prentice Hall, 2006.
[12] N. J. Themelis and C. Mussche, “2014 energy and economic value of municipal solid waste (MSW), including non-recycled plastics (NRP), currently landfilled in the fifty states,” 2014.
[13] Y. Zhang, Y. Chen, A. Meng, Q. Li, and H. Cheng, “Experimental and thermodynamic investigation on transfer of cadmium influenced by sulfur and chlorine during municipal solid waste (MSW) incineration,”
J. Hazard. Mater., vol. 153, no. 1–2, pp. 309–319, 2008.
[14] J. C. Jones, Thermal Processing of Waste. 2010.
[15] C. A. S. Hall, J. G. Lambert, and S. B. Balogh, “EROI of different fuels and the implications for society,” Energy Policy, vol. 64, pp. 141–152, 2014.
[16] L. E. N. V Gr, “Review of alternative pre-treatment equipment,” pp. 1–10, 2013.
[17] Y. Li, L. Jiang, N. Zhao, Y. Li, R. Li, and Y. Chi, “Combustion characteristic of refuse derived fuel under oxygen-enriched atmosphere,” pp. 1–5, 2003.
[18] F. L. Bradfield, “Examination of the thermal properties of municipal solid waste and the scalability effect on its degradation and pyrolysis products by,” December 2013.
[19] A. Badeie, “Thermal pretreatment of municipal solid waste,” no. 7, 2013.
[20] A. Sever Akdağ, A. Atımtay, and F. D. Sanin, “Comparison of fuel value and combustion characteristics of two different RDF samples,”
Waste Manag., 2015.
[21] J. Kluska and M. Klein, “Pyrolysis of biomass and refuse-derived fuel performance in laboratory scale batch reactor,” vol. 35, no. 1, pp. 141–152, 2014.
A. Hlaba was born in the town Umtata and raised in Butterworth, Eastern Cape Province in South Africa on April 11, 1991. Hlaba obtained his national diploma in chemical engineering in 2013 and the B-Tech degree in chemical engineering in 2015 both at the Cape Peninsula University of Technology, South Africa. He is currently undergoing his master’s program at the same institution.
A. Rabiu holds a BSc (Hons) and an MSc in chemical engineering from Obafemi Awolowo University, Nigeria, the B-Tech in project management and the MPhil in commercial law. Ademola is presently a senior lecturer with Cape Peninsula University of Technology, CPUT where he is teaching process design and petroleum production technology. His research interests are sustainable energy technology which include thermo-chemical conversion of wastes to fuels; processing of conventional and non-conventional petroleum resources and sustainable resources.
Dr. Osibote assumed a faculty position in the Department of Physics, Olabisi Onabanjo University in 1995 and presently in the Department of Mathematics and Physics, Cape Peninsula University of Technology, South Africa. She has carried out research on several areas including irradiation of foodstuffs, measurement of radioactivity in food and environmental fields, quality assurance in diagnostic radiology and in the developments of
![Fig. 1. The waste composition for general waste, 2011 (percentage by mass) [3].](https://thumb-us.123doks.com/thumbv2/123dok_us/1379112.1648450/1.595.365.493.634.763/fig-waste-composition-general-waste-percentage-mass.webp)
![TABLE BROKEN DOWN INTO THE I: CALORIFIC VALUE OF NON-RECYCLABLE PLASTICS (NRP) DIFFERENT CONSTITUENTS THAT MAKES UP THE MATERIAL [12]](https://thumb-us.123doks.com/thumbv2/123dok_us/1379112.1648450/3.595.315.539.186.350/table-broken-calorific-recyclable-plastics-different-constituents-material.webp)
![TABLE II: PERCENTAGE MUNICIPAL WASTE CONTRIBUTION BY PROVINCE IN SOUTH AFRICA, 2011 [3]](https://thumb-us.123doks.com/thumbv2/123dok_us/1379112.1648450/4.595.43.292.370.706/table-percentage-municipal-waste-contribution-province-south-africa.webp)