International Journal of Engineering Research and Development
e-ISSN: 2278-067X, p-ISSN: 2278-800X, www.ijerd.com
Volume 13, Issue 9 (September 2017), PP.12 - 17
Air Pollution Evaluation Methods
1
Gaurav Kumar*
2Rakesh Kumar Sharma
1Department of Mathematics, NAS College, Meerut 2Department of Mathematics, SGPG College, Sarurpur, Meerut
Corresponding Author: Gaurav Kumar*
ABSTRACT:
Pollution is a pervasive phenomenon of economic growth and development causing harm to society. It refers to the residual flows that arise from anthropogenic sources and enter the environmental systems. An economic externality is said to be present when the activities of some economic agents affect positively or negatively the other agents who do not have control over them. Air and water pollution, deforestation and land degradation are some of the environmental externalities generated by the various development activities in the economy. Air pollution not only affects health of human beings but also affects property prices. This paper intends to present a framework based on hedonic regression and artificial neural network to evaluate air pollution as a commodity.Keywords:
Air Pollution, Environment Valuation, Hedonic Regression, Artificial Neural NetworkI.
AIR POLLUTION
Poor air quality is one of the most serious environmental problems in urban areas around the world especially in developing countries. The air pollution problem has received whose attention during the last decades whereby there has been a signification increases in public awareness of potential dangers caused by chemical pollutants and their effects on both human being and the environment. Air pollution is defined as the presence of one or more contaminants in the atmosphere in such quantity and for such duration as it is injurious or tends to be injurious to human health or welfare, animal or plant life. It can also be defined as the contamination of air by the discharge of harmful substances. There are two aspects of air pollution:
Concentration of pollutants in the vicinity of the source of pollution
Dispersion of pollutants with the movement of wind
Air pollution is caused mainly by three sources: indoor, stationary and mobile. The air pollution problem in urban areas is originated mainly by the mobile source or the vehicular emissions. The world health organization (WHO) has classified Delhi as one of the most polluted cities in the world along with Mexico City, Seoul and Beijing. The Central Pollution Control Board (CPCB) monitors air quality at various centers in Delhi. The State Pollution Control Board (SPCB) measures air quality at different major cities of the state. Ghaziabad and Noida are two big industrial cities of Uttar Pradesh state of India. These two are part of National Capital Region (NCR) of India and therefore have importance in the development and growth of NCR. These two cities have seen tremendous growth in last two decades. This growth has resulted in the growth of population, vehicles and industrial activities. The growth has resulted in the increase of air pollution beyond the safe level. The major sources of air pollution in these two cities are vehicles and industries. The reduction in the level of different pollutants of air pollution is expected to result in substantial benefits in various sectors of human life. These benefits are classified as user and non-user benefits. The user benefits are recreational benefits, aesthetic enjoyment values and health benefits of the people who visit and use the resource. The non-user benefits (Krutilla 1997; Krutilla and Fisher 1997) are benefits to those who may not be visiting the site but still feel that they will be getting some benefits by knowing that the particular environmental resource is in existence or preserved. The non-users may possess bequest and stewardship motives in putting values on the environmental resources. There is another category of benefits which is called the option value (Weisbrod ,1964), a premium a potential future user of the resource would like to pay over and above his expected future user benefits for availing the option of visiting the resource in future. Therefore user and non-user benefits and option value benefits constitute the total environmental benefits.
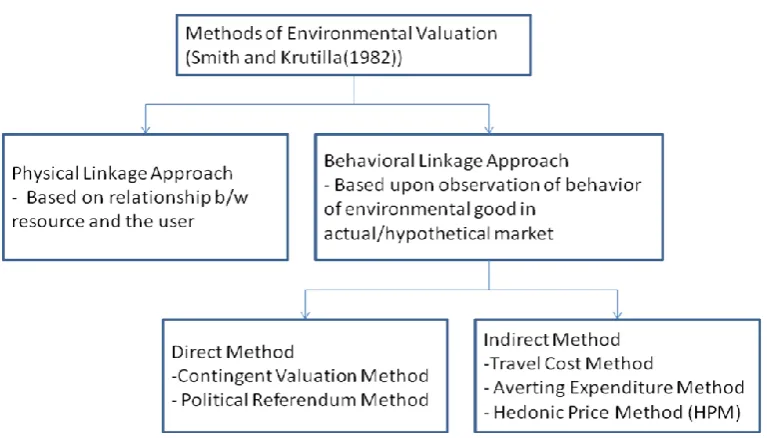
1.1 Methods of Evaluating Air Pollution:
Figure 1: Methods of Environmental Valuation
1.2 Hedonic Method
The word hedonic refers to pleasure which can be linked to the perceived value each part a good or service has to someone. Hedonic method is used to determine the value of a good or service by considering it as a function of its component parts. The basic premise is that the every good or service is a function of its component parts. The value of the good or service therefore depends on the value of its component parts. The value of each component is then determined through regression analysis. This method is also used to estimate economic values for ecosystem environmental services that directly affect market prices. It is most commonly applied to variations in housing prices that reflect the value of local environmental attributes. It can be used to estimate economic benefits or costs associated with:
environmental quality, including air pollution, water pollution, or noise
environmental amenities, such as aesthetic views or proximity to recreational sites
The basic premise of the hedonic pricing method is that the price of a marketed good is related to its characteristics, or the services it provides. The hedonic pricing method is most often used to value environmental amenities that affect the price of residential properties. The term hedonic was used to describe “the weighting of the relative importance of various components among others in constructing an index of usefulness and desirability” (Goodman, 1978). Rosen (1974) defines hedonic prices as “the implicit prices of attributes and are revealed to economic agents from observed prices of differentiated products and the specific amounts of characteristics associated with them” (Ustaoğlu, 2003). Rosen (1974), comprehensively laid down a theoretical foundation for determining the bid price, or implicit value of the attributes of a commodity for different consumers. The bid price is defined as the maximum amount of money which a consumer is willing to pay for a good under the condition that he or she retains a specific level of happiness or utility. He proposed to utilize the information from the tangent of the market price curve with which the consumers or producers share the same value of the equilibrium conditions. The methods used to identify the consumer’s bid price function and the producer’s offer function was fully discussed by him. The offer function is defined as a function to determine the minimum value of price which a producer should accept to sell a good for a certain profit. In a hedonic price model, there are two equations to be estimated – The hedonic price function and the individual’s marginal willingness-to-pay function for improved quality. The equations for hedonic function are given as –
( ,
, )
P
P S N Q
Air Pollution Evaluation Methods
The partial derivative of (1) with respect to one of the environmental quality characteristics qjlike tree cover or air quality gives the implicit marginal price of that characteristic or marginal valuation of environmental quality by the individual in the market for houses (bij).
hi ij j
P
b
q
(2) In the second stage, marginal willingness to pay for environmental quality is expressed as a function of Si, Ni, Qi and socio-economic characteristics (Gi)(
,
,
, G )
ij ij i i i i
b
b Q S N
(3) Equation (3) gives the individual’s marginal willingness to pay for the improvement in the environmental quality. If there is an improvement in the environmental characteristic from qj0to qj1, the value individual places on such an improvement (Bij) could be estimated by integrating (3) with respect to qj –
1
0
*
B
(q ,
,
,
, G )
j
j
q
ij ij j i i i i j
q
b
Q
S N
q
(4)
1.3 Artificial Neural Network:
Artificial neural networks are used in three main ways:
as models of biological nervous systems and “intelligence”
as real-time adaptive signal processors or controllers implemented in hardware for applications such as robots
as data analysis methods
1.3.1 ANN Basic Methodology:
A neural network system is an artificial intelligence model that replicates the human brain’s learning process. The brain’s neurons are the basic processing units that receive signs from and send signals to many nervous system channels throughout the human body. When the body senses an input experience, the nervous system carries many messages describing the input to the brain. The brain’s neurons interpret the information from these input signals by passing the information through synapses that combine and transform the data. A response is ultimately created when the information processing is complete. Through repetition of stimuli and feedback of responses, the brain learns the optimal processing and response to the stimuli. The brain’s actual leaning path is still somewhat of a chemical mystery; what is known is that learning does occur and reoccur through the repetition of the input stimuli and the output response.
Artificial neural network is an interconnected group of artificial neurons that uses a mathematical model or computational model for information processing based on a connectionist approach to computation. It is a network of simple processing elements which can exhibit complex global behavior determined by the connections between the processing elements and element parameters. It is an adaptive system that changes its structure based on information that flows through the network. ANNs learn by example.
1.3.2 Neural Network Architecture:
An ANN is a data processing system consisting of large number of simple highly interconnected processing elements as artificial neuron in a network structure that can be represented using a directed graph G, an ordered 2-tuple (V,E), consisting of a set of vertices V and a set of edges E. ANNs are of following types:
1.3.3 Single Layer Feed Forward Network:
Figure 2: Feed Forward Network
The inputs received by a single processing element can be represented as an input vector X= (x1, x2,…
xn), where xi is the signal from the ithinput. A weight is associated with each connected pair of neurons. Hence weights connected to the jth neuron can be represented as a
weight vector of the form Wj= (w1j, w2j, …, wnj), where wi j represents the weight associated to the connection between xi and yj. A neuron contains a threshold value that regulates its action potential. While action potential of a neuron is determined by the weights associated with the neuron’s inputs (Eq. 5), a threshold modulates the response of a neuron to a particular stimulus confining such response to a pre-defined range of values. Equation (6) defines the output y of a neuron as an activation function f of the weighted sum of n+1
inputs. These n+1 correspond to the n incoming signals. The threshold is incorporated into the equation as the extra input –
𝑆𝑈𝑀 = 𝑛 𝑥𝑖𝑤𝑖
𝑖=1 (5)
𝑦 = 𝑓( 𝑛𝑖=0𝑥𝑖𝑤𝑖 ) (6)
where function f(x) could be chosen as Saturation, Sigmoid or Hyperbolic tangent function.
1.3.4 Multi Layer Feed Forward Network:
It consists of multiple layers. The architecture of this class of networks also has one or more intermediary layers called hidden layers. The computational units of the hidden layer are known as hidden neurons. Multi Layer networks normally have three layers of processing elements with only one hidden layer, but there is no restriction on the number of hidden layers. The only task of the input layer is to receive the external stimuli and to propagate it to the next layer. The hidden layer receives the weighted sum of incoming signals sent by the input units (Eq. 5), and processes it by means of an activation function. The activation functions most commonly used are the saturation, sigmoid and hyperbolic tangent functions. The hidden units in turn send an output signal towards the neurons in the next layer.
Air Pollution Evaluation Methods
Figure 3: Multi Layer Feed Forward Network
1.3.5 Recurrent Networks:
The recurrent networks differ from feed forward architecture. It has at least one feedback loop. There could also be neurons with self-feedback links i.e. the output of a neuron is feedback into itself as input.
1.4 Valuation of Air Pollution:
Hedonic regression and artificial neural network both can be used to evaluate air pollution for property prices. For this, an output variable has to be identified. This output variable can be taken as House Rent. Next we identify independent variables of which House Rent will be modeled as a function. These parameters can be taken as Covered Area, Type of the House, Number of Rooms, Indoor Sanitation, Distance from Business Centre, Distance from National Highway, Distance from Slum, Distance from Industry, Distance from Shopping Centre, Annual Income of Household, Distance from Airport, Distance from Railway Station, Distance from State Transport Terminus, Green Cover, Water Supply, Quantity of Air Pollutants viz Particulate Matter PM10, SO2, NO2.
Then we build hedonic property price function using multiple regression. Different functional forms can be considered to construct this function. Some of well known forms are linear, semi-log and log-log forms. Then as per equation (2), the change in house rent vis a vis air pollutants can be calculated.
Artificial neural network model can also be built using different activation functions for hidden and output layers. The model contains independent variable analysis, using which importance of an independent variable in prediction of output variable can be calculated.
II.
CONCLUSION
REFERENCES
[1]. A. M. Freeman III, “Air pollution and property values, a further comment”, Review of Economics and Statistics, vol. 56, pp. 554– 556, Nov. 1974
[2]. Anderson, J. A., Rosenfeld E., “Neurocomputing”, Cambridge, MA:MIT Press, 1988
[3]. B. R. Beloff, E.R. Beaver, and H. Massin, “Assessing societal costs associated with environmental impacts”, Environmental Quality Management, vol. 10, no. 2, pp. 67–82, Winter 2000
[4]. Babu B.V. and V. Ramakrishna. “Mathematical modeling of site sensitivity indices in the site selection criteria for hazardous waste Treatment, Storage and Disposal Facility”, Journal of the IPHE, 2000 (1), pp. 54-70, 2000
[5]. Bao, H. X. H., Wan, A. T. K., “On the Use of Spline Smoothing in Estimating Hedonic Housing Prices Models: Empirical Evidence using Hong Kong Date”, Real Estate Economics, 32(3), 487-507, 2004
[6]. Bartlett, P.L., “The sample complexity of pattern classification with neural networks: The size of the weights is more important than the size of the network”, IEEE Trans. Inf. Theory, 44, 525–536, 1998
[7]. Berry, J. A., Lindoff, G., Data Mining Techniques, Wiley Computer Publishing, ISBN 0-471-17980-9, 1997
[8]. Bin, O., “ A Prediction Comparison of Housing Sales Prices by Parametric vs Semi-parametric Regressions”, Journal of Housing Economics, 13, 68-84, 2004
[9]. Bougoudis, I.; Demertzis, K.; Iliadis, L., “HISYCOL a hybrid computational intelligence system for combined machine learning: The case of air pollution modeling in Athens”, Neural Comput. Appl., 27, 1191–1206, 2016
[10]. Fan, G., Ong, Z. S. E., Koh, H. C., “Determination of House Price: A Decision Tree Approach”, Urban Studies, 43(12), 2301-2315, 2006
[11]. Hill, R.J. and D. Melser, “Hedonic Imputation the Price Index Problem: An Application to Housing”, Economic Inquiry, Vol. 46 No.4, 593-609, 2008
[12]. Idris, I., Selamat, A., Nguyen, N.T., Omatu, S., Krejcar, O., Kuca, K. and Penhaker, M., “A Combined negative selection algorithm-Particle Swarm Optimization for an Email Spam Detection System”, Engineering Applications of Artificial Intelligence, 39, 33-44, 2015
[13]. Liu, D., Yuan., Y., Liao, S.,(2009), “Artificial neural network vs. Nonlinear Regression for gold content estimation in Pyrometallurgy”, Expert Systems with Applications, 36 : 10397-10400, 2009
[14]. Pranali Borele, Dilipkumar A. Borikar, “An Approach to Sentiment Analysis using Artificial Neural Network with Comparative Analysis of Different Techniques”, IOSR Journal of Computer Engineering, 18(2), 64-69, 2016
[15]. R. B. Palmquist, “Estimating the demand for the characteristics of housing”, Review of Economics and Statistics, vol. 66, no. 3, pp. 394– 404, Aug. 1984
[16]. R. Valencia, G. Sanchez, I. Diaz, “A General Regression Neural Network for modeling the behavior of PM10 concentration level in Santa Marta, Columbia”, ARPN Journal of Engineering and Applied Sciences, 11(11), 2016
[17]. Si T. and Sujauddin Sk., “A Comparison of Grammatical Bee Colony and Neural Networks in Medical Data Mining”, International Journal of Computer Applications, 134(6), 1–4, 2016
[18]. Smith, K., Palaniswamy, M., Krishnamoorthy, M., “A hybrid neural approach to combinatorial optimization”, Computers and Operations Research, 23(6), 597–610, 1996