e-ISSN: 2278-7461, p-ISSN: 2319-6491
Volume 6, Issue 10 [October. 2017] PP: 77-86
Evaluation and Effects of a Technical and Non-Technical Losses
on 11kv and 33kv Feeders, a Case Study of Baga Road
Substation, Maiduguri
Muhammad Alkali Abbo
1, Dr. Musa Umar Bukar
2, Abubakar Mustapha Kura
31(Department of Electrical and Electronics Engineering, Ramat Polytechnic Maiduguri, Nigeria)
2(Department of Electrical and Electronics Engineering, University of Maiduguri, Nigeria)
3
(Department of Electrical and Electronics Engineering (PG Student), University of Maiduguri, Nigeria) Corresponding Author: Muhammad Alkali Abbo
ABSTRACT:
An attempt is made to reduce the various power losses in practical distribution systems. Power System faces a big problem of distribution losses. In this paper, distribution power losses are calculated by taking daily loading for a month of some feeders of one part of the city. Analyses of various types of distribution losses of radial distribution network are also considered. It is was observed that, in a distribution power system, more than 40% power loss are due to technical, non- technical and administrative losses. A new attempt of calculation of various distribution losses in power system and their economic effect on the utility are introduced. With the help of the case study of Baga Road distribution substation, Maiduguri city, Nigeria some detailed explanation of the losses are also stated in the paper.Keywords:
distribution, feeder, losses, power, substation--- --- Date of Submission: 28-08-2017 Date of acceptance: 09-11-2017
---I.
Introduction
Electric power losses are wasteful energy caused by external factors or internal factors, and energy dissipated in the system. These include losses due to resistance, atmospheric conditions, theft, miscalculations, etc., and losses incurred between sources of supply to load canter (or consumers). Loss minimization and quantification is very vital in all human endeavours. In power system, it can lead to more economic operation of the system. If we know how the losses occur, we can take steps to limit and minimize the losses. Consequently, this will lead to effective and efficient operation of the system. Therefore, the existing power generation and transmission can be effectively used without having the need to build new installations and at the same time save cost of losses. Basically, losses in electrical power system can be identified as those losses caused by internal factors known as Technical losses and those caused by external factors which are called non-technical losses. The Nigerian electricity grid has a large proportion of transmission and distribution losses - whopping 40%. This is attributed to technical losses and non-technical losses. Due to the size of the area the power system serves, the majority of the power systems are dedicated to power transmission. Generally, system losses increase the operating cost of electric utilities and consequently result in high cost of electricity. Therefore, reduction of system losses is of paramount importance because of its financial, economic and socio-economic values to the utility company, customers and the host country. However, low losses in transmission system could be achieved by installing generating stations near the load centres.
Distribution power losses can be divided into two categories; also technical and non-technical losses. The technical losses are related to the material properties and its resistance to the flow of the electrical current that is dissipated as heat. The most obvious examples are the power dissipated in distribution lines and transformers due to their internal electrical resistance. In addition, technical losses are easy to be simulated and calculated. On the other hand, non-technical losses are caused by clandestine connections, frauds in energy meters, diversity of readings and deficiencies (or losses) in the processes of energy measurement.
High rate of technical and non-technical losses might occur due to: · Poor quality of service offered to customers;
· High cost due to useless or premature investments;
· Reduction in revenue resulting in cash difficulties with all ensuing economic consequences.
connection extensions and measurement systems. Transformer losses can be classified into two components, namely, no-load and load losses. No-load losses occur from the energy required to retain the continuously varying magnetic flux in the core and its invariant with load on the transformer. Load loss mainly arises from resistance losses in the conducting material of the windings and it varies with loading. The cost of losses is the most important factor in selecting a transformer because it is quite possible for the estimated value of future losses to exceed the first cost of a transformer. Therefore, the right balance between the initial expenses and the upcoming loss expenses should be considered when buying a transformer.
One of the main sources of losses in the distribution system is the copper losses in power overhead lines and cables. Furthermore, unbalanced loading is another factor that can contribute to the line losses, where if one of the phases has more load than the other two, the losses will be larger than that if these phases are balanced. Temperature rise introduces significant increase of power consumption, where the power loading can increase by 3.75 % for 1 °C temperature rise. For the rainy day with higher humidity and lower temperature, a negative correlation among the power consumption was also found. On the other hand, the temperature change has less effect to feeder power losses because transformer losses dramatically contribute more in the power losses.
II.
Materials and Methods
2.1 Introduction
The power losses on each of the 11kV feeders are obtained on the basis of the daily maximum loading on the feeders, resistance, size of each feeder conductor, route length of each feeder and maximum current drawn from each feeder conductor.
Equations (1) to (3) were used for computation. Current drawn from feeder (IL)
IL =
𝑃
3 𝑉𝑝 .𝑓 (1)
R = ρℓ L
𝐴 (2)
Where P is Power in Mega Watts, V is voltage in Volts, ρ is resistivity in Ωm, R is resistance in Ω, A is cross sectional area in mm2, and L is route length of the feeder in kilometer.
Power loss = I2LR (3)
Hence, power loss is power received less power consumed. Data were collected on:
i. Daily return on loading of 33kV and 11kV feeders.
ii. Feeder route length and distance between transformers are as follows: 1. Mafoni 11kV feeder route length is equal to 5.95km;
2. Zabarmari 11kV feeder length is equal to 13.6km;
3. Benishiek 33kV feeder (1) route length is equal to 10.16km;
4. University Campus 33kV feeder (7) route length is equal to 18.05km.
Aluminium conductor (AAC) of size 150mm2 with resistivity of 2.82×10⁻⁸ Ωm was used for both feeders and distributors. The sample data collected are shown in Tables 1 to 5 from which power losses were obtained for 11kV and 33kV for the months of April and September 2016 respectively.
Mafoni Feeder (11kv)
Maximum loading = 8.74MW Line voltage (V) = 11kV Power factor (p.f) = 0.8
Cross sectional area of conductor =150mm2 Route length (L) = 5.95km
Resistivity ℓ = 2.82 x10⁻⁸ Ωm
Current drawn from feeder (IL)
IL =
𝑃 3 𝑉𝑝 .𝑓 =
8.74𝑥106
3 𝑥11𝑥103𝑥0.9 = 573.41A
R = ℓρ L 𝐴 =
2.82x10⁻⁸𝑥 5.95𝑥103
Power loss = I2LR = (573.41)2 x 1.12 = 0.368MW
Zabarmari Feeder (11kv) Maximum loading = 10.12MW Line voltage (V) = 11kV Power factor (p.f) = 0.8
Cross sectional area of conductor =150mm2 Route length (L) = 13.6km
Resistivity ρ = 2.82 x10⁻⁸ Ωm Current drawn from feeder (IL)
IL =
𝑃 3 𝑉𝑝 .𝑓 =
10.12𝑥106
3 𝑥11𝑥103𝑥0.9 = 663.95A
R = ρ ℓ L 𝐴 =
2.82x10⁻⁸𝑥 13.6𝑥103
150 𝑥10−6 = 2.55Ω
Power loss = I2LR = (663.95)2 x 2.55 = 1.13MW
Benishiek Feeder (33kv) Maximum loading = 11.86MW Line voltage (V) = 33kV Power factor (p.f) = 0.8
Cross sectional area of conductor =150mm2 Route length (L) = 10.16km
Resistivity ρ = 2.82 x10⁻⁸ Ωm Current drawn from feeder (IL)
IL =
𝑃 3 𝑉𝑝 .𝑓 =
11.86𝑥106
3 𝑥33𝑥103𝑥0.8 = 259.37A
R = ℓ ρL 𝐴 =
2.82x10⁻⁸𝑥 10.16𝑥103
150 𝑥10−6 = 1.91Ω
Power loss = I2LR = (259.37)2 x 1.91 = 0.128MW
University Feeder (33kv) Maximum loading = 1.61MW Line voltage (V) = 33kV Power factor (p.f) = 0.8
Cross sectional area of conductor =150mm2 Route length (L) = 18.05km
Resistivity ρ = 2.82 x10⁻⁸ Ωm Current drawn from feeder (IL)
IL =
𝑃 3 𝑉𝑝 .𝑓 =
1.61𝑥106
3 𝑥33𝑥103𝑥0.8 = 35.20A
R = ρℓ L 𝐴 =
2.82x10⁻⁸𝑥 18.05𝑥103
150 𝑥10−6 = 3.39Ω
Power loss = I2LR = (35.20)2 x 3.39 = 0.0042MW
III.
Results and Discussion
3.1 Introduction
As we know that large amount of power is lost as technical and non-technical losses in power systems. So in this work, thus this result will analyse the power losses and also find some solutions on how to minimize them in power system (distribution part).
As mentioned in previously, total distribution system losses equals technical losses plus non-technical losses, the following are some strategies in which both losses can be minimized, viz:
Converting LV line to HV line
Large Commercial/industrial Consumer gets direct line from Feeder
Adopting high voltage distribution service (HVDS) for agricultural customer
Adopting Arial bundle conductor (ABC)
Reduce number of transformer
Utilizer feeder on its average capacity
Replacements of old conductor/cables
Feeder renovation / Improvement program
Industrial/Urban Focus program.
Strictly follow Preventive Maintenance Program
Making mapping /Data of distribution line
Implementation of energy audits schemes
Mitigating power theft by power theft checking drives.
Replacement of Faulty/Sluggish Energy Meter.
Bill collection facility.
Reduce Debit areas of Sub Division
Watchdog effect on users
Loss Reduction programmed
The loading on the four feeders 11kv (Mafoni, Zabarmari) for the month of April, & 33kv (Beniesheik, University) for the month of September 2016 were presented in TABLES 1,2,3 and 4 respectively with their calculated monthly power losses on the feeders. Their graphical representations of the power loading with losses were also shown in figures 1,2,3 and 4.
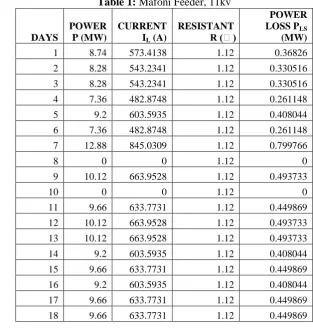
Table 1:
Mafoni Feeder, 11kv
DAYS
POWER P (MW)
CURRENT IL (A)
RESISTANT R (Ω)
POWER LOSS PLS
(MW)
1 8.74 573.4138 1.12 0.36826
2 8.28 543.2341 1.12 0.330516
3 8.28 543.2341 1.12 0.330516
4 7.36 482.8748 1.12 0.261148
5 9.2 603.5935 1.12 0.408044
6 7.36 482.8748 1.12 0.261148
7 12.88 845.0309 1.12 0.799766
8 0 0 1.12 0
9 10.12 663.9528 1.12 0.493733
10 0 0 1.12 0
11 9.66 633.7731 1.12 0.449869
12 10.12 663.9528 1.12 0.493733
13 10.12 663.9528 1.12 0.493733
14 9.2 603.5935 1.12 0.408044
15 9.66 633.7731 1.12 0.449869
16 9.2 603.5935 1.12 0.408044
17 9.66 633.7731 1.12 0.449869
19 9.9 649.5191 1.12 0.4725
20 9.9 649.5191 1.12 0.4725
21 9.2 603.5935 1.12 0.408044
22 8.28 543.2341 1.12 0.330516
23 6.44 422.5154 1.12 0.199942
24 6.9 452.6951 1.12 0.229525
25 7.36 482.8748 1.12 0.261148
26 0 0 1.12 0
27 8.28 543.2341 1.12 0.330516
28 7.87 516.3348 1.12 0.298594
29 6.44 422.5154 1.12 0.199942
30 0 0 1.12 0
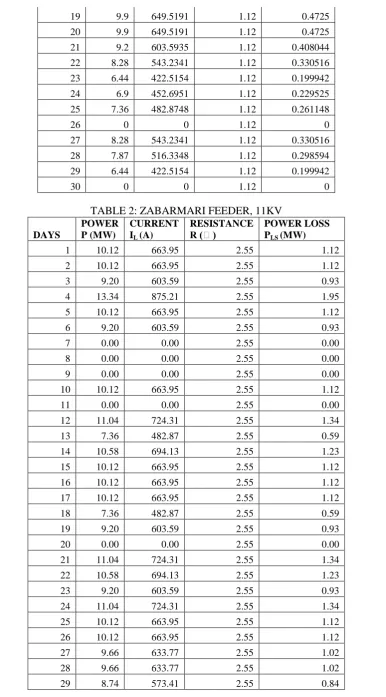
TABLE 2: ZABARMARI FEEDER, 11KV
DAYS
POWER P (MW)
CURRENT IL (A)
RESISTANCE R (Ω)
POWER LOSS PLS (MW)
1 10.12 663.95 2.55 1.12
2 10.12 663.95 2.55 1.12
3 9.20 603.59 2.55 0.93
4 13.34 875.21 2.55 1.95
5 10.12 663.95 2.55 1.12
6 9.20 603.59 2.55 0.93
7 0.00 0.00 2.55 0.00
8 0.00 0.00 2.55 0.00
9 0.00 0.00 2.55 0.00
10 10.12 663.95 2.55 1.12
11 0.00 0.00 2.55 0.00
12 11.04 724.31 2.55 1.34
13 7.36 482.87 2.55 0.59
14 10.58 694.13 2.55 1.23
15 10.12 663.95 2.55 1.12
16 10.12 663.95 2.55 1.12
17 10.12 663.95 2.55 1.12
18 7.36 482.87 2.55 0.59
19 9.20 603.59 2.55 0.93
20 0.00 0.00 2.55 0.00
21 11.04 724.31 2.55 1.34
22 10.58 694.13 2.55 1.23
23 9.20 603.59 2.55 0.93
24 11.04 724.31 2.55 1.34
25 10.12 663.95 2.55 1.12
26 10.12 663.95 2.55 1.12
27 9.66 633.77 2.55 1.02
28 9.66 633.77 2.55 1.02
30 0.00 0.00 2.55 0.00 TABLE 3: BENISHIK FEEDER, 33KV
S/N
POWER P (MW)
CURRENT I(A)
RESISTANCE R (Ω)
POWER LOSS (MW)
1 11.86 259.37 1.91 0.13
2 11.86 259.37 1.91 0.13
3 10.76 235.31 1.91 0.11
4 12.14 265.49 1.91 0.13
5 10.74 234.88 1.91 0.11
6 11.59 253.47 1.91 0.12
7 10.76 235.31 1.91 0.11
8 12.14 265.49 1.91 0.13
9 12.38 270.74 1.91 0.14
10 10.76 235.31 1.91 0.11
11 12.65 276.65 1.91 0.15
12 11.50 251.50 1.91 0.12
13 11.96 261.56 1.91 0.13
14 10.99 240.34 1.91 0.11
15 11.04 241.44 1.91 0.11
16 11.50 251.50 1.91 0.12
17 12.42 271.62 1.91 0.14
18 11.27 246.47 1.91 0.12
19 13.24 289.55 1.91 0.16
20 14.62 319.73 1.91 0.20
21 12.42 271.62 1.91 0.14
22 12.14 265.49 1.91 0.13
23 12.38 270.74 1.91 0.14
24 12.38 270.74 1.91 0.14
25 12.97 283.65 1.91 0.15
26 13.82 302.23 1.91 0.17
27 10.35 226.35 1.91 0.10
28 13.24 289.55 1.91 0.16
29 13.82 302.23 1.91 0.17
30 12.14 265.49 1.91 0.13
TABLE 4: UNIVERSITY FEEDER, 33KV
S/N
POWER P
(MW) I(A) R (Ω)
POWER LOSS (MW)
1 1.61 35.21 3.39 0.004
2 2.53 55.33 3.39 0.010
3 1.70 37.18 3.39 0.005
4 1.56 34.12 3.39 0.004
5 2.66 58.17 3.39 0.011
6 1.70 37.18 3.39 0.005
7 2.16 47.24 3.39 0.008
9 2.66 58.17 3.39 0.011
10 1.74 38.05 3.39 0.005
11 1.74 38.05 3.39 0.005
12 1.56 34.12 3.39 0.004
13 1.74 38.05 3.39 0.005
14 2.43 53.14 3.39 0.010
15 2.20 48.11 3.39 0.008
16 2.43 53.14 3.39 0.010
17 1.79 39.15 3.39 0.005
18 1.74 38.05 3.39 0.005
19 2.57 56.20 3.39 0.011
20 2.39 52.27 3.39 0.009
21 2.71 59.27 3.39 0.012
22 2.30 50.30 3.39 0.009
23 2.25 49.21 3.39 0.008
24 1.79 39.15 3.39 0.005
25 1.97 43.08 3.39 0.006
26 2.89 63.20 3.39 0.014
27 2.66 58.17 3.39 0.011
28 2.43 53.14 3.39 0.010
29 2.57 56.20 3.39 0.011
30 2.53 55.33 3.39 0.010
TABLE 5: DAILY MAX LOADING WITH THEIR LOSSES IN MW FOR ALL THE FOUR FEEDERS.
DAYS MAFONI ZABARMARI BENISHIEK UNIVERSITY
APRIL 2016, 11KV FEEDER SEPTEMBER 2016, 33KV FEEDER
Power MW
Daily Max Loading MW
Daily Max Loss MW
Daily Max Loading MW
Daily Max Loss MW
Daily Max Loading MW
Daily Max Loss MW
Daily Max Loading MW
Daily Max Loss MW
20 6.9000 0.4725 0.0000 0.0000 14.6200 0.2000 2.3900 0.0090 21 9.2000 0.4080 11.0400 1.3400 12.4200 0.1400 2.7100 0.0120 22 8.2800 0.3305 10.5800 1.2300 12.1400 0.1300 2.3000 0.0090 23 6.4400 0.1999 9.2000 0.9300 12.3800 0.1400 2.2500 0.0080 24 6.9000 0.2295 11.0400 1.3400 12.3800 0.1400 1.7900 0.0050 25 7.3600 0.2611 10.1200 1.1200 12.9700 0.1500 1.9700 0.0060 26 0.0000 0.0000 10.1200 1.1200 13.8200 0.1700 2.8900 0.0140 27 8.2800 0.3305 9.6600 1.0200 10.3500 0.1000 2.6600 0.0110 28 7.8700 0.2986 9.6600 1.0200 13.2400 0.1600 2.4300 0.0100 29 6.4400 0.1999 8.7400 0.8400 13.8200 0.1700 2.5700 0.0110 30 0.0000 0.0000 0.0000 0.0000 12.1400 0.1300 2.5300 0.0100
0.0000 2.0000 4.0000 6.0000 8.0000 10.0000 12.0000 14.0000
1 3 5 7 9 11 13 15 17 19 21 23 25 27 29
Mafoni Feeder
Daily Max Loading MW
Daily Max Loss MW
0.0000 2.0000 4.0000 6.0000 8.0000 10.0000 12.0000 14.0000
1 3 5 7 9 11 13 15 17 19 21 23 25 27 29
Zabaramari Feeder
Daily Max Loading MW
IV.
CONCLUSION
4.1 Introduction
The research investigates the losses in a distribution power system, i.e technical and nontechnical losses .The mechanisms that is used to determine the technical losses was discussed in details.
Technical losses and non-technical losses causes were discussed and the ways to minimized or completely eliminate them were also stated.
The results of the different cases were represented in tabular and graphical form.
4.2 Recommendations
The following recommendations are made on this type of research work: The technical losses can be minimized in the following ways:
1. By decreasing the length of the distribution line which leads to reduce the technical losses. 0.0000
2.0000 4.0000 6.0000 8.0000 10.0000 12.0000 14.0000 16.0000
1 3 5 7 9 11 13 15 17 19 21 23 25 27 29
Benishiek Feeder
Daily Max Loading MW
Daily Max Loss MW
0.0000 0.5000 1.0000 1.5000 2.0000 2.5000 3.0000
1 3 5 7 9 11 13 15 17 19 21 23 25 27 29
University Feeder
Daily Max Loading MW
2. By carrying out maintenance the substations periodically and this leads to decrease the transformer core losses and reduce the losses of components and equipments in the substation.
3. By replacing the aluminium conductor with bigger size (120mm to 150mm) in some feeders (3,5,7). 4. By replacing the Aluminium conductor with underground armoured cable or copper conductors where
possible.
For the non-technical losses, the following ways are recommended 5. By classifying the population into sectors and units.
6. By making a periodic inspections which leads to reduction in losses.
7. By motivating the workers in the company which can reduce bribery cases and thus the nontechnical losses.
8. By Installation of pre-paid meters.
9. By establishing of authorized community commercial agents. 10. By carrying out a periodic inspection.
REFERENCES
[1]. Oda Refou, Qais Alsafasfeh, and Mohammed Alsoud, “Evaluation of Electric Energy losses in Southern Governorates of Jordan Distribution Electric system”, Int. J. of Energy Engineering, 2015,Vol.5, No.2 pp25-33.
[2]. Electricity Distribution Company (EDCO), 2013-2007 http://www.edco.jo/index.php/en/about-us/annual-reports
[3]. Ali Nourai, V.I. Kogan and Chris M. Schafer “Load Leveling Reduces T&D Line Losses,” IEEE Transactions on Power Delivery, 2008.
[4]. A. Al-Hinai, A. Al-Badi , E. A. Feilat , M. Albadi," Efficiency Enhancements of Electric Power System and Economic Analysis- Practical Case Study", Int. J. of Thermal & Environmental Engineering, Volume 5, No. 2 (2013) 183-190.
[5]. Clainer Donadel, João Anicio, Marco Fredes, Flávio Varejão, Giovanni Comarela, Gabriela Perim," A Methodology To Refine The Technical Losses Calculation From Estimates Of Non-Technical Losses, 20th International Conference on Electricity Distribution, 2009.