ORIGINAL ARTICLE
IJPHY
ABSTRACT
Background: Maximizing function in daily life is a primary goal for persons with chronic conditions.Persons with chronic conditions have reported moderate to severe disability in daily living and frequently use complex and costly healthcare services. Unmet rehabilitation needs can limit activities, restrict participation, cause deterioration of health, increase dependence on others and decrease quality of life. The purpose of the study is to analyze self reported unmet needs of adults with one or more of a specific list of chronic conditions who resided in Ontario, Alberta or British Columbia, Canada (the study population) using data from the Canadian Community Health Survey (CCHS) (Cycles 2001, 2003, and 2005).
Methods: Public use micro data files were downloaded for each CCHS cycle. Patterns of missing data were investigated and accounted for by multivariate imputation using chained equations. The dependent variables of availability, afford-ability, and acceptafford-ability, (three dimensions of access to care), were derived from existing data. Descriptive analysis and logistic regressions were completed to identify relationships between each dependent variable and independent vari-ables. Results: Unmet need for treatment of a physical health condition (physical unmet need) was the most common type of need reported by adults in the study population in three CCHS cycles. Significant associations were identified for age (> 50 years) and sex (female) with each of the dimensions of access to care.
Conclusions: Physical unmet need associated with availability, affordability and acceptability of care was identified in the study population in each of the survey cycles. Physiotherapists are well positioned to address this unmet need. Keywords: Unmet need, physical health problem, physiotherapy, secondary data analyses
Received 27th October 2016, revised 29th November 2016, accepted 07th December 2016
www.ijphy.org
10.15621/ijphy/2016/v3i6/124726
CORRESPONDING AUTHOR
Int J Physiother. Vol 3(6), 663-673, December (2016) ISSN: 2348 - 8336
UNMET NEEDS REPORTED BY ADULTS WITH CHRONIC CONDITIONS:
AN ANALYSIS OF DATA FROM THE CANADIAN COMMUNITY HEALTH
SURVEY
¹Sarah Wojkowski ²Julie Richardson ³James Chowhan ⁴Michael Boyle ⁵Stephen Birch
¹Sarah Wojkowski
Sarah Wojkowski, PT, PhD(Candidate) School of Rehabilitation Science, IAHS Rm. 432 McMaster University, 1400 Main St. West, Hamilton, Ontario, Canada.
²Professor, School of Rehabilitation Science, McMaster University, Canada.
³Adjunct Assistant Professor, DeGroote School of Business, McMaster University, Canada
⁴Professor, Department of Psychiatry and
Behavioural Neurosciences, McMaster University, Canada.
⁵Professor, Clinical Epidemiology and Biostatistics (CE&B), McMaster University, Canada.
INTRODUCTION
Physical function is recognized in rehabilitation research and practice as a key component in the evaluation of an individual’s wellbeing. Functional status and wellbeing are essential outcomes of medical care due to the high val-ue placed on these concepts by patients [1].There is also mounting evidence that functional status data are vital to clinical practice to determine patient outcomes and sub-stantiate health system performance [2]. However, people with chronic conditions often have poorer physical health [3].
Maximizing function in everyday life is a primary goal for patients with chronic conditions [1,4].Changes in physical function can predict the loss of self-management skills bet-ter than chronological age [4]. Persons with chronic con-ditions have reported moderate to severe disability in daily living [4] and frequently use complex and costly healthcare services [5].Persons with chronic conditions also struggle to access required health services, and health services often fall short of meeting patients’ with chronic conditions on-going needs [5].
Impairments related to many health conditions, and gen-eral function improve with rehabilitation [6]. Evidence supports the use of physiotherapy (PT) in the management of chronic conditions, including hypertension, [7] diabe-tes,[8] arthritis/rheumatism [9-11] and heart disease [12]. In addition, PT management of chronic diseases, such as osteoarthritis, alleviates wait times for physician services by addressing pain and functional issues and reduces the need for more costly surgical interventions [13].For exam-ple, a systematic review by Jansen et al (2011) [14] found that exercise therapy and manual mobilizations combined had a moderate (effect size 0.69, 95% CI 0.42 – 0.96) onpain reduction as measured by the Western Ontario McMaster Universities Index (WOMAC), Lequesne Index and / or visual analogue scale (VAS), in people with knee osteoar-thritis. Physiotherapists help persons restore or maintain mobility and independence, as well as maintain or improve strength and function [15].
Unmet need is “…any need for health care that remains because appropriate care was not received,” [16] although “need” may be defined differently based on who identifies it [17].Unmet rehabilitation needs, which may include PT, can limit activities, restrict participation, cause deterio-ration of health, increase dependence on others and de-crease quality of life [6]. These outcomes can have social and financial implications for persons, families and com-munities. Analysis of three Canadian Community Health Survey (CCHS) cycles (2001, 2003, 2005) identified that persons with chronic conditions were more likely to re-port an unmet need for health care, than persons without a chronic condition (OR 1.51, 95% CI 1.45 – 1.59) [18]. In addition, data from the 1998 -1999 National Population Health Survey (NPHS) identified more personswho were high users of the health care system (i.e. 8 or more visits to a family physician over the last 12 months) reported an activity limitation with heavy household chores (29.6%)
compared to low to moderate users (6.2%) and non us-ers (2.0%)(p<0.0001). More high usus-ers of the health care system also reported having a chronic illness (85.2%) compared to low to moderate users (61%) and non-users (37.3%) (p<0.0001) [19].The same persons reported the highest rate of unmet needs (18%), compared to low to moderate users (6.4%) and non users (3.9%) (p<0.0001) [19].The most common service needed, but not received, by high users of the health system was care for a physi-cal health problem (68.6%) compared to care of a mental health problem (15.7%), care of an injury (8.3%) or need for a regular checkup (5.2%) [19].
McIntyre et al (2009) [20] propose a framework that de-scribes access to care as an influence on an individual’s health care seeking behaviours in various settings. The three dimentions of access in this framework are: avail-ability, affordavail-ability, and acceptability of care [20]. Table 1 defines the three dimensions. Understanding the op-portunities and constraints of health care use by persons with chronic conditions who have physical unmet needs is essential for physiotherapists who are well positioned to address this need.
Table 1: Definitions of Availability, Affordability, Ac-ceptability [20]
Availability: Physical access to services (i.e. are clinics open when people are able to seek care – such as be-fore / after ‘work’ hours or on weekends)
Affordability: Financial access to, or the ability to pay for, services (i.e. those who require the services can pay the provider considering aspects such as third party insurance coverage)
Acceptability: Cultural access to services (i.e. the fit between the provider and the patient including atti-tude towards and expectations of each other)
The purpose of this paper is to investigate the self-reported unmet needs in the CCHS (2001, 2003, and 2005) using cross-sectional analyses of Statistics Canada’s public use micro data files (PUMF). A PUMF provides anonymous, primarily non-aggregated survey responses and allows the investigation of relationships between variables using dif-ferent statistical methods [21].The PUMF version of the CCHS provides data for health regions on a wide range of topics including presence of chronic health conditions, use of health care services, socio-demographic, income and la-bour force characteristics [22].
Three research questions guided the analysis:
1. What is the level of physical unmet need (defined by the respondent) compared to other needs (i.e. inju-ry, regular check up, emotional health problems) for adults with one or more specific chronic conditions? 2. How are the reasons for physical unmet need
attribut-ed to issues of affordability, availability, acceptability of services?
METHODS
The analyses for this study were completed as part of a larger secondary data analysis investigating the impact of public policy decisions on access to physiotherapy services. The results identified from these analyses will contribute to a growing body of literature exploring unmet need for physiotherapy services in Canada.
Study Population
The CCHS is a cross sectional survey that collects infor-mation related to health status, health care utilization and determinants of health for Canadians [23].The CCHS be-gan collecting data in 2001 and was completed every two years until 2005 with a sample of approximately 130,000 respondents [22-23]. In 2007 the sample size was reduced to 65,000 and the survey was completed annually [22,23]. Further changes that included the creation of new option-al and core modules (i.e. stages of change for physicoption-al ac-tivities) and merging health regions to reflect changes to Health Region geography were initiated in 2012[24].The CCHS was further redesigned to include a new collection strategy as well as to undergo major content revisions for the 2015 cycle [25]. As the CCHS cycles 2001, 2003 and 2005 used the same survey questions, associations between physical unmet need and affordability, availability and ac-ceptability within and between each of these cycles can be investigated.
A description of the methods used to conduct the CCHS in 2001, 2003 and 2005, including how the sampling frame was established, has been described elsewhere [23]. In sum-mary, the CCHS covers the population ≥12 years living in each Canadian province and territory, excluding Aborigi-nal peoples, full time members of the Canadian Forces, the institutionalized population and two rural Quebec health regions [23].For the purposes of this paper, CCHS respon-dents were included if the following inclusion criteria were met: adults >19 years, reported a diagnosis of one or more of the chronic conditions of interest (hypertension, and/or diabetes, and /or arthritis/rheumatism and /or heart dis-ease) and resided in Ontario, On., Alberta, Alb., or Brit-ish Columbia, BC. These three Canadian provinces were selected for this analysis as all three provinces decreased the available provincial insurance coverage for physiother-apy services, but at different points in time. Specifically, decreased provincial insurance for physiotherapy services were made in Alb. in 1995 [26]; in BC. in 2002 [27]; and in Ont. in 2005 [28].
Study Variables
An approach similar to Chen and Hou (2002) [29] was used to derive the variables of availability, affordability, and acceptability. Respondents were initially identified as hav-ing an unmet need if they: responded ‘yes’ to the question “during the past 12 months, was there ever a time when you felt that you needed health care but you did not receive it”. Respondents who indicated ‘yes’ were then asked to iden-tify the type of care needed but not received: “treatment of a physical health problem” (physical unmet need),
“treat-ment of a emotional health problem” (emotional unmet need), “care for an injury” (injury care), “a regular check up”, or “other”. The variables of availability, affordability and acceptability were then derived for respondents who indicated an unmet need for a “physical health problem” Statistical Analysis
The 2001, 2003, and 2005 CCHS PUMFs were download-ed from Ontario Data Documentation, Extraction Service and Infrastructure [30].A pooled dataset was generated by combining the 3 CCHS cycles. From this pooled dataset, a new database was generated which contained the variables required to derive the variables of interest in addition to the other socio demographic variables from each of the three provinces. Following assembly of the dataset, patterns of missing data were investigated [31]. Multivariate imputa-tion using chained equaimputa-tions were used for the imputaimputa-tion process [32]. This replaces missing values for multiple vari-ables iteratively [33]. To obtain 10 imputations, the total number of iterations performed was 100 (using a burn-in of 10 to converge to a stationary distribution).
Multiple imputation (10 imputations) by province and sur-vey cycle was used to account for missing data for house-hold income, highest level of education completed, num-ber of visits to a physiotherapist, usual numnum-ber of hours worked per week, and visible minority status. Full response variables used to inform the imputation were: gender, age, marital status, self-perceived health and self-perceived health compared to one year ago. Descriptive analysis of key variables to identify proportions, standard error and 95% confidence intervals (CI) for the variables of availabil-ity affordabilavailabil-ity and acceptabilavailabil-ity were completed. Means from each sample were compared for significant differenc-es using a 95% level of confidence [34].Logistic regression was used to determine the relationship between each of the access dimensions and the independent variables of age, sex, total house hold (income), highest level of education attained (education), work and immigration status, visible minority status, and types of self-reported unmet need. Definitions for each of the independent variables are avail-able from Statistics Canada [35]. The general equation for the logistic regressions is:
Logit(pi) = intercept+age+ sex+ income+ education+ em-ployment status+ immigrant status + visible minority status + type of self reported unmet need + province of residence + time of survey completion +the random error term for the ith individual
All analyses used the CCHS master survey weight that take into account the survey designs, cycles and non response [35]. This adjusted weight estimates unbiased coefficients given the complex survey design used in the CCHS cycles [35].All analyses were completed using STATA 13.1 SE. RESULTS
132,947 for 2001, 2003 and 2005 cycles respectively. The combined total sample size of all three PUMF CCHS cycles was 397,846. Table 3identifies the sample size by province and CCHS cycle based on the stated inclusion criteria.
Table 2: Response Rates at the National and Provincial Level (On., Alb., and BC.) for the 2001, 2003, and 2005
CCHS cycles
Total Sample Response Rate (%) CCHS Cycle Household Person Combined
200534 84.9 92.9 78.9
200333 87.1 92.6 80.7
200132 91.4 91.9 84.7
Table 3: Sample Size by Province and CCHS Cycle Based on Stated Inclusion Criteria
CCHS Cycle
2001 2003 2005 TOTAL
On. 12933 15391 15141 43465
Alb. 4016 4265 3639 11920 BC. 5266 5259 4978 15503 Total 22215 24915 23758 70888
Missing data
There were 63,497 (16%) respondents with some missing data in the study population. Missing responses were im-puted for income (n=57,079), education (n=7023), num-ber of consultations with a physiotherapist (n=459), total usual hours worked per week (n=8396) and visible mi-nority status (n=9310). Missing data for the variables that were used to derive the dependent variables were found to be not missing completely at random [38]. Data were missing more frequently for men compared to women (OR 0.49, p= 0.004, 95% CI 0.31 – 0.80) and for persons with lower compared to higher income (OR 0.60, p,0.0001, 95% CI 0.47-0.76). In addition to using variables that had no missing data (i.e. age, gender, marital status, self-per-ceived health and self-perself-per-ceived health compared to one year ago), variables that were imputed were also used in the imputation regressions where appropriate; in other words, most full response and imputed variables would contribute to the estimation of imputed values
Descriptive Analysis
Table 4 summarizes demographic characteristics for the study population in the un-weighted data set.
Table 4: Demographic Data for Sample of Interest in CCHS * Variables
Cycle Age (yrs.) (%) Gender (%) Chronic Condition (%)*
20 – 49 50- 79 80+ M F rheumatismArthritis / HBP Diabetes DiseaseHeart
Ontario
2001 24.8 64.4 10.8 40.6 59.4 63 47.5 15.5 20.1
2003 19.0 69.8 11.2 40.8 59.2 65.2 50.9 16.09 20.1
2005 19.4 68.7 12.0 41.0 59.0 63.4 53.0 17.2 18.6
Alberta
2001 29.3 60.7 9.9 43.2 56.8 65.8 44.3 14.5 14.9
2003 23.5 65.0 11.4 41.4 58.6 66.0 48.5 14.9 15.3
2005 22.3 65.3 12.3 42.6 57.4 64.0 51.7 16.2 15.4
British Columbia
2001 23.9 64.1 11.9 41.9 58.1 62.0 45.7 15.4 18.8
2003 19.3 7.4 13.3 42.3 57.7 62.4 49.5 16.8 18.5
2005 17.3 67.6 15.0 41.0 59.0 61.0 49.9 17.0 17.2
n = un-weighted sample for each CCHS cycle with one of the specific chronic conditions who live in On., Alb. or BC.
Research Question 1: What is the level of physical unmet need (defined by the respondent) compared to other needs (i.e. injury, regular check up, emotional health problems) for adults with one or more specific chronic conditions? In each CCHS cycle among persons with one or more spe-cific chronic conditionswho reported an unmet need in the previous 12 months, a larger proportion reported a physi
Research Question 2: How are the reasons for physical un-met need attributed to issues of affordability, availability, acceptability of services?
A summary of the results is presented below by province, dependent variable, and by time; Figure 1 presents the means and Table 6 presents the mean differences and test statistics of the mean differences over time comparisons.
Table 5: Proportion of respondents 19 years of age or older with one or more specific chronic condition(s)who reported unmet needs in On., Alb., and BC. in 2001, 2003 and 2005
Other Injury Regular Check Up Emotional Health
Problem Physical Health Prob-lem Prop.* 95% CI Prop. 95% CI Prop. 95% CI Prop. 95% CI Prop. 95% CI
Ontario
2001 0.06 0.05 - 0.07 0.07 0.05 - 0.09 0.05 0.03 - 0.06 0.06 0.05 - 0.08 0.73 0.70 - 0.80
2003 0.09 0.06 - 0.11 0.04 0.03- 0.05 0.06 0.04 - 0.08 0.06 0.04 - 0.08 0.70 0.67 - 0.74
2005 0.09 0.07 - 0.11 0.03 0.02- 0.04 0.06 0.05-0.08 0.04 0.03 - 0.06 0.71 0.68 - 0.74
Alberta
2001 0.06 0.04 - 0.09 0.07 0.04 -0.10 0.04 0.02- 0.06 0.05 0.03 - 0.08 0.72 0.67 - 0.77
2003 0.06 0.03- 0.08 0.05 0.03-0.08 0.04 0.01 - 0.07 0.07 0.03 - 0.12 0.70 0.63 - 0.77
2005 0.05 0.02 - 0.07 0.07 0.02- 0.12 0.05 0.02 - 0.08 0.04 0.01- 0.06 0.75 0.69 - 0.81
British Columbia
2001 0.07 0.05 - 0.09 0.08 0.05- 0.10 0.05 0.03 - 0.07 0.05 0.03 - 0.07 0.71 0.67 - 0.75
2003 0.09 0.07 - 0.12 0.04 0.03-0.06 0.02 0.00-0.03 0.05 0.03-0.75 0.73 0.69 - 0.78
2005 0.07 0.05 - 0.09 0.05 0.02-0.08 0.03 0.02-0.05 0.05 0.03-0.08 0.75 0.70 - 0.79
*Prop = proportion
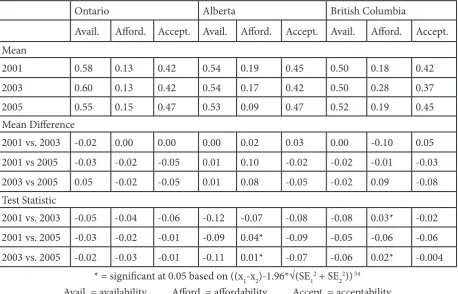
Table 6: Mean differences over time comparisons for availability, affordability, and acceptability
Ontario Alberta British Columbia
Avail. Afford. Accept. Avail. Afford. Accept. Avail. Afford. Accept. Mean
2001 0.58 0.13 0.42 0.54 0.19 0.45 0.50 0.18 0.42
2003 0.60 0.13 0.42 0.54 0.17 0.42 0.50 0.28 0.37
2005 0.55 0.15 0.47 0.53 0.09 0.47 0.52 0.19 0.45
Mean Difference
2001 vs. 2003 -0.02 0.00 0.00 0.00 0.02 0.03 0.00 -0.10 0.05
2001 vs 2005 -0.03 -0.02 -0.05 0.01 0.10 -0.02 -0.02 -0.01 -0.03
2003 vs 2005 0.05 -0.02 -0.05 0.01 0.08 -0.05 -0.02 0.09 -0.08
Test Statistic
2001 vs. 2003 -0.05 -0.04 -0.06 -0.12 -0.07 -0.08 -0.08 0.03* -0.02
2001 vs. 2005 -0.03 -0.02 -0.01 -0.09 0.04* -0.09 -0.05 -0.06 -0.06
2003 vs. 2005 -0.02 -0.03 -0.01 -0.11 0.01* -0.07 -0.06 0.02* -0.004
* = significant at 0.05 based on ((x1-x2)-1.96*√(SE12 + SE 22)) 34
Ontario
No significant difference between means were found be-tween cycles (i.e. 2001 vs. 2003, 2003 vs. 2005 and /or 2001 vs. 2005) related to the proportion of respondents who re-ported availability, affordability or acceptability as reasons forphysical unmet need.
Alberta
A significant difference between the means was identified for the domain “affordability”. A smaller proportion of Alb. respondents reported physical unmet need due to afford-ability in 2005 (x̅= 0.09, SE 0.02, 95%CI 0.05-0.12) com-pared to 2001 (x̅= 0.19, SE 0.03, 95%CI 0.14 – 0.25) and in 2005 (x̅= 0.09, SE 0.02, 95%CI 0.05-0.12) compared to 2003 (x̅= 0.17, SE 0.04, 95% CI 0.10 – 0.24).
British Columbia
An increased proportion of BC respondents reported un-met physical need due to affordability in 2003 (x̅= 0.28, SE 0.03, 95%CI 0.23 – 0.34) compared to both 2001 and 2005 (x̅= 0.18, SE 0.02, 95%CI 0.14-0.22; x̅=0.19, SE 0.03, 95%CI 0.14-0.24, respectively).
In summary, the analysis identified that the affordability dimension had significant differences in Alberta and Brit-ish Columbia in 2005 and 2003 respectively. Significant differences for acceptability and availability were not iden-tified for any province.
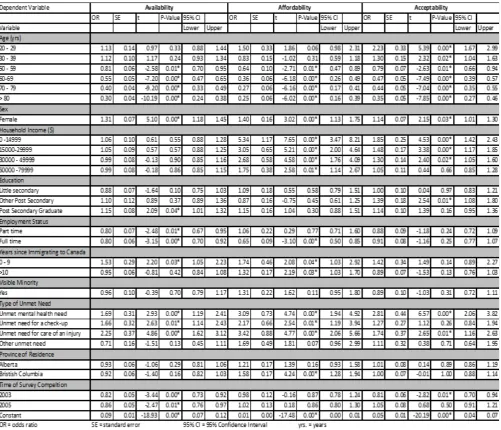
Research Question 3: Which variables associated with physical unmet need can be attributed to affordability, availability, and acceptability?
Logistic regression was used to determine which variables are associated with self-reported physical unmet needs for adults with specific chronic conditions. Consistent and sig-nificant associations were found between each of the access dimensions and the independent variables age and sex. In particular, adults with one or more of the specific condi-tions who were > 50 years were significantly less likely than adults 40 – 45 years (reference group), and men were less likely than women to report a physical unmet need due to each of availability, affordability and acceptability. Other significant findings with the independent variables were also identified for each of the access dimensions (see Table 7).
Table 7: Logit regression results for the three dimensions of access to care (availability, affordability, acceptability) for physical unmet need
Referent categories of Table 7: Age 40 – 49 years; In-come > $80,000, Education – high school completed; Em-ployment –not employed; Non-immigrant; Not a visible minority; Unmet need for treatment of a physical health problem; Province of residence – Ontario; Time of Survey completion 2001
Availability
Persons≥50 years old reported significantly less physical unmet need compared to adults 40 – 45 years due to avail-ability (Table 7). Persons who worked part time, full time, or who responded to the survey in 2003 or 2005 were also significantly less likely to report a physical unmet need due to availability compared to persons who were not em-ployed and who responded to the CCHS in 2001respec-tively. However, women, recent immigrants (≥9 years), and persons with an unmet emotional health need, unmet check-up needs or unmet injury care were significantly more likely to report an unmet need due to availability than men and persons with a physical unmet need respectively. Province of residence and income were not significant. Affordability
Similar to the findings for availability, persons who were ≥50 years of age or persons who worked full time were sig-nificantly less likely to report a physical unmet need due to affordability compared to persons 40 – 49 years or persons who did not work respectively (Table 7). Women, persons with unmet mental health unmet need, unmet check up need, or unmet injury need, were also significantly more likely to report an unmet need due to affordability then men or persons with physical unmet needs (Table 7). Un-like the findings for availability, a significant positive as-sociation was identified for income. In this analysis all in-come categories had an increased likelihood of reporting an unmet need due to affordability compared to persons with the highest annual income (>=$80,000) (reference category) (Table 7). In addition, immigrants and BC resi-dents were significantly more likely to report a physical un-met need due to affordability compared to non-immigrants and residents of On. (Table7). Time of survey completion, education and visible minority status were not significant. Acceptability
The analysis where acceptability was the dependent vari-able identified the fewest significant associations (Tvari-able 7). Persons >/=50 years were significantly less likely to report a physical unmet need due to acceptability compared to persons 40 – 49 years. Women were also significantly more likely to report a physical unmet need due to acceptabil-ity compared to men. Unlike the previous analyses, per-sons< 39 years were also significantly more likely to report a physical unmet need due to acceptability compared to persons 40 – 49 years.
Income had a positive significant association with physical unmet need for persons who reported an income<$49,999 compared to persons with an income≥ $80,000. In addi-tion, persons who completed some ‘other’ post-secondary education (i.e. trades certificate), or had mental health
un-met needs, or injury unun-met need were significantly more likely to report an unmet need due to acceptability com-pared to persons with no education or physical unmet needs respectively (Table 7). Persons who completed the CCHS in 2003 were less likely to report an unmet need due to acceptability compared to persons in 2001. Em-ployment, immigrant and visible minority status as well as province of residence were not significant factors.
DISCUSSION
Kasman & Badley (2004) [40], Law et al (2005) [41],Wu et al (2005) [42]and Ronksley et al (2012) [18]have all identified population groups with increased likelihood of reporting unmet need for health care in Canada. These groups include persons with the following characteristics: in worse health, <69 years, with higher education, with lower income, without prescription drug coverage and who are female [40-43]. In Canada, the percentage of peo-ple reporting an unmet need for health care rose from 4.2% in 1994/1995 to 12.5% in 2000/01 [43].However, it is not known how many Canadians have an unmet need for PT services.
be mobilized to address this long-standing gap in the care of adults with chronic conditions.
The descriptive analyses completed as part of this study also identified affordability as the only domain of access that demonstrated significant changes between CCHS Cy-cles. Specifically, this analysis identified significant differ-ences in Alb. between 2001 and 2005 and 2003 and 2005, and in BC. between 2001 and 2003 and 2003 and 2005. The nature of descriptive analyses in this study do not allow for the direct determination of why differences between cycles for specific provinces exist. However, it is possible that the provincial differences may be attributed to the fact that the oversight of health care in Canada is provincially driven [47].Each province independently decides the extent to which services not considered “medically necessary” are funded [46]. Thus, the unique health care structures with each of the provinces studied may have created environ-ments that impact unmet need differently. In addition, as most Canadian health systems have been in a state of transformation or reform over the past 20 years, health care resources available to persons with chronic conditions may have changed between CCHS cycles. It was beyond the scope of this paper to investigate the health policies that existed within each of the three provinces across the CCHS cycles, or to determine whether the provincial vari-ations account for the identified differences in affordability. Thus, additional research is required to determine what,if any, policies either contribute to, or protect persons with chronic conditionsfrom,reporting affordability as the ra-tionale for unmet health care needs.
The regression analyses in this study also identified signif-icant associations between age and sex and each of avail-ability, affordavail-ability, and acceptability dependent variables. Specifically, the results from this study indicated women were more likely than men, and older persons were less likely than persons 40 – 45 years, to report a physical un-met need due to any of the three dimensions of access to care.These findings are consistent with the existing litera-ture. For example, multiple studies have demonstrated that in Canada women report more unmet need for health care than men,[42,43,47,49] despite accessing health services more frequently than men [48]. Levesque et al (2008) [48] identified that a higher proportion of women (53.2%, 95% CI 50.3 – 56.0) compared to men (46.8%, 95% CI 44.0 – 49.7) reported an unmet need for health services in a sur-vey of 9,206 adults who resided in Montreal or Monteregie, Quebec, Canada in 2005. However, Bryant et al (2009) [50] have also identified that women tend to assume the re-sponsibility of primary care giving of family members, and women who work outside the house may have increased responsibilities that threaten their own health [50]. These responsibilities may affect women’s health directly through the stress of greater responsibilities, or indirectly through difficulties with scheduling and meeting medical appoint-ments [50]. Despite the volume of research document-ing disparities in women’s access to health services, most services are neither funded nor delivered with gender or
sex based considerations [51]. Thus, physiotherapists are challenged to consider if current delivery systems could be modified to address concerns related to availability, afford-ability and acceptafford-ability in order to ensure that structur-al and hestructur-alth system barriers do not prevent women with chronic conditions from achieving their health potential [51].
This study also identified that adults (> 50 years) are less likely to report physical unmet need due to any of the three dimensions of access to care. This is also consistent with existing research. For example, Sanmartin & Ross (2006) [52]identified significant factors associated with having difficulties accessing first contact healthcare services using population data from two Canadian surveys – the Health Services Access Survey and the CCHS (2003). Sanmar-tin and Ross (2006) [52] noted that among persons who had trouble accessing routine care, younger persons (< 65 years) had significantly higher odds of reporting difficul-ties than older persons (> 65 years) (OR= 1.95 for persons < 35 years, CI 1.41 – 2.72, p<0.05 and OR= 1.90, 95% CI 1.43-2.56 p < 0.05 for persons 35-64 years) [52]. This dif-ference in unmet need may be due to older persons having increased support from the health system as their need for services increases [48]. Levesque et al (2008) [48] identi-fied that older adults may have less unmet need because very few older adults do not have a family physician. How-ever, it is possible that certain barriers related to the use of health care, including older adults’ perceived acceptabili-ty of services, and/or if the availabiliacceptabili-ty of publicly funded services meet older adults’ needs, have not been explored sufficiently. As the prevalence of chronic conditions and associated comorbidities continues to rise, it is imperative for physiotherapists to consider how they can contribute to the delivery of quality care for all persons through identi-fying strategies to address the unmet health care needs of younger persons with chronic conditions.
with two or more chronic conditions, more than 25% are not working because they have a disability [53]. However, the findings from this study are also different from other research that has identified availability as the most com-monly reported reason for unmet need across Canadian provinces [43]. It is possible that the specific population se-lected in this secondary data analysis, adults with chronic conditions who resided in one of three Canadian provinc-es, may have unique characteristics related to income that contribute to these differences. Persons with chronic con-ditions may have limited resources that can be allocated to seeking health care. While availability was not identified as the main barrier in this study, it is feasible to consider that persons with chronic condition’s limited resources for health care, could be perceived as either influencing the perceived of affordability of services if only private, fee for services are available, or the perceived availability of sub-sidized or publicly funded services, depending on persons’ experiences with the health system. Thus, as provinces con-tinue to consider, and implement, health care reform phys-iotherapists need to be engaged in finding cost effective solutions for the delivery of health care which maximize the opportunities for adults with chronic conditions to be able to access, and benefit from, physiotherapy services. Limitations
The data used to explore physical unmet need in this anal-ysis are cross sectional (i.e. persons are not followed across time), and as such do not allow for causality between phys-ical unmet needs and availability, affordability and accept-ability to be assessed [54]. Only adults with specific chronic conditions for which there is evidence to support a role for physiotherapy interventions were included in the analyses. As a result it is possible that these results may not be gen-eralizable to the unmet needs of the general population. However, unmet need for treatment of a physical health problem was identified as the most common service need-ed but not receivneed-ed when type of neneed-ed was comparneed-ed in each CCHS cycle analyzed in this study and more recently by Statistics Canada in 2014 [43].
CONCLUSIONS
This study has shown that unmet need for treatment of a physical health problem was the most common type of need reported in three CCHS survey cycles (2001, 2003, and 2005) by adults >19 yrs. with one or more specific chronic condition (hypertension, and/or diabetes, and /or arthritis/rheumatism and /or heart disease) who resided in On., Alb. and BC. In addition, significant associations between sex and age were identified for each of availabil-ity, affordability and acceptability. However, affordability was the only access dimension found to have significant results through the analyses used to answer each of the three research questions guiding this paper. These results contribute to a consistent theme within the literature of unmet health care needs associated with physical health problems for persons with chronic conditions.The analy-ses also provide physiotherapists and policy makers, who
are well positioned to address physical health problems, with evidence about which barriers may prevent adults with chronic conditions accessing services. As physical function is an essential aspect to an individual’s well being, this data can inform policy and practice changes in order to enhance the delivery of physiotherapy services for per-sons in need. As the delivery of health care services con-tinues to evolve, physiotherapists are encouraged to seize the opportunity to demonstrate the professions’ expertise and value in maximizing physical function and preventing functional decline for adults with chronic conditions. REFERENCES
[1] Stewart, AL, Greenfield, S, Hays, RD, Wells, K, Rog-ers, WH, McGlynn, EA, Ware, JE Jr. Functional status and well being of patients with chronic conditions. Results from the medical outcomes study. JAMA. 1989;262(7):907-13.
[2] Romanow RJ. Building on values: The future of health care in Canada. Final report of the commission on the future of health care in Canada Ottawa, on: Canadian Government Publishing; 2004
[3] Hopman, WM, Harrison, MB, Coo, H, Friedberg, E, Buchanan, M, VanDenKerkhof, EG. Associations between chronic disease, age and physical and men-tal health status. Chronic Disease in Canada. 2009; 29(2):108 – 116.
[4] Richardson, J, Letts, L, Chan, D, Officer, A, Wojkowski, S, Oliver, D., et al. Monitoring physical function as the sixth vital sign: evaluating patient and practice engage-ment in chronic illness care in a primary care setting – a quasi experimental design. BMC Family Practice. 2012;13(29).
[5] Fradgley, EA., Paul, CL., Bryant, J. A systematic review of barriers to optimal outpatient specialist services for individuals with prevalent chronic diseases: what are the unique and common barriers experiences by pa-tients in high-income countries. International Journal for Equity in Health. 2015;14(52).
[6] World Health Organization. World report on disabili-ty. 2011. Retrieved January 30, 2016 from http://www. who.int/disabilities/world_report/2011/accessible_ en.pdf
[7] Fagard, RH, Cornelissen, V. Effect of exercise on blood pressure control in hypertensive patients. European Journal of Preventive Cardiology. 2007;14(1):12-17
[8] Umpierre, D, Ribera, PAB, Kramer, CK, Leitão, CB, Zucatti, ATN, Azevedo, MJ, et al. Physical activity ad-vice only or structured exercise training and associa-tion with HbA1c levels in type 2 diabetes: a systematic review and meta-analysis. JAMA.2011;305(17):1790-1799.
[9] Jamtvedt, G, Thune Dam, K, Christie, A, Moe, RH, Haavardsholm, E, Holm, I, Hagen, KB. Systematic Reviews Osteoarthritis of the Knee: An Overview of Physical Therapy Interventions for Patients With knee osteoarthritis. Phys Ther. 2008;88:123-136.
La-valley, M, Felson, DT. Effect of therapeutic exercise for hip osteoarthritis pain: results of a meta- analysis. Arthritis Rheum. 2008;15(59):1221-1228.
[11] Fransen, M, McConnell, S, Hernandez-Molina, G,
Reichenbach, S. Exercise for osteoarthritis of the hip. Cochrane Database Syst. Rev. 2014;22(4).
[12] Anderson, L, Thompson, DR, Oldridge, N, Zwisler,
AD, Rees, K, Martin N, Taylor, RS. Exercise based cardiac rehabilitation for coronary heart disease. Co-chrane Database Syst. Rev. 2016;5(1).
[13] Canadian Physiotherapy Association. The value of
physiotherapy: chronic disease. Retrieved online January 30 2016 from http://www.physiotherapy.ca/ getmedia/072b8d87-098e-41ac-a2ff-baedba49cc09/ CPA_TheValueOfPhysio2012_ChronicDisease-v1. pdf.aspx
[14] Jansen, MJ, Viechtbauer, W, Lenssen, AF, Hendriks,
EJM, de Bie, RA. Strength training along, exercise therapy alone, and exercise therapy with passive man-ual mobilization each reduce pain and disability in people with knee osteoarthritis: a systematic review. J of Physiotherapy. 2011; 57:11- 20.
[15] Canadian Physiotherapy Association. The description
of physiotherapy in Canada. 2012. Retrieved online March 21, 2016 from http://www.physiotherapy.ca/ getmedia/e3f53048-d8e0-416b-9c9d-38277c0e6643/ DoPEN%28final%29.pdf.aspx
[16] Allin, S, Grignon, M, LeGrand, J. Subjective unmet
need and utilization of health care services in Cana-da: what are the equity implications? Social Science & Medicine. 2009; 70:465-472.
[17] Bradshaw, J. A taxonomy of social need. In:
McLach-lan, G., ed. Problems in medical care. Oxford Nuffield Provincial Hospital Trust, 1972.
[18] Ronksley, PE, Samaritan, C, Quan, H, Ravani, P,
Ton-elli, M, Manns, B, Hemmelgarn, BR. Association be-tween chronic conditions and perceived unmet need. Open Medicine.2012;6(1): e48.
[19] Shortt, S, McColl, MA. Another way to look at high
ser-vice utilization: the contribution of disability. J Health Services Research & and Policy.2006;11(2):74-80.
[20] McIntyre, D, Thieve M, Birch, S. Access as a policy –
relevant concept in low and middle income countries. Health Economics, Policy & Law.2009;4:179-193.
[21] Statistics Canada. (2015). Workshop. Retrieved online
May 2, 2016 from http://www.statcan.gc.ca/cgi-bin/ workshop/wst2.cgi?workshop=40
[22] Statistics Canada. Canadian Community Health
Sur-vey Public Use Microdata File. Retrieved online May 2, 2016 from http://www5.statcan.gc.ca/olc-cel/olc. action?lang=en&ObjId=82M0013X&ObjType=2
[23] Statistics Canada. Canadian Community Health
Sur-vey 2000-2001 (Cycle 1.1). Retrieved online Febru-ary 25, 2016 from http://www23.statcan.gc.ca/imdb/ p2SV.pl?Function=getSurvey&Id=3359
[24] Statistics Canada. Canadian Community Health
Sur-vey Annual Component User Guide. [Internet] 2013 June. Available athttp://equinox2.uwo.ca/docfiles/
cchs/2012/cchs-escc2012_2011-2012gid-eng.pdf
[25] Statistics Canada. Canadian Community Health
Survey - Annual Component: Detailed Information for 2015. Retrieved online July 5, 2016 from http:// www23.statcan.gc.ca/imdb/p2SV.pl?Function=get-Survey&Id=238854
[26] Stabile, M, Ward, C. The effects of delisting publicly
funded health-care services. Retrieved online Sep-tember 20, 2016 from http://jdi-legacy.econ.queensu. ca/Files/Conferences/Health Servicesconferencepa-pers/Stabile_paper.pdf
[27] Dales, J. Delisting chiropractic and physiotherapy:
false savings. CMAJ. 2005;172(2):166.
[28] Gordon, M, Waines, B, Englehart, J, Montogmery,
S, Devitt, R, Holyoke, P, Cott, CA, Landry, MD. The consequences of delisting publicly funded, communi-ty based physical therapy services in Ontario: a health policy analysis. Physiotherapy Canada. 2007;59(1):58-69.
[29] Chen, J., Hou, F. Unmet needs for health care. Health
Reports. 2002;13(2): 23-34.
[30] Ontario Data Documentation, Extraction Service and
Infrastructure. (nd) About <odesi>. Retrieved online May 2, 2016 from http://search1.odesi.ca/#/about
[31] Ontario Council of University Libraries (2014).
Cana-dian Community Health Survey, 2005, 2003, 2005. Re-trieved September 1 2015 online from http://search1. odesi.ca/#/search/_term_term= CCHS&type:0;&-fromDate=Earliest&toDate=Present&refineColl_ all:false&cora:false&icpsr:false&dlimf:false;&re- fineOdesi_all:true&statCaMicro:true&statCaAg-g:true&pop:true&other:true;&addTerms@;&page:1
[32] Social Science Computing Cooperative. Multiple
im-putation in STATA: deciding to impute. Retrieved online March 2,2016 from http://www.ssc.wisc.edu/ sscc/pubs/stata_mi_decide.html
[33] Mederios, RA. An alogrithim for creating models for
imputation using the MICE approach: an application in SATA. Retrieved online December 19, 2015 from http://www.stata.com/meeting/ wcsug07/medeiros_ mice.pdf
[34] Knezevic, A. StatNews#73: Overlapping Confidence
Intervals and Statistics. Retrieved online December 19, 2015 from https://www.cscu.cornell.edu/news/ statnews/stnews73.pdf
[35] Statistics Canada. Canadian Community Health
Survey. Retrieved online July 12, 2016 fromhttp:// www23.statcan.gc.ca/imdb-bmdi/document/3226_ D7_T9_V1-eng.pdf
[36] Statistics Canada. Canadian Community Health
Survey: Additional Documentation – Cycle 1.1 Ta-ble with Sample Sizes. Retrieved online July 5, 2016 from http://www23.statcan.gc.ca/imdb-bmdi/docu-ment/3226_D7_T9_V2-eng.pdf
[37] St-Pierre, M, Béland, Y. Mode effects in the Canadian
Method-sToronto, Canada: American Statistical Association.
[38] Statistics Canada. Canadian Community Health
Sur-vey 2005 Response Rates. Retrieved online July 5, 2016 from http://www23.statcan.gc.ca/imdb-bmdi/ document/3226_D19_T9_V1_B.pdf
[39] Van Buuren, S, Boshuizen, HC, Knook, DL.
Mul-tiple imputation of missing blood pressure covari-ates in survival analysis. Statistics in Medicine. 1999;18(6):681-694.
[40] Kasman, NM, Badley, EM. Beyond access: who
re-ports that health care is not being received when needed in a publicly funded health care system? Ca-nadian Journal of Public Health. 2004;95(4):304-30.
[41] Law, M, Wilson, K, Eyes, J, Elliott, S, Jerreta, M,
Mof-fat, T et al. Meeting health need, accessing health care: the role of neighborhood. Health & Place; 2005;11: 367-377.
[42] Wu, Z, Penning, M.J., Schimmele, C.M. Immigrant
status and unmet healthcare needs. Canadian Journal of Public Health. 2005;96(5): 369-344.
[43] Sibley, LM, Glazier, RH. Reasons for self
report-ed unmet healthcare nereport-eds in Canada: a popula-tion based provincial comparison. Healthcare Poli-cy.2009;5(1):87-101.
[44] Statistics Canada. Health Facts Sheets - Unmet health
care needs, 2014. Retrieved online July 27, 2016 from http://www.statcan.gc.ca/pub/82-625-x/2016001/ar-ticle/14310-eng.htm
[45] Centre for Chronic Disease Prevention, Public Health
Agency of Canada. Chronic Disease and Injury In-dicator Framework: Quick Stats, 2015 Edition. Ot-tawa(ON): Public Health Agency of Canada; 2015. Retrieved June 30, 2016 online from http://infobase. phac-aspc.gc.ca/cdiif/
[46] Elmslie, K. Against the Growing Burden of Disease.
Retrieved June 30, 2016 from http://www.ccgh-csih. ca/assets/Elmslie.pdf
[47] Hutchison, B, Levesque, JF, Strumpf, E, Coyle, N.
Pri-mary health care in Canada: systems in motion. Mill-bank Quarterly.2011;89(2):256-288.
[48] Levesque, JF, Pineault, R, Hamel, RM., Roberge, D,
Kapetanakis, C, Simard, B. et al. Unmet health care needs: a refection of the accessibility of primary care services? 2008. L’Accessibilite et al continuite des ser-vices: une etude sur la premiere ligne au Quebec. Re-trieved online July 27, 2016 from https://www.inspq. qc.ca/pdf/publications/728-UnmetHealthCareNeeds. pdf
[49] Kazanjian, A, Morettin, D, Cho, R. Health care
uti-lization by Canadian women. BMC Womens Health. 2004; 4(Suppl 1):S33.
[50] Bryant, T, Leaver, C, Dunn, J. Unmet healthcare need,
gender and health inequities in Canada. Health Poli-cy.2009;91:24-32.
[51] Daly, T, Armstrong, P, Armstrong, H, Braedley, S,
Ol-iver, V. Contraindications: health equity and women’s health services in Toronto. 2008. Retrieved online July 27, 2016 from http://www.wellesleyinstitute.com/ wp-content/uploads/2011/11/Contradictions-report. pdf
[52] Sanmartin, C, Ross, N. Experiencing difficulties
accessing first contact health services in Canada. Healthcare Policy.2006;1(2):103 – 119.
[53] Georgetown Health Policy Institute. Multiple
chron-ic conditions: data profile number 12, November 2003. Retrieved online July 27, 2016 from https:// hpi.georgetown.edu/agingsociety/ pubhtml/multiple/ multiple.html
[54] Smith, AK, Ayanian, JZ, Covinsky, KE, Landon, BE,
McCarthy, EP, Wee, CC, & Steinman, MA. Conduct-ing high value secondary dataset analysis: An intro-ductory guide and resources. Journal of General In-ternal Medicine. 2011;28(8), 920-929.
Citation