www.solid-earth.net/5/163/2014/ doi:10.5194/se-5-163-2014
© Author(s) 2014. CC Attribution 3.0 License.
Solid Earth
Lithospheric-scale structures in New Guinea and their control on
the location of gold and copper deposits
L. T. White1,2, M. P. Morse2,*, and G. S. Lister2
1Southeast Asia Research Group, Department of Earth Sciences, Royal Holloway University of London, Egham, Surrey, UK 2Research School of Earth Sciences, The Australian National University, Canberra, ACT, Australia
*current address: Geoscience Australia, Canberra, Australia
Correspondence to: L. T. White ([email protected])
Received: 1 July 2013 – Published in Solid Earth Discuss.: 22 October 2013 Revised: 28 January 2014 – Accepted: 7 February 2014 – Published: 31 March 2014
Abstract. The locations of major gold and copper deposits
on the island of New Guinea are considered by many to be controlled by a series of transfer faults that strike N–S to NE– SW, perpendicular to the long axis of the island. The premise is that these faults dilate perpendicular to the regional stress field, forming conduits for metalliferous gases and fluids to drop out of solution. However, the data on which this idea was first proposed were often not presented or, when the data were presented, were of poor quality or low resolution. We therefore present a review of the existing structural in-terpretations and compare these with several recently pub-lished geophysical data sets to determine if the mineraliza-tion controlling transfer faults could be observed. These data were used to produce a new lineament map of New Guinea. A comparison of the lineaments with the location of major gold and copper deposits indicates there is a link between the arc-normal structures and mineralization. However, it is only those deposits that are less than 4.5 million years old that could be associated with these structures. Gravity and seismic tomography data indicate that some of these struc-tures could penetrate deep levels of the lithosphere, provid-ing some support to the earlier idea that the arc-normal struc-tures act as conduits for the younger mineral deposits of New Guinea. The gravity data can also be used to infer the loca-tion of igneous intrusions at depth, which could have brought metal-bearing fluids and gases closer to the Earth’s surface. These regions might be of interest for future exploration cam-paigns, particularly those areas that are crosscut by deep, ver-tical faults. However, new exploration models are needed to explain the location of the deposits that are older than 5 Ma.
1 Introduction
The exploration for metalliferous deposits around the world presents a challenge as there is still much to learn about the processes that concentrate metals in particular areas. Many of the largest mineral deposits around the world were found from detailed exploration campaigns around areas where the “old timers” panned the streams and sunk shafts, particularly in the search for gold. There is a major geological challenge, however, in understanding the bigger picture, and why there are regions of the globe that are particularly well endowed with concentrations of precious metals. In the pursuit of this goal, geologists typically devise models that attempt to ex-plain why some metals are more concentrated in particular regions. One such model is that gold and copper deposits are often found along strike of other deposits (e.g. along a line or a lineament) (cf. Richards et al., 2000). However, the problem here is that several deposits must be discovered be-fore a line can be drawn between the points. So, lineaments are only proposed retrospectively, after several deposits have been identified. The effectiveness of this technique is ques-tionable. Yet, these lineament style analyses are commonly used by the minerals exploration industry, particularly on the island of New Guinea because it is home to some of the world’s richest gold and/or copper deposits (e.g. Grasberg, Ok Tedi, Frieda River, Porgera and Wafi-Golpu) (Fig. 1a).
d) Our interpretation of potential field data indicates that the orientation of the basement fabric(s) is more complex c) Lineament interpretation according to Kendrick et al. (1995),
Corbett (1994), Dekkar et al. (1990) and Elliot (1994)**.
b) Lineament interpretation of northern Australia and New Guinea according to the Australian Petroleum Company [A. P. C. (1961)]
135oE 140oE 145oE 150oE
10oS 5oS 0oS a) Major gold and copper deposits of New Guinea and their age*
Grasberg (3.3-2.7 Ma)
Freida River (12 Ma)
Nena (12 Ma) Porgera (5.9 Ma)
Mt Kare (5.5 Ma)
Yandera (7 Ma)
Wamum (11 Ma)
Wafi-Golpu (14 Ma)
Edie Creek (3.8-2.4 Ma)
Hidden Valley (4.2 Ma) (4.4 Ma)Mt Bini Ok Tedi
(1.2-1.1 Ma) Star Mt. (1.6 Ma)
135oE 140oE 145oE 150oE
135oE 140oE 145oE 150oE 135oE 140oE 145oE 150oE
10oS 5oS 0oS
Fig. 1. Maps of northern Australia and New Guinea showing (a) the location of major gold and copper deposits and the age of mineralization; (b) the location of lineaments according to the Australian Petroleum Company (A. P. C., 1961), who suggested that the basement fabric of
northern Australia persisted across the Arafura Sea and into southern Papua New Guinea; (c) the location of lineaments that were identified by different studies conducted along the length of New Guinea (Hill et al., 1991; Corbett et al., 1994; Dekker et al., 1994 and Kendrick et al., 1995). These interpretations assumed that NNE striking structures of the Australian mainland could be extrapolated across the Arafura Sea and into New Guinea (in this case the structures that are shown here for northern Australia were proposed by Elliot (1994)). (d) However, our interpretation of magnetic data (Milligan (2010): Magnetic Map of Australia, 5th Edition) and gravity data (Pavlis et al., 2008, 2013; this paper) indicates that the orientation of the basement fabric is much more complex than previous workers proposed. * Mineralization ages were taking from the compilation of Garwin et al. (2005). ** Image was adapted from a figure presented in Hill et al. (1996).
geological mapping campaigns and structural analyses that showed that four NNE-trending lineaments could be drawn through the SE limit of the Muller Anticline, the NW limit of the Tari Basin, the NW limit of the deformed Mio–Pliocene strata in the Andabare Plataeu, the SE limit of the Om meta-morphic terrane, the NE limit of the Miocene Maramuni ig-neous province and offset of the NE–SW-trending Papuan Ultramafic Belt. This model drew on the idea that northern Australia had a dominant NNE–SSW-oriented crustal fab-ric that ran across the Arafura Sea and into southern New Guinea (Fig. 1b) (A. P. C., 1961), where the faults were said to be reactivated lateral ramps that were displaced during a period of shortening in the Neogene. This structural inter-pretation was also proposed to explain results from apatite fission-track analyses that indicated that parts of Papua New Guinea (PNG) had experienced varying rates of uplift (Hill and Gleadow, 1989). Further support for the model was pro-vided by Davies (1990, 1991), who showed that NNE–SSW striking clusters of mantle-derived intrusives and volcanics
occurred near Bosavi (Fig. 2a). This chain of igneous rocks is referred to as the Bosavi Transfer Zone (Smith, 1990) or the “Bosavi Lineament” (e.g. Hill et al., 2004, 2010). A second magmatic lineament was also identified to the west, drawn through Anju (south) to Ananadi (north) (Fig. 2b). As the magmatic centres along these lineaments young to the south, Davies (1990) calculated that the magmatic front migrated at a rate of 5–8 mm per year (Fig. 2c–d). This rate of movement is an order of magnitude lower than that of the Australian plate (e.g. DeMets et al., 1990), so this magmatism was said to be controlled by a local decrease in pressure in the man-tle beneath a deep crustal tensional structure oriented parallel to the axis of maximum horizontal stress (i.e. a NNE–SSW striking transfer fault) (Davies et al., 1990).
Fig. 2. A chain of volcanics near Bosavi was identified by Davies
(1990, 1991) who showed that magmatism in this region progressed from north to south across Papua New Guinea. This pattern is ob-served (a) locally where active volcanism occurs at Mount Bosavi and in smaller eruptive centres to the south, and (b) regionally. Davies (1990) drew to cross sections from Ananadi to Anju and Chambri to Bosavi to show that (c–d) the volcanic front migrated at a rate of 6–8 mm yr−1. Figure was modified from Davies (1990). The basemap in (a) and (b) is from the Global Multi-Resolution
features such as drainage lines identified from Landsat im-agery and aerial photography (Fig. 1c) (e.g. Dekker et al., 1990; Corbett, 1994; Kendrick et al., 1995; Gow and Wal-she, 2005; Hill et al., 2008; 2010). Several workers then drew on the link between the structural and magmatic lin-eaments (e.g. Hill 1991; Davies et al., 1990, 1991) and the location of some of New Guinea’s copper and gold deposits. The NNE–SSW striking lineaments were considered to di-late perpendicular/obliquely to the regional maximum prin-cipal stress direction associated with convergence between the Australian and Pacific plates. These dilationary zones were said to focus the ascent of evolved magmas and mag-matic and metalliferous fluids from deep-crustal reservoirs to nearer the Earth’s surface (e.g. Corbett, 1994; Kendrick et al., 1995; Hill et al., 1996, 2002; Richards, 2000). It did not take long before a NNE–SSW striking lineament was identified to intersect each copper and/or gold deposit in New Guinea (Corbett, 1994; Kendrick et al., 1995; Hill et al., 2002; Gow and Walshe, 2005) (Fig. 1c). These were proposed according to the interpretation of various forms of geophysical data.
Yet, while there has been much interest in mapping the arc-normal structures, it is difficult to evaluate if they actu-ally exist. This is because the geophysical data that were used to interpret the structures is often not presented or, if data were shown, the resolution/quality was too low to clearly interpret the location of a geological structure. While there is some geological evidence that supports the existence of NNE–SSW-trending lineaments (e.g. Hill, 1991; Hill et al., 2008, 2010), we were skeptical as to whether all of the pro-posed transfer structures exist in New Guinea. So we were curious as to whether these structures were mappable us-ing higher-resolution geophysical data that were not avail-able when the lineament concept was originally proposed. We therefore discuss the background behind the concept of the lineaments in New Guinea and evaluate the earlier linea-ment interpretations against modern geophysical data sets.
2 Geophysical data that were used in this study
In this section we discuss the data that were used, including information about the source and resolution of the data, as well as how the data were processed and interpreted. Please note that we were unable to access the same gravity and mag-netic data that were used in the earlier studies, so we instead used publicly accessible data, or data that we obtained per-mission to use.
2.1 Topography/bathymetry
as the Consultative Group on International Agricultural Re-search Consortium for Spatial Information (CGIAR-CSI), who reprocessed NASA’s Shuttle Radar Topographic Mis-sion (SRTM) global digital elevation data set (VerMis-sion 4.0) (Jarvis et al., 2008) (Fig. 4).
The spatial resolution of the GMRT is variable as it ties to-gether multiple sources of data. The resolution of the onshore topography data ranges between 30 and 90 m, whilst the res-olution of bathymetric data is generally∼100 m (and up to ∼50 m in some coastal areas). In comparison, the CGIAR-CSI SRTM data have a uniform resolution of 90 m, but the coverage is limited to land above sea level. The variable ∼30–100 m resolution of these data indicate that structural features can be mapped to a sufficient level of detail for a regional interpretation such as presented here, that is, pro-vided that these geomorphological features actually repre-sent faults.
The GMRT data were manipulated online using GeoMa-pApp (www.geomapapp.org). The CGIAR-CSI SRTM data are served as a series of tiles to the community from CGIAR-CSI’s website (http://srtm.csi.cgiar.org). The relevant tiles were downloaded and were merged using ArcGIS 10.0.
We used the GMRT data set (Ryan et al., 2009) to assess whether lineaments could be observed in regions such as the Arafura Sea between Australia and New Guinea (e.g. Fig. 3). We used the SRTM data to evaluate the interpretation of Gow and Walshe (2005), who proposed that some NE-trending lineaments could be identified in PNG if only the 10, 100 and 1000 m topographic contours were drawn on a map (Fig. 4a). To do this we orthorectified the map that was shown in Gow and Walshe (2005) and compared this with the same selec-tion of topographic contours generated from the SRTM data and displayed in ArcGIS (Fig. 4b).
2.2 Magnetics
To our knowledge there are no publicly available regional onshore magnetic data sets that cover New Guinea, so we could not produce a structural interpretation for the island. The EMAG2, Earth Magnetic Anomaly Grid (Maus et al., 2009), covers much of the offshore region that surrounds New Guinea (see Supplement file 1), and Geoscience Aus-tralia continue to publish maps of their compiled magnetic data sets (e.g. Milligan, 2010), but these do not extend far enough to the north to be useful for a structural interpreta-tion of onshore New Guinea. These data sets do provide use-ful information about the orientation of fabric(s) along north-ern Australia, so these were used in conjunction with gravity data (see Sect. 2.3) to assess the orientation of lineaments along northern Australia, the Arafura Sea and southern New Guinea (Fig. 1d).
We accessed two smaller-scale high-resolution aero-magnetic data sets that cover parts of the PNG Central High-lands and the Papuan Peninsula (Figs. 3 and 5) that were collected by Fugro Ltd for the World Bank between 2006
and 2008. These data were collected in north–south-oriented lines with 400–500 m line spacing and a terrain clearance of 100 m during a helicopter-borne survey. The aero-magnetic data grids have a cell size of 100 m by 100 m such that these data can effectively show magnetic anomalies with wave-lengths of 200 m. A raster was produced from the magnetic data using a minimum curvature, exploration industry stan-dard interpolation. The Central Highlands data set covers an area that encompasses the Porgera (Au), Mt Kare (Au) and Yandera (Cu-Mo) deposits (Fig. 5), and therefore the north-ern segment of the Porgera–Mt Kare lineament (Hill, 1991). So, these data were used to determine if these lineaments could be identified with regional magnetic data. This in-volved an examination of the reduced-to-pole magnetic grid. We also examined the same grid after applying an upward continuation residual (UCR) filter (Jacobsen, 1987; Morse, 2010).
The UCR filter is a method of frequency separation that generates a high-frequency residual data set by subtract-ing a higher upward continued (UC) potential field data set from a lower UC or original (zero level) of the same data set. Upward continuation simulates the effect of measur-ing the potential field at a higher (larger) distance from the source (ground level), so this calculation effectively filters out the anomalies of smaller and shallower sources, produc-ing a smoother, longer wavelength data set (a higher UC produces a smoother data set relative to a lower UC). The high-frequency signal in an UC or original data set can be accessed by subtracting the higher, smoother (longer wave-length) upward continued signal. This arguably produces a data set that shows significantly enhanced geological features (Morse, 2010). In this case, we generated new grids by sub-tracting (1) the 1 km UC grid from the original magnetic data grid, (2) the 5 km UC grid from the 1 km UC magnetic data grid, and (3) the 5 km UC grid from a 2 km UC magnetic data grid (Fig. 5).
2.3 Gravity
Table 1. Details of the UCR grids that were generated from the BGI
Bouguer gravity data where one upward continued grid (grid(X)) (that was generated by simulating the measurement being made Xkm above the original surface) was subtracted from another up-ward continued grid (grid(Y)) (that was generated by simulating the measurement being madeYkm above the original surface).
Upward continued height (Xkm)
Upward continued height (Ykm)
30 1
40 5
50 10
80 20
100 40
2.5×2.5 arc minutes (∼4–5 km). While this is quite coarse, they are the best publicly available data (to our knowledge) that cover onshore New Guinea. These data were used to produce a grid with a minimum curvature interpolation.
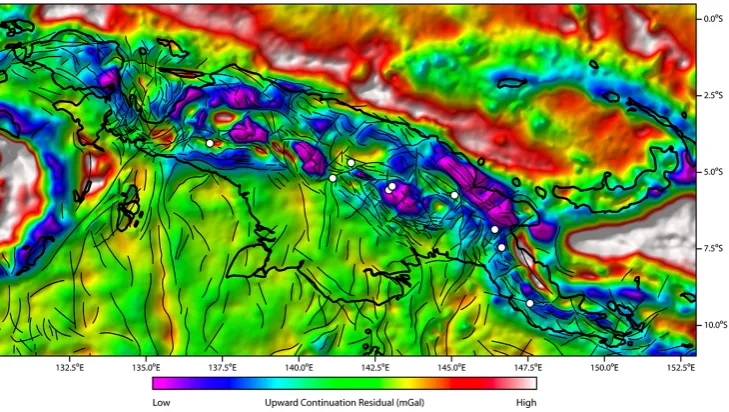
The UCR filter (see Sect. 2.2) (Jacobsen, 1987; Morse, 2010) was also applied to the Bouguer data set. In the case of the UCR Bouguer gravity data, new UCR grids were gener-ated by subtracting the original Bouguer gravity grid upward continued X kilometres above the surface, from the same grid upward continuedY kilometres above the surface (i.e. grid(Y) minus grid(X)) (Figs. 7–8). The X and Y heights for the UCR grids that were generated are shown in Table 1.
2.4 Additional image processing of magnetic and
gravity data prior to structural interpretation
The magnetic and gravity data sets were loaded in ER Map-per 7.1 before any structural interpretation began. Three du-plicate gravity or magnetic images were draped on top of one another. The base layer was used to display the “intensity“ of the magnetic or gravity signal. The intensity layer was illu-minated with a light source from the north (000◦), northeast (045◦), east (090◦) and southeast (135◦) with an inclination angle of 30–40◦ so that we could highlight different orien-tations of geological structures, where a new image file was generated for each sun angle. The middle and highest lay-ers are duplicate images shaded with a gradient fill. The only difference between the two layers is that the highest layer was made partially transparent to better enhance the data in shadowed areas.
2.5 Seismic Tomography
Seismic tomography has proven a useful tool to map geo-logical structures in the lower crust and mantle. We used the global P wave seismic tomography data set of Li et al. (2008) and the globalS wave seismic tomographic data set of Debayle et al. (2005) to determine if any arc-normal lineaments were imaged with tomography data and therefore major crustal structures since these structures reportedly fo-cus metal-bearing fluids from such depths (Corbett, 1994; Kendrick et al., 1995; Hill et al., 1996, 2002). The tomo-graphic data were imported as a grid of points into ArcGIS 10.0. Tomograms were produced by applying a spline inter-polation to the point data for different depth slices (68, 113 and 203 km) (Fig. 11). The data were also contoured at dis-crete intervals to aid the identification of any linear structural features (Fig. 11). The spatial resolution of this data set is es-timated to be∼100 km in the best sampled regions of the up-per mantle (Li et al., 2008). The station coverage is relatively good across New Guinea and northern Australia (cf. Figure 1 of Li et al., 2008), but this coverage is less dense than other parts of the world, so the spatial resolution is likely to be greater than 100 km. This means that the tomography data will not be useful in identifying a particular fault or linea-ment in New Guinea, but they should still be useful in identi-fying if there are any major discontinuities in the lower crust and upper mantle.
3 Results
3.1 Topographic data
-8000 m -6000 m -4000 m -2000 m 0 m 2000 m 4000 m
130˚E 135˚E 140˚E 145˚E 150˚E 155˚E
10˚S 5˚S
Figure 5a-d
Figure 5e-f
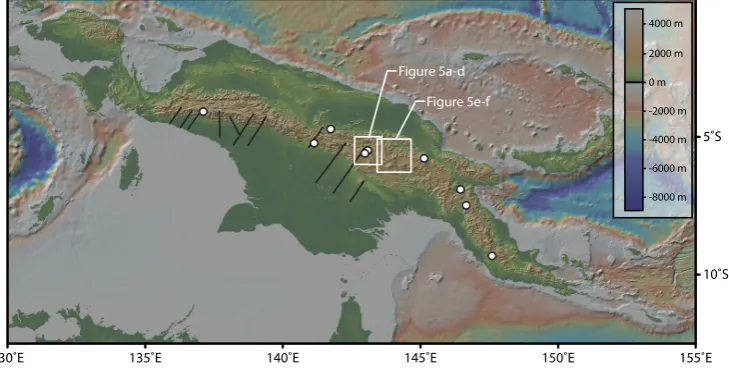
Fig. 3. A topographic and bathymetric map of New Guinea and the Arafura Sea using the Global Multi-Resolution Topography (GMRT)
data set (Ryan et al., 2009) shows that there are no pronounced NNE striking lineaments. The location of New Guinea’s copper and gold deposits (white circles) and the NNE-trending lineaments (thin black lines) that were proposed by Hill (1991) and Kendrick et al. (1995) are also shown.
3.2 Magnetics
The regional magnetic data UCR grid shows that the orig-inal regional magnetic data contain many subtle N–S- to NW–SE-oriented lineaments (Fig. 5a–b). We are unsure as to whether these lineaments represent orthogonal/polygonal faults (Fig. 5a–b), chevron-type folds (Fig. 5b), if they reflect a topographic feature, or if these do not represent geological features, and are a data artefact. As these lineaments are not visible in the lower-frequency UCR filtered data (Fig. 5c–d), it indicates that they do not occur deep in the crust.
We also observed several subtle NE striking magnetic fea-tures in the region directly east of Porgera (Fig. 5e). These lineaments were also not imaged in the lower-frequency UCR grids, indicating that they are not deep structures (Fig. 5f). We suspect that these lineaments could represent shallow dykes, veins or fractures given that they were only observed around volcanic centres (Fig. 5e).
Although there are possible NNE striking faults and dykes, these are subtle structural features. We envisaged that the lineament that was proposed to intersect the Mt Kare and Porgera gold deposits (Corbett, 1994; Kendrick et al., 1995) would be more pronounced in magnetic data. However, these data indicate the Mt Kare–Porgera lineament is not a mag-netic feature, or that this particular lineament does not exist (Fig. 5a).
3.3 Gravity
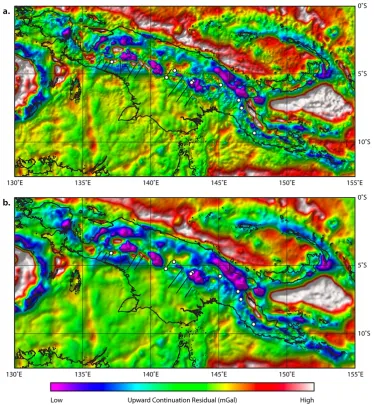
The free-air and Bouguer gravity data indicate that NNE-trending lineaments occur in various regions of New Guinea (Fig. 6a–b). Yet these images also show that there are many other lineaments with different orientations. This is
partic-ularly the case along the northern margin of Australia, the Arafura Sea and southern New Guinea where N–S-oriented lineaments are more pronounced than lineaments with other orientations (Figs. 1d, 6a–b).
The arc-normal faults that were proposed by Hill (1991) and Kendrick et al. (1995) were overlain on the free-air and Bouguer gravity data. This shows that some of the previously proposed NNE-trending lineaments correspond with sharp boundaries in the gravity data, yet many of the proposed lin-eaments do not (Fig. 6a–b).
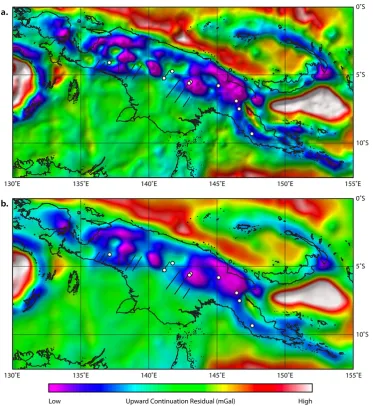
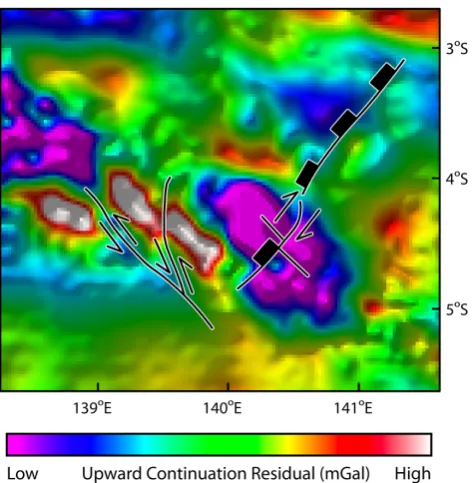
While there are some lineaments that are apparent in all of the gravity grids – for example, the N–S- to NE–SW-oriented structures that cut across the Arafura Sea into southern New Guinea (Fig. 6) – we found that it was much easier to iden-tify lineaments in the UCR filtered gravity grids relative to the free-air and Bouguer gravity data. The UCR filtered im-ages highlight distinct edges of gravity anomalies, many of which could be interpreted as lineaments, and indeed arc-normal faults (Figs. 7–8). Some of these distinct breaks in gravity anomalies correspond with the lineaments proposed by earlier workers (e.g. Hill, 1991; Kendrick et al., 1995). Some of the distinct changes in gravity could also be inter-preted as faults, as they show an apparent sense of displace-ment (Fig. 9).
3.4 A revised regional lineament map from the
interpretation of gravity data
100 m 10 m 100 m 10 m 1000 m 1000 m 100 m 10 m CORAL SEA ARAFURA SEA PACIFIC OCEAN 1000 m
NE LINEAMENTS WERE INFERRED FROM THE ORIENTATION OF TOPOGRAPHIC CONTOURS BY GOW AND WALSHE (2005) 2.5oS
5.0oS 7.5oS 145.0oE 142.5oE 140.0oE a.
Copper/Gold mineral deposit 0-10 m topographic contour
100-1000 m topographic contour >1000 m topographic contour 10-100 m topographic contour
Porgera Frieda River Ok Tedi PROPOSED NORTH EAST LINEAMENT PROPOSED NORTH EAST LINEAMENTS 2.5oS 5.0oS 7.5oS 145.0oE 142.5oE 140.0oE CORAL SEA ARAFURA SEA PACIFIC OCEAN
THE NE LINEAMENTS THAT WERE INFERRED BY GOW AND WALSHE (2005) ARE NOT APPARENT, WITH NASA SRTM (v.4) OR NOT AS OBVIOUS AS WAS INDICATED
b.
Copper/Gold mineral deposit 0-10 m topographic contour
100-1000 m topographic contour 1000-2000 m topographic contour 10-100 m topographic contour
Porgera Frieda River Ok Tedi PROPOSED NORTH EAST LINEAMENT PROPOSED NORTH EAST LINEAMENTS
Fig. 4. (a) Gow and Walshe (2005) examined the topography
of Papua New Guinea at three elevation contours (10, 100 and 1000 m). From these, they saw that there were several pronounced NE striking trends. (b) However, these features are not observed when the same elevation contour intervals are generated using the NASA Shuttle Radar Topographic Mission (SRTM) (version 4) data.
as laterally extensive as earlier workers proposed. The geo-physical data also indicate that there are multiple orientations of fabrics in the northern Australian lithosphere, and this con-flicts with the idea that there is a pervasive NNE fabric be-tween northern Australia and New Guinea (e.g. Fig. 1c). This indicates that the lineaments observed in New Guinea are not related to those in northern Australia, or that the older
Table 2. List of Cu-Au, Cu-Mo, Au and Au-Ag deposits in New
Guinea, their age and whether a NNE-trending structure that was identifiable in gravity and magnetic data dissects the region of the deposit. The deposit ages were taken from Garwin et al. (2005).
Deposit Intersecting lineament Deposit age
Ok Tedi Yes 1.2–1.1 Ma
Star Mountain Yes 1.6 Ma
Grasberg Possibly 3.3–2.7 Ma
Edie Creek Yes 3.8–2.4 Ma
Hidden Valley Yes 4.2 Ma
Mt Bini Yes 4.4 Ma
Mt Kare No 5.5 Ma
Porgera No 5.9 Ma
Yandera No 7.0 Ma
Wamum No 11.0 Ma
Frieda River No 12.0 Ma
Nena No 12.0 Ma
Wafi-Golpu No 14.0 Ma
structures of the Australian lithosphere have been folded or rotated into their current orientation. Our structural interpre-tation also indicates that only some of the mineral deposits overlie (or are at least proximal to) an arc-normal lineament (Fig. 10/Table 2). These include Star Mountain, Ok Tedi, Hidden Valley, Edie Creek, Mt Bini and possibly Grasberg. It is interesting to note that these deposits are relatively young (<4.5 Ma) and the deposits that are older than 4.5 Ma do not correspond with arc-normal structures (Table 2).
3.5 Seismic tomography
TheP wave seismic tomography grids show that there is a NE–SW- to N–S-oriented boundary between what we inter-pret to represent cold Australian lithosphere (Fig. 11). This boundary is most pronounced in the 113 and 203 km depth tomograms (Fig. 11b–f), but it is also visible in the 68 km depth slice. The tomographic feature is also imaged at the same depths in the globalSwave tomographic data set of De-bayle et al. (2005) (Supplement file 2). We are confident that this tomographic anomaly represents a lithological/mantle structure as it is imaged in multiple tomographic data sets.
Fig. 5. An upward continuation residual (UCR) filter was applied to regional aeromagnetic data to determine if northeast-trending lineaments
Fig. 6. (a) Free-air and (b) Bouguer gravity data sets obtained from the Bureau Gravimetrique Internationale (BGI) show that there are
several major N–S- and NE–SW-trending structures cutting across the Arafura Sea. These data also indicate that the majority of structures in southern New Guinea trend N–S. However, there are some NNE–SSW-trending structures in central and northern New Guinea. This indicates that if any NNE–SSW striking faults occur in New Guinea, they are perhaps unrelated to the inherited fabric of the Australian lithosphere. The light source in these images is from the southeast to highlight NE-trending structures. The same images were generated with different illumination angles to interpret lineaments with other orientations. The location of major Au/Cu/Ag/Mo deposits is shown as white circles (See Fig. 1a for more details). The NNE-trending lineaments that were proposed by Hill (1991) and Kendrick et al. (1995) are shown as thin black lines.
4 Discussion
4.1 Structural interpretation of geophysical data
The application of a UCR filter to gravity and magnetic data were useful for interpreting lineaments when compared to using the original free-air gravity, Bouguer gravity and reduced-to-pole magnetic data. The use of different sun angle orientations to highlight lineaments of different orientations
Fig. 7. Upwards continuation residual (UCR) filter applied to the BGI Bouguer gravity data. The Bouguer gravity data were calculated as
if they were collected by a measurement at 5, 10, 40 and 50 km a.s.l., and new grids were produced by (a) subtracting the 40 km grid from the 5 km grid, and (b) subtracting the 50 km grid from the 10 km grid. The illumination direction that was used in (a) and (b) is from the southeast. This was used to highlight any NNE-trending structures. The same grids were generated with different illumination angles to interpret lineaments with other orientations. The location of major Au/Cu/Ag/Mo deposits is shown as white circles (See Fig. 1a for more details). The NNE-trending lineaments that were proposed by Hill (1991) and Kendrick et al. (1995) are shown as thin black lines.
While the geophysical data do not prove that a lineament is a geological structure (e.g. a fault), we are confident that many of the interpreted lineaments are geological structures as some of the gravity anomalies are offset (e.g. Fig. 9). However, it is also likely that some of the lineaments that were interpreted could reflect features that are not geological structures. Such issues will be refined through time as new, higher-resolution data become available.
4.2 Arc-normal faults and their control on
mineralization
Fig. 8. Upwards continuation residual (UCR) filter applied to the BGI Bouguer gravity data. The Bouguer gravity data were calculated as
if they were collected by a measurement at 20, 40, 80 and 100 km a.s.l., and new grids were produced by: (a) subtracting the 80 km grid from the 20 km grid, and (b) subtracting the 100 km grid from the 40 km grid. The illumination direction that was used in (a) and (b) is from the southeast. This was used to highlight any NNE-trending structures. The same grids were generated with different illumination angles to interpret lineaments with other orientations. The location of major Au/Cu/Ag/Mo deposits is shown as white circles (See Fig. 1a for more details). The NNE-trending lineaments that were proposed by Hill (1991) and Kendrick et al. (1995) are shown as thin black lines.
In regards to timing, Hill (1991) proposed that the arc-normal transfer faults first formed as lateral ramps along with arc-parallel normal faults during a phase of extension dur-ing the Late Cretaceous–Palaeocene (100–56 Ma). The arc-parallel normal faults were later inverted during a phase of shortening in the Late Miocene to Pliocene (∼11–2.5 Ma), and the arc-normal lateral ramps were reactivated as strike-slip faults/transfer zones at the same time. This deformation is marked by the offset of the Eocene-middle Miocene Darai Limestone (Hill 1991; Davies 2012). This time limit on the movement of the transfer faults is interesting considering that we found that the arc-normal structures only intersect the
de-posits that are less than 5 million years old (Fig. 10 and Table 2).
4.3 Inherited basement fabric
Fig. 9. There were several cases where we could identify lineaments
where we could infer an apparent sense of displacement. For exam-ple, we show that there may have been some left-lateral displace-ment of gravity highs (red–white colours), as well as a possible NE-trending extensional fault with a right-lateral sense of movement. The grid that is shown here was generated by subtracting the 40 km upward continuation (UC) from the 5 km UC Bouguer grid. The grid is illuminated from the southeast.
however, the mechanism for their formation is disputed. One model for their formation proposes that these are associ-ated with strike-slip or oblique-slip transfer faults (cf. Gibbs 1983, 1984; Lister et al., 1986); the other model proposes that these are zones of accommodation of distributed faulting (cf. Bosworth 1985; Rosendahl et al., 1986; Morley et al., 1990; McClay et al., 2002). Considering (1) that we found no link between what we could identify as deeper-level basement structures in New Guinea and (2) that analogue modelling of rift systems has shown that accommodation zones oriented obliquely to perpendicular to the rift axis are not necessarily related to hard-linked strike-slip basement faults (McClay et al., 2002), it is thus worth considering that the lateral ramps proposed by Hill (1991) for the central Papuan Fold Belt (and beneath the Porgera and Mt Kare gold deposits) are not asso-ciated with deeper-level faults and/or an inherited basement fabric. However, if this is the case, it is likely that there is much more to understand about the structural history of the region as there is some apparent NE–SW strike-slip offset of units in this area.
In addition, our analysis of the trend of the basement fab-ric(s) in this region shows that there is much more variation in the orientation of these structures (Fig. 1d and 10) than what others had proposed earlier (Fig. 1b–c). This means (1)
that the arc-normal structures are not related to the domi-nant structural grain of the Australian lithosphere; (2) that these structures are related to the dominant structural grain of the Australian lithosphere, but have been folded into their current orientation in New Guinea; (3) that these faults are inherited from the Australian lithosphere, but the orientation of the structural grain was always different in New Guinea and Australia; or (4) that the arc-normal structures are un-related to any existing fabric and are associated with more recent orogenic events. Further work is required to resolve these points.
4.4 Penetration depth of arc-normal faults
As the arc-normal lineaments were said to direct metallifer-ous fluids from deep in the crust, it was important to deter-mine if these were deep faults. This is why we used vari-ous UCR filters on magnetic and gravity data sets, and why we looked at seismic tomography data. NNE-trending lin-eaments were only observed in the higher-frequency UCR filtered magnetic data, indicating that these particular struc-tures are shallow feastruc-tures, or are not magnetic. The UCR filtered gravity data indicate that arc-normal lineaments are also mappable in the high- and low-frequency grids, suggest-ing that many of the arc-normal lineaments are significant structures that cut through deeper levels of the crust. This idea is supported by seismic tomography data that show that the arc-normal structures might sole into deeper levels of the lithosphere and controlled by deeper lithospheric faults (Fig. 11). This indicates that the arc-normal faults could po-tentially tap mantle melts and fluids, and this is supported further by the field observations and geochemical data from chains of mantle-derived melts and volcanoes (e.g. Davies 1990, 1991). It is therefore possible that the arc-normal faults control the distribution of metals in New Guinea, but consid-ering our other findings, perhaps only those that are less than 5 million years old.
4.5 Exploration under cover – mapping the intersection
of intrusions and faults
Fig. 10. A new lineament map was generated by interpreting structural features in the free-air, Bouguer and the various UCR filtered
gravity data sets. We also compared these interpretations with structural information that was interpreted from the Global Multi-Resolution Topographic data set (Ryan et al., 2009). Here we show the lineament map and the location of major Au/Cu/Ag/Mo deposits draped over the 10 km-minus-50 km UCR filtered gravity grid (illuminated from the southeast). This figure shows not only that the location of some of the Au/Cu/Ag/Mo deposits (white circles) correlated with identifiable lineaments (transfer faults?), but it also shows that not every deposit is linked with an arc-normal lineament.
with magmatism were once deposited. To examine this, we used the 10–50 km UCR grid to ensure that we were effec-tively looking at the gravity signal from a depth of approx-imately 5 km, in the hope that the zones of lower gravity reflected igneous, rather than sedimentary, rocks (Fig. 12a). This indicates that there are several areas that might represent future exploration targets (Fig. 12a). Explorers might be able to further concentrate their efforts on the low-gravity zones that are intersected by faults, or where faults occur above the gravity anomalies as the structures could act as conduits for fluids and gases, and thus zones where precious metals might come out of solution.
However, there are several problems associated with this approach: (1) the resolution of the gravity data that were available to us is quite coarse (4–5 km), and (2) we do not have much in the way of geological control that could tell us more about the composition of the gravity anomalies. The first problem will only be resolved once more onshore grav-ity surveys are conducted on New Guinea. We addressed the second problem by comparing the position of low-gravity zones with the Coordinating Committee for Geoscience Pro-grammes in East and Southeast Asia (CCOP) 1:2 000 000 geological map of SE Asia (downloaded from http://www. orrbodies.com/resources/item/orr0052), noting the location of felsic intrusives and extrusives and other lithologies at the surface. We then highlighted the areas where the felsic intru-sives and extruintru-sives intersected, or were near to the regions of low gravity. While we understand that this cannot be
ad-equately tested here, we considered it useful to include this approach, as well as a map so that this might be tested further in the future.
5 Conclusions
Fig. 12. (a) The 10 km-minus-50 km UCR filtered grid was used to delineate zones of low gravity (white rimmed polygons) in the hope that
these regions represented plutons or volcanic feeder zones at depth. These zones of low gravity were compared to (b) the lithologies that are shown on the CCOP 1:2 000 000 geological map of SE Asia. The low-gravity zones that were highlighted in (a) that did not correspond with regions of volcanic rocks or felsic to intermediate plutons rocks were deleted to better highlight the regions where plutonic/sub-volcanic rocks might be found at depth, and therefore areas where metalliferous fluids may have been deposited above. The regions that are intersected by arc-normal faults might add further control to where any metalliferous fluids are concentrated.
Supplementary material related to this article is available online at http://www.solid-earth.net/5/163/ 2014/se-5-163-2014-supplement.pdf.
Acknowledgements. This work was funded by a consortium of mineral exploration companies. L. T. White is also grateful for financial support provided by a consortium of hydrocarbon companies that sponsor the Southeast Asia Research Group at Royal Holloway University of London. The authors thank S. Occhipinti, D. Sewall, C. Swager, G. Cant, M. Roberts, M. Lindsay, N. Hayward, M. Armstrong, M. Cawood, T. Craske, J. Sinclair,
S. Cox, D. Tanner and various people at Geoscience Australia for discussing and commenting on various aspects of this work. The authors would also like to thank Hugh Davies and Kevin Hill for reviewing the paper and the Papua New Guinea Mineral Resources Authority for allowing us to publish images that were generated from aero-magnetic data sets of PNG that were collected by Fugro on behalf of the World Bank (http://www.mra.gov.pg/Investors/ AeromagneticDatasetsArea12,PNG.aspx).
References
Amante, C. and Eakins, B. W.: ETOPO1 1 Arc-Minute Global Relief Model: Procedures, Data Sources and Analysis, NOAA Technical Memorandum NESDIS NGDC NGDC-24, 19 pp., 2009.
A. P. C. (The Australasian Petroleum Company Proprietary): The geological results of petroleum exploration in western Papua, Journal of the Geological Society of Australia, 8, 1–133, 1961. Bosworth, W.: Geometry of propagating continental rifts, Nature,
316, 625–627, 1985.
Corbett, G. J.: Regional structural control of selected Cu/Au oc-currences in Papua New Guinea, in: Proceedings of the Papua New Guinea Geology, Exploration and Mining Conference: Mel-bourne, edited by: Rogerson, R., Australasian Institute of Mining and Metallurgy, 57–70, 1994.
Davies, H. L.: Structure and evolution of the border region of New Guinea, in: Petroleum Exploration in Papua New Guinea, Pro-ceedings of the First PNG Petroleum Convention, Port Moresby, edited by: Carmen, G. J. and Carmen, Z., Papua New Guinea Chamber of Mines and Petroleum, Port Moresby, 245–269, 1990. Davies, H. L.: Tectonic Setting of Some Mineral Deposits of the New Guinea Region, AusIMM PNG Geology, Exploration and Mining Conference, 49–57, 1991.
Davies, H. L.: The geology of New Guinea – the cordilleran margin of the Australian continent, Episodes, 35, 87–102, 2012. Debayle, E., Kennett, B., and Priestley, K.: Global azimuthal
seis-mic anisotropy and the unique plate motion deformation of Aus-tralia, Nature, 433, 509–512, 2005.
Dekker, F., Balkwill, H., Slater, A., Herner, R., and Klamp-schuur, W. A.: Structural interpretation of the eastern Papuan Fold Belt, based on remote sensing and fieldwork, in: Petroleum Exploration in Papua New Guinea, Proceedings of the First PNG Petroleum Convention, Port Moresby, edited by: Carmen, G. J. and Carmen, Z., Papua New Guinea Chamber of Mines and Petroleum, Port Moresby, 319–336, 1990.
DeMets, C., Gordon, R., Argus, D., and Stein, S.: Current plate mo-tions, Geophys. J. Int., 101, 425–478, 1990.
Elliot, C. I.: Australian Lineament Tectonics, unpublished Ph.D. thesis, University of Melbourne, 262 pp., 1994.
Fullea, J., Fernandez, M., and Zeyen, H.: FA2BOUG – a FOR-TRAN 90 code to compute Bouguer gravity anomalies from grid-ded free-air anomalies: application to the Atlantic Mediterranean transition zone, Comput. Geosci., 34, 1665–1681, 2008. Garwin, S., Hall, R., and Watanabe, Y.: Tectonic setting, geology
and gold and copper mineralization in Cenozoic magmatic arcs of Southeast Asia and the West Pacific, Econ. Geol., 100th An-niversary Volume, 891–930, 2005.
Gawthorpe, R. L. and Hurst J. M.: Transfer zones in extensional basins: their structural style and influence on drainage devel-opment and stratigraphy, J. Geol. Soc. Lond., 150, 1137–1152, 1993.
Gibbs, A. D.: Balanced section constructions from seismic sections in areas of extensional tectonics, J. Struct. Geol., 5, 153–160, 1983.
Gibbs, A. D.: Development of extension and mixed-mode sedimen-tary basins, in Coward, M. P., Dewey, J. F., and Hancock, P. L. (Eds.): Continental extensional tectonics, Geol. Soc. Special Publication, 28, 19–33, 1984.
Gow, P. and Walshe, J.: The role of pre-existing geologic architec-ture in the formation of giant porphyry-related Cu±Au deposits: examples from New Guinea and Chile, Econ. Geol., 100, 819– 833, 2005.
Hill, K. C.: Structure of the Papuan fold belt, Papua New Guinea, AAPG Bull., 75, 857–872, 1991.
Hill, K. C., Simpson, R. J., Kendrick, R. D., Crowhurst, P. V., O’Sullivan, P. B., and Saefudin, I.: Hydrocarbons in New Guinea, controlled by basement fabric, Mesozoic extension and Tertiary convergent margin tectonics, in: Petroleum Exploration, Devel-opment and Production in Papua New Guinea: Proceedings of the Third PNG Petroleum Convention, Port Moresby, 9–11 Septem-ber 1996, edited by: Buchanan, P. G., 63–76, 1996.
Hill, K. C.: Tectonics, timing and economic deposits in Papua New Guinea (abstract), Australasian Institute of Mining and Metal-lurgy, Geology, Exploration and Mining Conference, Madang, 10–12 October, Abstracts, 233–234, 1997.
Hill, K., Kendrick, R., Crowhurst, P., and Gow, P.: Copper-gold mineralization in New Guinea: tectonics, lineaments, ther-mochronology and structure, Aust. J. Earth Sci., 49, 737–752, 2002.
Hill, K. C., Keetley, J. T., Kendrick, R. D., and Sutriyono, E.: Struc-ture and hydrocarbon potential of the New Guinea Fold Belt, in: Thrust tectonics and hydrocarbon systems, edited by: K. R. Mc-Clay, AAPG Memoir, 82, 494–514, 2004.
Hill, K. C., Bradey, K., Iwanec, J., Wilson, N. and Lucas, K.: Struc-tural exploration in the Papua New Guinea Fold Belt, in: East-ern Australian Basins Symposium III, edited by: Blevin, J. E., Bradshaw, B. E., Uruski, C., Petroleum Exploration Society of Australia, Special Publication, 225–238, 2008.
Hill, K. C., Lucas, K., and Bradley, K.: Structural styles in the Papuan Fold Belt, Papua New Guinea: constraints from analogue modelling, Geol. Soc. Lond., Special Publications, 348, 33–56, 2010.
Jacobsen, B. H.: A case for upward continuation as a standard sepa-ration filter for potential field maps, Geophysics, 52, 1138–1148, 1987.
Kendrick, R., Hill, K., Parris, K., Saefudin, I., and O’Sullivan, P.: Timing and style of Neogene regional deformation in the Irian Jaya Fold Belt, Indonesia, Proceedings of the Annual Convention – Indonesian Petroleum Association, 249–262, 1995.
Li, C., van der Hilst, R. D., Engdahl, E. R., and Bur-dick, S.: A new global model for P wave speed variations in Earth’s mantle, Geochem. Geophy. Geosy., 9, Q05018, doi:10.1029/2007GC001806, 2008.
Lister, G. S., Etheridge, M. A., and Symonds, P. A.: Detachment faulting and the evolution of passive continental margins, Geol-ogy, 14, 246–250, 1986.
McClay, K. R., Dooley, T., Whitehouse, P., and Mills, M.: 4-D evolution of rift systems: Insights from scaled physical models, AAPG Bulletin, 86, 935–959, 2002.
Morley, C.K., Nelson, R. A., Patton, T. L., and Munn, S. G.: Trans-fer zones in the East African rift system and their relevance to hydrocarbon exploration in rifts, AAPG Bulletin, 74, 1234–1253, 1990.
Morse, M.: Potential field methods prove effective for continental margin studies, AusGeo News, June 2010, Issue 98, http://www. ga.gov.au/ausgeonews/ausgeonews201006/geology.jsp (last ac-cess: 16 October 2013), 2010.
Pavlis, N. K., Holmes, S. A., Kenyon, S. C., and Factor, J. K.: An earth gravitational model to degree 2160: EGM2008, EGU General Assembly 2008, Vienna, Austria, 13–18 April, available at: http://earth-info.nga.mil/GandG/wgs84/gravitymod/egm2008 (last access: 16 October 2013), 2008.
Pavlis, N. K., Holmes, S. A., Kenyon, S. C., and Factor, J. K.: The development and evaluation of the Earth Gravitational Model 2008 (EGM2008), J. Geophys. Res., 117, B04406, doi:10.1029/2011JB008916, 2012.
Richards, J.: Lineaments revisited, Society of Economic Geologists Newsletter, 42, 14–20, 2000.
Rosendahl, B. R., Reynolds, D., Lorber, P., Burgess, C., McGill, J., Scott, D., Lambiase, J., and Derksen, S.: Structural expressions of rifting: lessons from Lake Tanganyika, in: Sedimentation in the East African rifts, edited by: Frostick, L. E., Renaut, R. W., Reid, I., and Tiercelin, J. J., Geol. Soc. Special Publication, 25, 29–43, 1986.
Ryan, W. B. F., Carbotte, S. M., Coplan, J. O., O’Hara, S., Melko-nian, A., Arko, R., Weissel, R. A., Ferrini, V., Goodwillie, A., Nitsche, F., Bonczkowiski, J., and Zemsky, R.: Global multi-resolution topography synthesis, Geochem. Geophy. Geosy., 10, Q03014, doi:10.1029/2008GC002332, 2009.