the Creative Commons Attribution 4.0 License.
A systematic comparison of experimental set-ups for
modelling extensional tectonics
Frank Zwaan1, Guido Schreurs1, and Susanne J. H. Buiter2,3
1Institute of Geological Sciences, University of Bern, Baltzerstrasse 1+3, 3012 Bern, Switzerland
2Team for Solid Earth Geology, Geological Survey of Norway (NGU), Leiv Eirikssons vei 39, 7040 Trondheim, Norway 3The Centre for Earth Evolution and Dynamics, University of Oslo, Sem Sælands vei 2A, 0371 Oslo, Norway
Correspondence:Frank Zwaan ([email protected])
Received: 14 September 2018 – Discussion started: 20 September 2018 Revised: 25 March 2019 – Accepted: 27 April 2019 – Published: 5 July 2019
Abstract.Analogue modellers investigating extensional tec-tonics often use different machines, set-ups and model ma-terials, implying that direct comparisons of results from dif-ferent studies can be challenging. Here we present a system-atic comparison of crustal-scale analogue experiments using simple set-ups simulating extensional tectonics, involving ei-ther a foam base, a rubber base, rigid basal plates or a con-veyor base system to deform overlying only or brittle-viscous models. We use X-ray computed tomography (CT) techniques for a detailed 3-D analysis of internal and exter-nal model evolution.
We find that our brittle-only experiments are strongly af-fected by their specific set-up, as the materials are directly coupled to the model base. Experiments with a foam or rubber base undergo distributed faulting, whereas experi-ments with a rigid plate or conveyor base experience local-ized deformation and the development of discrete rift basins. Pervasive boundary effects may occur due to extension-perpendicular contraction of a rubber base. Brittle-viscous experiments are less affected by the experimental set-up than their brittle-only equivalents since the viscous layer acts as a buffer that decouples the brittle layer from the base. Un-der reference conditions, a structural weakness at the base of the brittle layer is required to localize deformation into a rift basin. Brittle-viscous plate and conveyor base experi-ments better localize deformation for high brittle-to-viscous thickness ratios since the thin viscous layers in these exper-iments allow deformation to transfer from the experimental base to the brittle cover. Brittle-viscous-base coupling is fur-ther influenced by changes in strain rate, which affects vis-cous strength. We find, however, that the brittle-to-visvis-cous
strength ratios alone do not suffice to predict the type of de-formation in a rift system and that the localized or distributed character of the experimental set-up needs to be taken into account as well.
Our set-ups are most appropriate for investigating crustal-scale extension in continental and selected oceanic settings. Specific combinations of set-up and model materials may be used for studying various tectonic settings or lithospheric conditions. Here, natural factors such as temperature vari-ations, extension rate, water content and lithology should be carefully considered. We hope that our experimental overview may serve as a guide for future experimental stud-ies of extensional tectonics.
1 Introduction
1.1 Analogue experimental set-ups for investigating extensional tectonics
Bahroudi et al., 2003; Amilibia et al., 2005; Alonso-Henar et al., 2015; Philippon et al., 2015). Alternatively, extension can be achieved through gravitational gliding or spreading, in which case no moving sidewalls or an extending base needs to be applied (e.g. Gartrell, 1997; Fort et al., 2004; Acocella et al., 2005). Analogue materials used to simulate brittle parts of the lithosphere include, among others, quartz or feldspar sand, silica flour, micro-beads, and (kaolinite) clay (Hubbert, 1951; Elmohandes, 1981; Serra and Nelson, 1988; Clifton and Schlische, 2001; Autin et al., 2010; Abdelmalak et al., 2016; Klinkmüller et al., 2016, Fig. 1). Pure silicone oils and silicone putties are frequently used as analogues for ductile parts of the lithosphere (Weijermars and Schmeling, 1986; Basile and Brun, 1999; Michon and Merle, 2000; Sun et al., 2009; Rudolf et al., 2015, Fig. 1).
Vendeville et al. (1987) present experiments that highlight several factors controlling the geometry of fault systems in extensional tectonics. The study used rubber sheet set-ups with a brittle sand layer for homogeneous thin-skinned defor-mation, brittle-viscous gravity-spreading models resting on a solid base and experiments with the whole brittle-viscous lithospheric analogue floating on a simulated asthenosphere. The results provide a first impression of the differences be-tween these set-ups, revealing the correlation bebe-tween fault spacing and layer thickness in brittle materials, rift local-ization in brittle-viscous settings and isostatic effects such as tilted margins due to the influence of the asthenosphere. Yet the many experimental parameters were widely different from experiment to experiment, making a quantitative com-parison difficult.
Allemand and Brun (1991) test the influence of two-layer brittle-viscous material layering but using a conveyor belt set-up to achieve both symmetric and asymmetric exten-sion with a velocity discontinuity (VD). The basal sheets diverge, here representing a fault in the underlying (not-simulated) brittle lithospheric mantle. Asymmetric extension is shown to generate strongly asymmetric rift geometries, in both brittle and brittle-viscous models. The rifts under sym-metric extension conditions also develop a degree of struc-tural asymmetry. The similarities of results from four-layer (lithospheric-scale) models (Fig. 1) to their two-layer model results support the validity of applying a VD to simulate faults in the brittle upper mantle. Model parameters such as layer thickness, material properties and extension velocities are, however, not clearly defined, again making a direct com-parison of these experiments challenging.
Brun (1999) summarizes extension experiments with a focus on layer rheology and extension velocity. He shows that an increase in extension velocity in crustal-scale brittle-viscous conveyor belt models leads to an increase in brittle-viscous strength and brittle-viscous coupling, favouring widespread deformation or wide rifting. By contrast, low extension ve-locities lead to localized extension or narrow rifting. A simi-lar effect is obtained by changing the brittle-to-viscous thick-ness ratio: a high ratio of 3:1 leads to low brittle-viscous
coupling and narrow rifting, whereas a small ratio of 1:1 leads to high coupling and wide rifting. On a lithospheric scale, however, the behaviour of the upper mantle becomes important as well (Fig. 1); a single fault in a strong upper mantle layer may induce narrow deformation in the overly-ing crustal layers, whereas a weak upper mantle promotes distributed deformation. The models also suggest that within such wide rifts local weaknesses can account for the devel-opment of core complexes. In addition to providing a sum-marizing scheme similar to Brun (1999), Corti et al. (2003) show how magma presence can control rift initiation in nar-row rifts and cause a wide rift to shift to core complex mode. The authors also describe the additional effects of oblique ex-tension and multiple exex-tension phases on rift evolution. How-ever, the models presented in both review articles come from numerous studies and are often performed with very different techniques and parameters.
The additional significance of VDs in the brittle upper mantle was investigated by Michon and Merle (2000, 2003) by means of brittle-viscous base plate experiments, where the VD is situated at the edge of the plate. A single VD leads to asymmetric extension and the development of a single rift, whereas a double-VD experiment may form two or more rift basins, depending on the initial distance between the VDs. This is valid for high strain rates, as low strain rates focus deformation (narrow rifting), decreasing the number of rift basins. Apart from the varying strain rates and VDs, the other parameters such as model size, materials and layer thickness remained fixed.
Schreurs et al. (2006) compared results of a brittle-viscous plate base extension experiment that was run by five analogue laboratories. The overall experimental procedure was kept as similar as possible using, for example, the same foil to cover the base of the apparatus, the same extension velocity and the same viscous material (polydimethylsiloxane, PDMS). But differences occurred in brittle materials (different types of sand and a wet clay) and model dimension (width and length). This study illustrated the overall large-scale struc-tural similarities, but also showed differences in fault dip an-gle and fault spacing that were related to differences in model materials and/or model set-up.
1.2 Analogue materials used in extension experiments Brittle Mohr–Coulomb-type granular materials have very similar internal friction angles with respect to their natural analogues (ranging between ca. 25 and 40◦; Schellart, 2000;
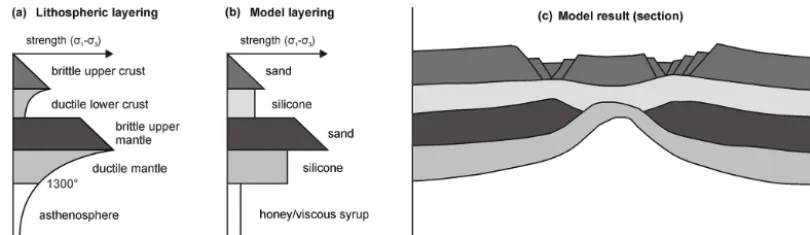
rheolog-Figure 1.Example of model layering to simulate extension in a stable four-layer lithosphere.(a)Strength profile of the natural example with a brittle upper crust, a ductile lower crust, a strong brittle upper mantle and a ductile lower mantle that blends into the underlying asthenosphere at a temperature of 1300◦C.(b)Model materials representing the various layers: sand for the brittle parts of the lithosphere and viscous silicone (mixtures) for the ductile crust and mantle. The asthenosphere is simulated with honey or viscous syrup. (c)Cross section at the end of an asymmetric extension experiment. Adapted from Allemand and Brun (1991) with permission from Elsevier.
ical factor. Intermediate cohesion values can be obtained by mixing granular materials (Abdelmalak et al., 2016; Mon-tanari et al., 2017). Low-friction micro-beads with internal friction angles of ca. 20◦ allow for the modelling of struc-tural weaknesses or weak crustal lithologies (e.g. Colletta et al., 1991; Panien et al., 2005). The density of brittle analogue materials depends on various factors such as its specific den-sity, grain size and shape, sorting, and handling techniques, as well as water content (for clays), but lies generally be-tween ca. 1400 and 1800 kg m−3(e.g. Krantz, 1991; Eisen-stadt and Sims, 2005; Klinkmüller et al., 2016).
Pure silicone oils consist of polydimethylsiloxane (PDMS), are transparent, have a density of ca. 1000 kg m−3 (Weijermars and Schmeling, 1986) and a Newtonian viscos-ity between ca. 103and 105Pa s at room temperature and at typical experimental deformation rates (Rudolf et al., 2015; Schellart and Strak, 2016). Silicone putties are mixtures of polyborondimethylsiloxane (PBDMS) and inert fillers (Weijermars, 1986), and have higher densities than pure silicone oils. Examples of opaque silicone putties commonly used in analogue modelling include Rhodorsil Gomme GS1R (Cobbold and Quinquis, 1980), Rhodorsil Silbione 70009 (Nalpas and Brun, 1993) and Dow Corning DC3179 (Dixon and Summers, 1985). Their density range varies between ca. 1140 and 1420 kg m−3 and they display New-tonian viscosities between ca. 104and 4×10⁵Pa s at room temperature (e.g. Casas et al., 2001; Cagnard et al., 2006; Konstantinovskaya et al., 2007). It should be noted that the viscosity of silicone-based materials can in some cases strongly depend on temperature (Cagnard et al., 2006) and also ageing processes have an effect on silicone behaviour (Rudolf et al., 2015, and references therein). Pure silicone oils and silicone putties can be mixed with, for instance, sand or metallic powders to modify the material’s density and viscosity (e.g. Calignano et al., 2015; Zwaan et al., 2016). Other substances, such as paraffin and gelatin mixtures can be applied when power-law or temperature-dependent rheo-logical behaviour is required (e.g. Zulauf and Zulauf, 2004;
Boutelier and Oncken, 2011). In lithosphere-scale models, the weak ductile behaviour of the asthenospheric mantle is simulated with low-viscosity materials, such as honey, glucose syrup, mixtures of polytungstate with glycerol or even pure water (Mart and Dauteuil, 2000; Chemenda et al., 2002; Schellart et al., 2002, 2003; Willingshofer et al., 2005; Molnar et al., 2017). These normally exhibit Newtonian behaviour. Further details and references concerning the abovementioned and other analogue model materials can be found in a comprehensive review article by Schellart and Strak (2016).
1.3 Aims of this study
Eisenstadt and Sims, 2005; Schreurs et al., 2006; Dooley and Schreurs, 2012, and references therein; Ritter et al., 2016). Thus, the need for reference studies of lithospheric exten-sion with standardized model parameters remains, and to our knowledge no such work is available to date.
The aim of this study is to systematically compare a se-ries of simple crustal-scale normal-gravity laboratory exper-iments involving commonly used set-ups and to discuss the tectonic settings to which these would apply. We use either a foam base, a rubber base, rigid base plates or conveyor-belt-style plastic sheets as a mechanism to deform the overlying brittle or brittle-viscous experimental materials. This forms a total of 16 reference experiments. Various additional exper-iments serve to examine the effects of among others, vary-ing extension velocity, layer thickness and brittle-to-viscous thickness ratio. We also apply X-ray computed tomography (XRCT or CT) for obtaining a highly detailed 3-D view of the internal as well as the external evolution of our experiments. We furthermore address the various boundary effects occur-ring in our experiments, a crucial factor that may strongly influence experimental results. We hope that the opportuni-ties and challenges associated with our experimental set-ups and results, combined with the summary of materials above, may form an inspiration for future experimental work.
2 Materials and methods 2.1 Material properties
We ran brittle (single-layer) and brittle-viscous (two-layer) experiments to simulate a brittle upper crust and a com-plete brittle-ductile crust, respectively (Fig. 2). Reference brittle-only experiments contain a 4 cm thick layer of fine quartz sand (∅=60–250 µm angle of internal peak and sta-ble friction: 36.1 and 31.4◦, respectively; Zwaan et al., 2016, 2018b). The sand is sieved from ca. 30 cm height into the experimental apparatus to guarantee a sand density of ca. 1560 kg m−3. The sand is flattened using a scraper at ev-ery 1 cm thickness during preparation of the experiment, causing slight density variations, which subsequently ap-pear on CT images as a “layering” (Fig. 4f, g). The refer-ence experiments with a brittle-ductile layering are built of an additional 4 cm thick, near-Newtonian viscous layer (vis-cosity η; ca. 1.5×10⁵Pa s; stress exponentn=1.05) con-sisting of a 1:1 weight mixture of SGM-36 polydimethyl-siloxane (PDMS) silicone and corundum sand (ρspecific=
3950 kg m−3; Panien et al., 2006; Zwaan et al., 2016, 2018c;
Carlo AG, 2019). The obtained density of the viscous ma-terial (ca. 1600 kg m−3) is close to that of the overlying quartz sand layer (1560 kg m−3). This results in a density profile that avoids the buoyant rise of the viscous material that would occur for a layering involving pure, low-density PDMS (ρ=965 kg m−3; Weijermars, 1986). Further mate-rial properties are listed in Table 1.
2.2 Experimental design
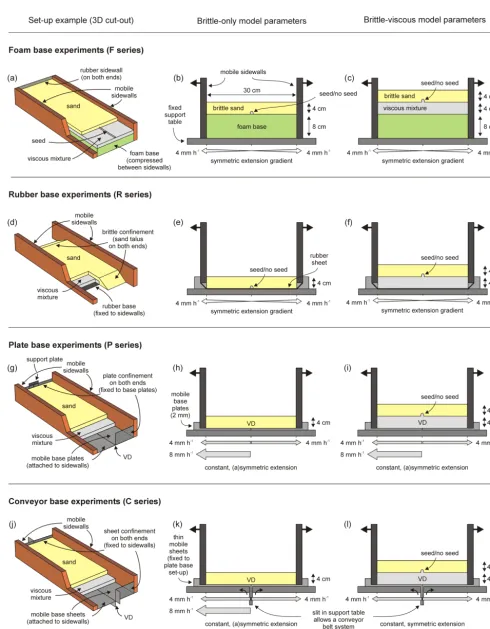
The experimental apparatus consists of a fixed base and two longitudinal sidewalls, which can move outward indepen-dently from each other above a fixed support table, their motion controlled by precise computer-guided stepper mo-tors. The initial width of the experiment is 30 cm in all set-ups, which is considerably less than their length (as speci-fied below). This high length-to-width ratio diminishes the influence of boundary effects at the short sidewalls. Through modification of the apparatus we can use four different meth-ods to transfer deformation from the base of the set-up to the overlying experimental materials: by applying either a foam base or rubber sheet base for a distributed deformation set-ting or a base of rigid plates or conveyor belt system for fo-cussed deformation (Fig. 2). The confinement along the short sidewalls varies according to the set-up, as explained below. Since the various set-ups differ significantly, we also specify which type of tectonic setting or crustal rheology is simu-lated (Fig. 3). An additional overview of the similarities and differences between our set-ups by means of (relative) veloc-ities and shifts in reference frames is provided in Appendix A (Fig. A1).
2.2.1 Distributed extension set-ups
A foam base (F series experiments) induces distributed ex-tension (e.g. Schreurs and Colletta, 1998; Schlagenhauf et al., 2008; Zwaan et al., 2016; Zwaan and Schreurs, 2017). An 8 cm thick RG 50 polyurethane foam base is first compressed between the sidewalls with the experiment subsequently con-structed on top (Fig. 2a–c). As the sidewalls move apart dur-ing an experiment, the foam expands, causdur-ing the overly-ing materials to deform (Fig. 2b, c). Rubber sidewalls at the short ends of the set-up confine the materials, with the dis-tributed extension of the rubber decreasing boundary effects there (Fig. 2a). All foam base experiments have a length of 79 cm for an initial length-to-width ratio of 2.6.
ex-Granular materials Quartz sanda Corundum sandb
Grain size range 60–250 µm 88–175 µm
Density (specific)c 2650 kg m−3 3950 kg m−3 Density (sieved) 1560 kg m−3 1890 kg m−3 Angle of internal peak friction 36.1◦ 37◦ Angle of dynamic-stable friction 31.4◦ 32◦
Cohesion 9±98 Pa 39±10 Pa
Viscous material PDMS/corundum sand mixturea
Pure PDMS density (specific)d 0.965 kg m−3 Weight ratio PDMS : corundum sand 0.965 kg : 1.00 kg
Mixture density ca. 1600 kg m−3
Viscositye ca. 1.5×10⁵Pa s
Type near-Newtonian (n=1.05)f
aQuartz sand, and viscous mixture characteristics after Zwaan et al. (2016, 2018b, c).bCorundum
sand characteristics after Panien et al. (2006).cSpecific densities of quartz and corundum sands
after Carlo AG (2019).dPDMS specific density after Weijermars (1986).eThe viscosity value
holds for model strain rates < 10−4s−1.fStress exponentn(dimensionless) represents sensitivity
to strain rate.
periments with only a brittle layer; that is, not confined by a sidewall that may influence the experimental results. The short sidewalls of the brittle-ductile rubber base experiments are enclosed by a sand talus so that the viscous material can-not escape sideways (Fig. 2d). Since the large forces involved in stretching a large rubber sheet may cause damage to the experimental apparatus, the length of the rubber base experi-ments is kept to 50 cm. Therefore, the initial length-to-width ratio is 1.7.
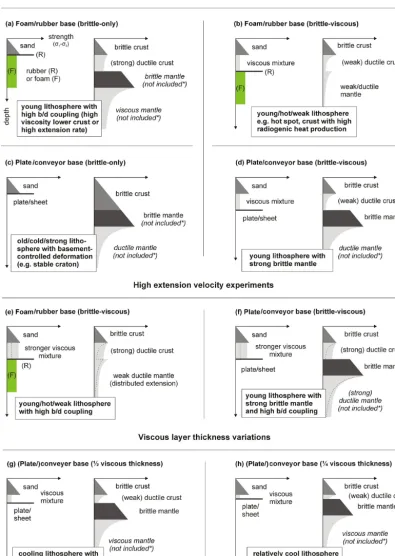
Previous authors have applied a rubber or foam base with an overlying brittle layer to simulate distributed thin-skinned extension (e.g. Bahroudi et al., 2003; Schlagenhauf et al., 2008). In nature, distributed extension in the brittle crust could develop in a setting with high brittle-ductile coupling between a brittle upper crust and a strong ductile lower crust (Fig. 3a), either due to high strain rates or high viscosity (Brun, 1999; Buiter et al., 2008; Allken et al., 2012; Zwaan et al., 2016). Note that the sub-crustal mantle has no direct influence in this case. By contrast, experiments with brittle-viscous layers on top of a rubber or foam base would sim-ulate a normal brittle-ductile crust on top of a viscously de-forming weak mantle (Fig. 3b). This setting, in which the strength of the lithosphere is determined by the brittle crust (Bürgman and Dresen, 2008), can be expected in a hot litho-sphere, for instance above a mantle plume (Saunders et al., 1992; Burov et al., 2007) or in regions subject to enhanced radiogenic heating (Mareschal and Jaupart, 2013).
2.2.2 Localized extension set-ups
The plate base set-up (P series experiments) involves two 2 mm thick rigid plastic plates that are fixed to the long side-walls (Fig. 2g–i) (e.g. Tron and Brun, 1991; Brun and Tron,
1993; Bonini et al., 1997; Keep and McClay, 1997; Michon and Merle, 2000; Gabrielsen et al., 2016). When these plates move apart with the long sidewalls, velocity discontinuities (VDs) develop at the basal edges of the plates. The sup-port table below the plates prevents material from escaping (Fig. 2h, i). The short sidewalls are confined by a similar plate system that is fixed to the horizontal plates, thus mov-ing in sync and creatmov-ing the same boundary conditions as at the base of the apparatus (Fig. 2g). In contrast to the set-ups applying distributed extension described above, the rigid base plates allow both symmetric and asymmetric extension. In the former case, two moving VDs occur as the edges of both non-overlapping plates move apart, whereas the latter case results in only one VD (similar to Michon and Merle, 2000, see also Fig. A1). The initial length of the base plate experiments is 90 cm, so that the length-to-width ratio is 3. Although we did not measure the boundary friction between the plastic plates and quartz sand, it is likely to be close to the values reported by Panien et al. (2006) for similar quartz sand on top of either plastic or PVC: ca. 21◦.
single VD occurs, which remains located at the centre of the experiment. Since this is true for both symmetrical and asym-metrical experiments (Fig. 2k, l), the plate base and conveyor belt set-ups are different. Yet the asymmetric conveyor belt mechanism is, after a switch of reference frame, the same as the asymmetric plate base mechanism (Fig. A1) and should thus produce an identical result. The same sheet system is applied on the short sidewalls in order to have a continuous confinement (Fig. 2j). These conveyor belt experiments have the same length-to-width ratio as the plate base experiments, i.e. 3. The angle of boundary friction of the foil with quartz sand lies between 15 and 21◦(Schreurs et al., 2016).
Both the plate base and conveyor base experimental de-signs involve localized deformation at VDs. These VDs sim-ulate a discrete fault (or shear zone) in a strong layer under-lying the experimental materials. In the case of our brittle-only experiments, this would translate to a fault at the base of the upper crust. In order to have a fault in the lower crust, the latter needs to behave in a brittle fashion, which in our case would be expected in an old, cool crust (Fig. 3c). On a smaller scale, one can also interpret the VD as a reac-tivated basement fault affecting overlying strata (e.g. Aco-cella et al., 1999; Ustaszewski et al., 2005). Concerning our brittle-viscous crustal experiments, the VD translates to a fault in a strong upper mantle (e.g. Allemand and Brun, 1991; Michon and Merle, 2000). Such a setting can be expected in a young stable lithosphere with a strong brittle mantle (Fig. 3d). Note that VDs could be produced by differential motion focussed along various types of (linear) irregularities or inherited structures within the lithosphere, but that these may be challenging to simulate. For instance, Morley (1999) points out that (1) VDs in analogue experiments cannot serve to reproduce irregularities within the overlying layers, but only structures at the base of these layers, and that (2) VDs by definition represent discrete features, rather than pervasive structures (e.g. foliations) that may be present throughout a volume of rock.
2.3 Additional experimental parameters and definition of coupling
For every experimental set-up, we test brittle-only materials and brittle-viscous layering, with a reference layer thickness of 4 cm, so that brittle-only and brittle-viscous experiments are 4 and 8 cm thick, respectively. However, for specific ex-periments, we either apply a 4 cm thick brittle-viscous lay-ering, or we modify the brittle-to-viscous thickness ratio by decreasing the thickness of the viscous layer to 2 or 1 cm, in order to capture the effects that a different crustal layer-ing may have on extensional structures (details in Table 2). This decrease in viscous layer thickness can be either due to a thinner, viscous lower crust, assuming that the brittle crustal thickness remains the same (Fig. 3g, h), or an increase in brittle crustal thickness with a constant Moho depth. In both cases, this would result in a relative strengthening of the
crust with respect to the default layering. Brittle-to-viscous strength ratios are given in Table 2, based on the calculations in Appendix B.
We also apply “seeds” to localize deformation in several experiments (Fig. 2, Table 2). These seeds are 1 cm thick, semi-cylindrical viscous rods of the previously described PDMS/corundum sand mixture that are placed at the base of the brittle layer. The seeds are continuous and stretch along the full axis of the experiment. They form weak zones within the sand pack, where deformation may localize, since the strong sand cover is locally thinner and thus weaker (e.g. Zwaan et al., 2016). Although we acknowledge that surface processes can influence rift evolution (e.g. Burov and Cloet-ingh, 1997; Bialas and Buck, 2009; Zwaan et al., 2018a), we neither apply erosion nor sedimentation in our experiments, since we aim to directly evaluate differences in experimental results obtained by differences in simple experimental set-ups.
Figure 3.Schematic experimental and natural strength profiles (always left and right, respectively), indicating the lithospheric setting that experiments may represent. The strength profiles of our experiments are qualitative (no scale for stress) and we have exaggerated the viscous strength for visualization purposes. Natural strength profiles can be affected by numerous factors, as discussed in Sect. 4.7 and illustrated quantitatively in Fig. 12. Dotted lines in(e)and(f)indicate the schematic strength profile under reference conditions for comparison. Symbol ∗
Table 2.List of experimental parameters.
Exp.
Layering
Structural weakness
Extension
Strength ratio (b / v)b
Shown in: Type Thickness
(b / v) Type
Velocity
Experiment Nature (mm h−1) (mm yr−1)
F
oam
base
(F
series)
F1 brittle only 40/– mm no seed symmetric 8 – – Fig. 4
F2 seed symmetric 8 – – Fig. C1
F3 8 – – Fig. C1
F4CT 8 – – Figs. 4, C1
F5 brittle-viscous
40/40 mm no seed symmetric 8 5 84 Fig. 5
F6 seed symmetric 8 5 84 Fig. C1
F7CT 8 5 84 Figs. 5, C1
Rubber
base
(R
series)
R1c,d brittle 40/– mm no seed symmetric 1st phase: 8 – – Fig. 6
only 2nd phase: 40
R2 seed symmetric 20 – –
R3 10 – –
R4CT, e, f 20 – –
R5CT, d 10 – – Fig. 6
R6CT 20 – –
R7c, d brittle- 40/40 mm no seed symmetric 1st phase: 8 5 84 Fig. 7
viscous 2nd phase: 40 24 17
R8 seed symmetric 8 5 84 Fig. 7
R9 no seed symmetric 80 47 8.4 Fig. 7
R10 480 280 1.4 Fig. 7
Plate
base
(P
series)
P1 brittle only 40/– mm no seed symmetric 8 – – Fig. 8
P2 no seed asymmetric 8 – – Figs. 8, C2
P3 brittle- 40/40 mm no seed symmetric 8 5 84
P4 viscous 2 1 337
P5 40 24 17
P6 no seed asymmetric 8 5 84 Fig. C1
P7 8 5 84 Figs. 8, C2
P8g 20/20 mm no seed symmetric 2 5 175
P9g 80 190 4.4 Figs. 8, C2
P10 40/40 mm seed symmetric 8 5 84 Fig. 8
Con
v
eyor
base
(C
series)
C1 brittle only 40/– mm no seed symmetric 40 – – Fig. 9
C2 no seed asymmetric 40 – – Fig. C2
C3 40 – – Figs. 9, C2
C4 brittle- 40/40 mm no seed symmetric 8 5 84 Figs. 9, C1
C5h viscous 8 5 84 Fig. C1
C6h 8 5 84 Fig. C1
C7 40/20 mm no seed symmetric 8 5 169 Fig. 9
C8 40/10 mm no seed symmetric 8 5 337 Fig. 9
C9 80 42 34 Fig. C2
C10 40 24 68 Fig. C2
C11CT 40 24 68 Figs. 9, C2
C12g 20/20 mm no seed symmetric 80 190 4.4 Fig. C2
Furthermore, a thin (ca. 0.5 mm thick) grid made of dark (corundum) sand with a 4×4 spacing applied to the surface of each experiment allows a first-order assessment of surface deformation by means of top-view images, without influenc-ing the experimental results. Furthermore, every component of the machine around the experiment consists of X-ray-transparent materials to allow for CT scanning and various experiments are analysed with CT techniques to reveal their 3-D internal evolution. Most experiments marked in Table 2 as “CT-scanned” were a rerun of previous tests performed without CT scanning. Various other experiments were also repeated and did indicate little structural variation, thus good reproducibility is ensured (Table 2; details presented in Ap-pendix C; Figs. C1, C2). Moreover, surface view videos and 3-D CT imagery depicting the evolution of our experiments are available as a data publication (Zwaan et al., 2019). 2.4 Scaling
We calculate stress ratios (convention: σ∗= σexperiment/σnature) based on Hubbert (1937) and
Ram-berg (1981):
σ∗=ρ∗h∗g∗, (1)
whereρ∗,h∗andg∗represent the density, length and gravity ratios, respectively.
The strain rate ratioε˙∗is derived from the stress ratioσ∗ and the viscosity ratioη∗(Weijermars and Schmeling, 1986):
˙
ε∗=σ∗/η∗. (2)
Subsequently, the velocity ratiov∗ and time ratiot∗can be obtained as follows:
˙
ε∗=v∗/h∗=1/t∗. (3)
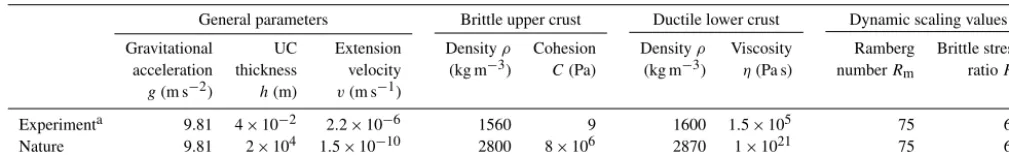
Natural values for lower crustal viscosity may have a wide range depending on the specific tectonic setting (η=1019– 1023Pa s; e.g. Buck, 1991; Brun, 1999; Bürgman and Dresen, 2008). We assume an intermediate lower crustal viscosity of 1021Pa s, which is in line with recent findings (Shinevar et al., 2015, and references therein). An hour in our experiments thus translates to 0.84 Myr in nature and our reference ve-locity (8 mm h−1) converts to a velocity of ca. 5 mm yr−1in nature, close to typical values for initial continental rifting (1–5 mm yr−1, e.g. Saria et al., 2014). The scaling parame-ters are summarized in Table 3.
To ensure dynamic similarity between brittle natural and experimental materials, we calculate the ratio Rs, which is
a function of gravitational stress and cohesive strength (C) (Ramberg, 1981; Mulugeta, 1998):
Rs=(ρgh)/C (4)
when adapting an intermediate cohesion of ca. 8 MPa for upper crustal rocks, we obtain an Rs value of 68 for both
nature and our experiments. This cohesion is relatively low compared to the ca. 20–40 MPa measured for continental rocks (e.g. Handin, 1969; Jaeger and Cook, 1976; Twiss and Moores, 1992), but should be reasonable given that the strength of the earth’s crust is generally reduced due to pre-vious phases of tectonic activity.
For verifying the dynamic similarity of viscous materials, the Ramberg numberRm applies (Weijermars and
Schmel-ing, 1986):
Rm=gravitational stress/viscous strength
=(ρgh2)/(ηv). (5)
Our experimental and the equivalent naturalRm values are
the same: ca. 75.
The reference experiments are thus properly scaled. Scal-ing the other experiments can be more challengScal-ing. When adopting a lower crust viscosity of 1021Pa s, many experi-ments would seem to extend unrealistically fast (Table 2). However, when assuming a higher lower crustal viscosity of 1022or even 1023Pa s (e.g. Buck, 1991), the equivalent natu-ral extension rates to those listed in Table 2 are more reason-able.
3 Results
3.1 Foam base experiments (F series)
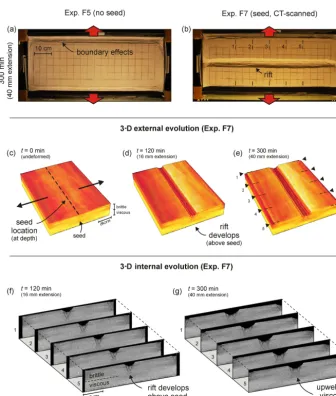
Figure 4 shows the results of two brittle-only foam base experiments (set-up in Fig. 2a, b). Experiment F1 (without seed) develops no distinct structures except for significant boundary effects along the longitudinal sidewalls towards the end of the experiment (Fig. 4a). In contrast, the seed in ex-periment F4 localizes deformation in the centre of the exper-iment, although faulting along the long sidewalls is also visi-ble at the surface (Fig. 4b). The CT data from experiment F4 (with seed) reveals the evolution of these structures in more detail (Fig. 4c–g). After ca. 60 min (8 mm) of extension, a rift starts forming above the seed and becomes visible at the sur-face after 120 min (16 mm of extension, Fig. 4d, f). This main rift structure continues developing towards the end of the ex-periment (Fig. 4e, g). The CT images show how additional faulting occurs: first along the sidewalls (Fig. 4d, f), later on throughout the experiment so that at the end of the experi-ment, pervasive sidewall-parallel striking normal faulting is omnipresent (Fig. 4e, g). Note that this distributed faulting is not visible on the top-view images due to the low fault off-sets at the surface that do not cast shadows on the experiment surface (Fig. 4b), and may very well be present in the exper-iment without seed as well (F1, Fig. 4a).
Table 3.Scaling parameters.
General parameters Brittle upper crust Ductile lower crust Dynamic scaling values
Gravitational UC Extension Densityρ Cohesion Densityρ Viscosity Ramberg Brittle stress acceleration thickness velocity (kg m−3) C(Pa) (kg m−3) η(Pa s) numberRm ratioRs
g(m s−2) h(m) v(m s−1)
Experimenta 9.81 4×10⁻² 2.2×10⁻⁶ 1560 9 1600 1.5×10⁵ 75 68 Nature 9.81 2×10⁴ 1.5×10⁻¹⁰ 2800 8×10⁶ 2870 1×10²¹ 75 68
UC: Upper Crust
aValid for reference set-ups
Figure 5.Foam base (brittle-viscous) results.(a, b)Top views depicting the final surface structures of experiments F5 (no seed) and F7 (with seed). Both the brittle and viscous layers are 4 cm thick and the extension velocity is 8 mm h−1. Note that the boundary effects are present on both sides of the experiment, but these are partially invisible due to shadow.(c–d)3-D evolution of CT-scanned experiment F7.(f, g)3-D internal evolution of CT-scanned experiment F7.
F7, with a seed, produces a well-developed symmetric rift structure. Still this experiment also produces some minor faulting along the long sidewalls (Fig. 5b). CT images illus-trate the 3-D evolution of experiment F7 (Fig. 5c–g). Soon after initiation (30 min, 4 mm extension), a central rift struc-ture with two main boundary faults develops above the seed. As the experiment progresses, this structure continues evolv-ing: the rift basin grows deeper and the brittle material sit-uated between the initial boundary faults starts breaking up due to internal faulting (Fig. 5d, f). Some boundary effects develop, but are relatively minor with respect to the central rift structure (Fig. 5d–g). Towards the end of the experiment the brittle layer is almost breached by the upwelling viscous layer (Fig. 5e, g). In this experiment, deformation is strongly
focussed on the rift structure and no distributed faulting can be distinguished.
3.2 Rubber base experiments (R series)
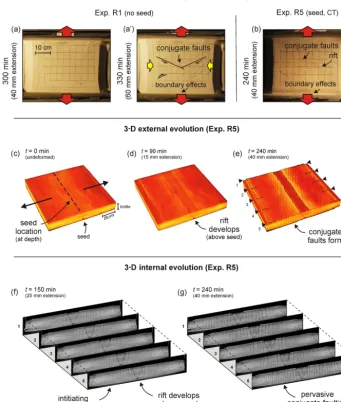
con-Figure 6.Rubber base (brittle-only) results.(a, b)Top views depicting surface structures of experiments R1 (no seed) and R5 (with seed) after 40 mm of extension. Note that panel(a)represents the first phase of experiment R1 (8 mm h−1, until 40 mm extension) and(a’)the second phase where an additional 20 mm of extension with an enhanced extension velocity of 20 mm h−1was applied to the same experiment to amplify fault structures. Experiment R5 was run with an extension velocity of 10 mm h−1. These deviations from the reference extension velocity (8 mm h−1) are permissible, since the behaviour of sand is time-independent. The sand layer is 4 cm thick in both experiments. Note that the boundary effects are present on both sides of the experiment, but these are partially invisible due to shadow.(c–d)3-D evolution of CT-scanned experiment R5.(f, g)3-D internal evolution of CT-scanned experiment R5.
jugate faults (Fig. 6a’). In contrast to experiment R1, exper-iment R5 contains a viscous seed that focuses faulting along the experiment’s central axis (Fig. 6b). As a result, this exper-iment develops a central rift structure. Similar to experexper-iment R1, well-defined conjugate faults occur as well.
The CT-derived 3-D images from experiment R5 (Fig. 6c– g) reveal how deformation localizes along the seed and the sidewall in the initial stages, forming a cylindrical central rift structure (Fig. 6d). However, after some 20–25 mm of exten-sion, the conjugate sets of vertical strike–slip faults start de-veloping (Fig. 6f), which become pervasive toward the end
of the experiment (Fig. 6e, g). This curious feature is the result of along-strike compression, as the orthogonally ex-tending rubber sheet contracts perpendicular to the extension direction (Fig. 6a’). Yet the rift structure continues to evolve toward the end of the experiment run (Fig. 6e, g).
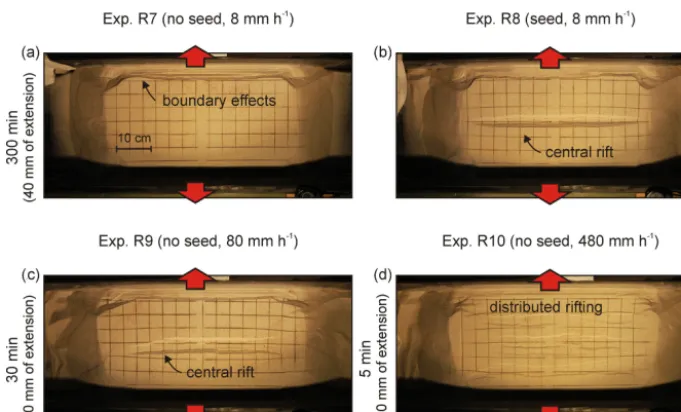
sur-Figure 7.Rubber base (brittle-viscous) results. Top views depicting the final surface structures of(a, b)experiments R7 and R8 (reference extension velocity of 8 mm h−1) and(c, d)R9 and R10 (high extension velocity experiments: 80 and 480 mm h−1, respectively). Note that boundary effects, although partially invisible due to shadow, are present on all sides of the experiment and therefore especially in the corners.
face), which continues evolving towards the end of the ex-periment (Fig. 7b). However, this exex-periment also develops strong boundary effects along the long sidewalls and at the corners, where some viscous material flows into the gap be-tween the original sand buffer and the retreating sidewalls. The rift structure is best developed in the centre of the ex-periment and dies out towards the short sidewalls, involving slight block rotation of the sand layer in the four corners of the experiment (Fig. 7b).
Experiment R9 was run at an increased extension veloc-ity of 80 mm h−1 (Fig. 7c) and produces a central rift that is quite similar to the rift in experiment R8 (Fig. 7b), even though no seed is included. Significantly higher extension velocities (480 mm h−1in experiment R10) result in strongly distributed deformation with multiple rifts (Fig. 7d). These three experiments without a seed at different extension rates (Fig. 7a, c, d) reveal the effect of decreasing strength con-trasts between the brittle and viscous layers (strength ratios of 84, 8.4 and 1.4, respectively, Table 2), of which the impli-cations are discussed in Sect. 4.4.
3.3 Plate base experiments (P series)
Experiments P1 and P2 consist of a brittle sand layer on top of plastic rigid base plate(s) (Figs. 2h, 8a, b). In experiment P1 we apply symmetric extension, whereas in experiment P2 extension is asymmetric. Both experiments initially develop a rift above the velocity discontinuity along the central axis of the experiment. However, with continued extension exper-iment P1 develops a rift basin with a central horst block in the middle, which does not develop in experiment P2 (Fig. 8a,
b). Otherwise, both rift structures have the same width. No boundary effects occur along the long sidewalls.
Figure 8c–g shows the results of the plate base experi-ments with brittle-viscous layering (set-up in Fig. 2g, i). Ex-periments P3 and P7 are following symmetrical and asym-metrical extension, respectively. No seed is included. The structural evolution is similar for both experiments. Rifting initiates at the short sidewalls, where both the base plates and confining plates are moving apart (Figs. 2g, i, 8c, d). These rifts propagate slightly towards the centre of the experiment, but strong boundary effects along the long sidewalls take up much of the extension there and no continuous rift structure develops in the centre of the experiment (Fig. 8c, d). As a result, block rotation (ca. 3◦around a vertical axis near the tips of the propagating rifts) occurs at the short ends of the experiments (Fig. 8c, d). The surface structures are largely the same in both experiments, suggesting that the applica-tion of symmetric or asymmetric extension does not have a significant influence on this type of experiment.
The application of a seed on top of the viscous layer (Exp. P10, in symmetric extension) results in early localization and rift development along the central axis of the experiment (Fig. 8e). This structure continues developing throughout the experiment, yet more extension is accommodated towards the short sidewalls than the middle section, where boundary effects along the long sidewalls take up a larger part of the deformation, similar to experiments P3 and P7 (Fig. 8c, d).
Figure 8.Overview depicting our plate base results.(a, b)Top views of brittle-only experiments P1 (symmetric extension) and P2 (asymmet-ric extension).(c–f)Brittle-viscous experiments in map view:(c–d)experiments P3 and P7 (reference extension velocity experiments, without seed),(e)Exp. P10 (reference extension velocity, with seed),(f)Exp. P9 (40 mm total thickness, high extension velocity of 80 mm h−1, no seed). Note that boundary effects are present on both sides of the experiment, but these are partially invisible due to shadow.(g)Schematic section depicting the internal structures of experiment P9 interpreted from surface data and the topography of the stretched viscous material as observed after removal of the sand at the end of the simulation. Note the two VDs; the base plates are 2 mm thick each.
keeping the same brittle-to-viscous ratio, i.e. 2 cm brittle and 2 cm viscous material, without seed). Both these experiments did not produce a continuous rift basin either. However, ex-periment P9, with a high 80 mm h−1extension velocity and a low brittle-to-viscous strength ratio of 4.4 (compared to the reference ratio of 84), produces interesting basin geome-tries (Fig. 8f, g). Instead of developing a simple rift structure, the viscous layer at the centre of the experiment is strongly stretched, creating a depression with continuous rift basins at
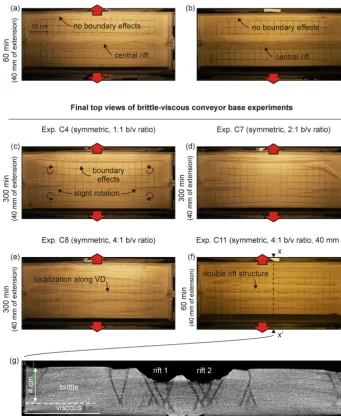
Figure 9.Overview of conveyor base results (all without seed). Top views depicting the final surface structures of(a, b)brittle-only experi-ments C1 and C3,(c, d)brittle-viscous Exp. C4 (reference layering and extension velocity),(d)experiment C7 (reference extension velocity, brittle-to-viscous ratio: 2),(e)Exp. C8 (reference extension velocity, brittle-to-viscous ratio: 4) and(f)Exp. C11 (elevated extension velocity: 40 mm h−1, brittle-to-viscous ratio: 4). Note that the boundary effects (if present) occur on both sides of the experiment, but may be partially invisible due to shadow.(g)CT section depicting the internal structures of Exp. C11.
3.4 Conveyor base experiments (C series)
Figure 9 shows the results of the conveyor base set-up with only a brittle layer (experiments C1 and C3) (set-up in Fig. 2j, k). Both experiments develop a large rift structure along the central axis of the experiment (Fig. 9a, b), rather similar to the plate base experiments P1 and P2 (Fig. 8a, b). We do, however, not directly observe a difference between results obtained with symmetrical and asymmetrical extension.
exten-sion experiment with brittle-viscous layering since we did not expect significant differences. Instead, we attempted to reduce boundary effects along the short sidewalls by apply-ing lubricants or addapply-ing a sand buffer as proposed by Tron and Brun (1991) (experiments C5 and C6, respectively). Un-fortunately, the boundary effects remained or got worse (See Appendix C, Fig. C1). Furthermore we ran the conveyor base equivalent of experiment P9 (2 cm sand, 2 cm viscous mate-rial and 80 mm h−1extension; Fig. 8f, g), labelled C12, with very similar results to the plate base experiment (Fig. C2).
We also tested the effect of decreasing viscous layer thick-ness in experiments C7 and C8, thus simultaneously de-creasing and inde-creasing the brittle-to-viscous thickness and strength ratios, respectively. In experiment C7 (Fig. 9d), the thickness and strength ratios are 2 and 168, which does not lead to a significantly different structural evolution compared to the reference set-up of experiment C4 (Fig. 9c). How-ever, decreasing the viscous layer thickness further to 1 cm (thickness and strength ratios: 4 and 337) in experiment C8 (Fig. 9e) causes localization of faulting along the central axis of the experiment during early stages of deformation, and the development of a dual rift on both sides of the VD with a horst in the middle. This central structure subsequently re-mains in place but faulting becomes more widespread to-wards the end of the experiment (Fig. 9e).
Additional tests with higher extension velocities (80 and 40 mm h−1 for experiments C9 and C10/C11, respectively; see Table 2, Fig. 9f, and Appendix C, Fig. C2) have shown to improve rift localization, as faulting is less widely devel-oped than in experiment C8 (Fig. 9e). Experiment C10 was subsequently rerun in the CT scanner as experiment C11 for further analysis (Fig. 9g). We observe that these specific ex-periments develop the same features: a double-rift system on either side of the VD, of which the internal structures become more complex with time, and a central intact, but subsided, horst in the rift centre (Fig. 9g). We also observe the develop-ment of minor additional rift basins striking parallel. Slight boundary effects occur along the long sidewalls in experi-ments C10 and C11 as well (Fig. 9f, g).
4 Discussion
4.1 General structures
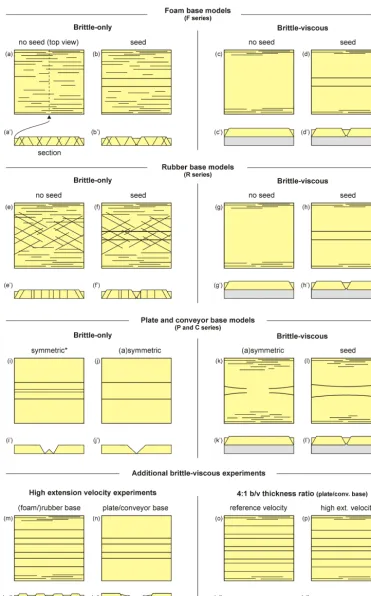
We present a schematic overview of our experimental results in Fig. 10, summarizing the general structures in map view and section, and Table 4, linking these observations with po-tential natural settings. A clear distinction exists between the brittle-only experiments (left-hand half of upper three rows in Fig. 10) and the brittle-viscous experiments (right-hand half of upper three rows in Fig. 10) since the viscous layer acts as a buffer between the deformation-inducing base and the overlying sand. In the brittle-only experiments, no such buffer exists and deformation induced by the base of the
set-up is directly transmitted to the overlying sand cover, lead-ing to more distinct structural differences between the experi-mental series. In addition, the bottom row of Fig. 10 summa-rizes the structures observed in the high extension velocity experiments and the tests with high brittle-to-viscous ratios, leading to different degrees of coupling and more complex surface structures. Our experimental results are discussed in more detail below.
4.2 Brittle-only reference experiments
In the foam base experiments, the sand above the foam di-rectly experiences the distributed deformation induced by the expanding foam, causing fault development throughout the experiment, but also along the long sidewalls (Figs. 4a, 10a). Schlagenhauf et al. (2008) report similar but more pro-nounced distributed rifting, possibly enhanced by a higher degree of extension of their foam base (20 % vs. our 13 %) and a thicker sand pack (8 cm vs. our 4 cm). Seeds do lo-calize rift basins in our experiments (Figs. 4b–g, 10b), but these structures only account for a minor part of the extension as the rifts experience little subsidence with respect to most other experiments (e.g. P1 and P2 in Figs. 8a, b, 10). The brittle-only rubber base experiments produce similar struc-tures as the brittle-only foam base experiments: distributed deformation and a minor axial rift when a seed is applied (Figs. 6, 10e, f). Significant faulting develops at the long sidewalls and migrates towards the centre of the experiment (Fig. 6c–g), which could be explained by stronger strain gra-dients in the rubber near the sidewalls (Ackermann, 1997). A similar effect could possibly occur in the foam base ex-periments as well, explaining the comparable boundary ef-fects (Fig. 4). It is worth noting that the results from our ex-periments with a full rubber base (distributed faulting) differ from those obtained with narrow rubber sheets between base plates (localized and well-developed rift basins, e.g. McClay and White, 1995; McClay et al., 2002; Schlische and With-jack, 2009). This is because in the latter experiments, defor-mation is strongly concentrated above the rubber sheets, with the edges of the plates acting as VDs. These models produce well-developed rift structures but mix two basal boundary conditions (distributed extension and VDs) making it more difficult to identify equivalent natural conditions (Morley, 1999, see also Sect. 4.6).
Table 4.Overview of links between our experimental set-ups and initial conditions, the resulting structures observed in our experiments and their potential natural analogues.
Set-up Layering Extension
velocity
Thickness ratio (b / v)
Strength ratio (b / v)
Couplingaobserved in experiments
Potential natural analogue
Structural style observed in experiments F oam/Rubber base (F and R series)
brittle slow – – Very high coupling of
brittle layer with substratum
Strong ductile lower crust (Fig. 3a)
No seed: distributed rifting (Fig. 10a, a’)
Seed: distributed rifting with small localized rift basin (Fig. 10b, b’)
NB: Rubber base: con-jugate faults may occur! (Fig. 10e, e’, f, f’)
brittle-viscous
slow 1:1 84 (high
strength contrast; low b / v coupling)
Low coupling between all componentsa, brittle cover decoupled from base of set-up
Weak, hot litho-sphere (strong mantle absent) (Fig. 3b)
No seed: only boundary effects (Fig. 10c, c’)
Seed: localized rifting (Fig. 10d, d’)
fast 1:1 1.4–8.4
(low strength contrast; high b / v coupling)
High coupling between all componentsa, brittle cover potentially coupled to base of set-up, but brittle-viscous coupling dominant
Strong ductile lower crust, but weak duc-tile upper mantle (Fig. 3e)
No seed: distributed rifting (Fig. 10m, m’)
Seed: distributed rifting with a localized rift basin
(e.g. Zwaan et al., 2016)
Plate/Con v eyor base (P and C series)
brittle slow – – Very high coupling of
brittle layer with substratum
Cold lithosphere; Fault in (thick) brittle crust or brittle mantle (Fig. 3c).
Strongly localized rifting (Fig. 10i, i’, j, j’)
brittle-viscous
slow 1:1 84 (high strength
contrast; low b / v coupling)
Low coupling between all componentsa, brittle
cover decoupled from base of set-up
Hot lithosphere with thick ductile lower crust above brittle upper mantle (Fig. 3d)
No seed: only boundary effects (Fig. 10k, k)
Seed: localized rifting (Fig. 10l, l’)
fast 4:1 337 (very high
strength contrast; very low b / v coupling)
Low b / v coupling, but soft linkage between base of set-up and brittle cover
Cold lithosphere with thin ductile lower crust above brittle upper mantle (Fig. 3h)
No seed: distributed (double) rifting (Fig. 10o, o’)
Seed: Not known
fast 1:1 4.4 (low strength
contrast; high b / v coupling)
Very high coupling between all componentsa, brittle cover poten-tially coupled to base of set-up, but viscous-base coupling dominant
Hot lithosphere with thick ductile lower crust above brittle upper mantle (Fig. 3f)
No seed: localized stretching and down-bending basin (Fig. 10m, m’)
Seed: not known
fast 4:1 68 (intermediate
strength contrast, intermediate b / v coupling)
Low brittle-base decoupling; brittle cover strongly influenced by base of set-up
Cold lithosphere with thin ductile lower crust above brittle upper mantle (Fig. 3h)
Localized (double) rifting (Fig. 10p, p’)
Seed: not known
b / v: brittle-viscous.aWe distinguish four types of coupling and decoupling: brittle-basal, brittle-viscous and viscous-basal coupling, as well as cover-basal decoupling due to the presence of a viscous layer (see Sect. 2.3).bAll components: all parts of the experiment, i.e. the sand layer, viscous layer and substratum (base of the set-up).
4, respectively) do not undergo any visible contraction per-pendicular to the extension direction, whereas an experiment by Bahroudi et al. (2003) with a length-to-width ratio of 0.8 develops strong conjugate faulting (Fig. 11b). The faults in Bahroudi et al. (2003) have a normal fault component as well, possibly because the rubber was stretched from one side only. It is furthermore interesting to note that the Poisson ef-fect may occur in very different types of models or materi-als. Chemenda et al. (2002), for instance, applying an elasto-plastic mixture of various components floating on water to simulate the lithosphere and asthenosphere, also obtain
per-vasive conjugate faults due to extension-perpendicular con-traction.
depth, scaling to a 20 km deep basin in nature) (Figs. 8a, b, 9a, b, 10i, j). In nature, isostatic compensation would have reduced basin depth, but this effect is absent here. Such ex-periments may, therefore, best be used for investigating ini-tial (small) amounts of extension (e.g. maximum of half the thickness of the brittle crust). Larger amounts of extension could be simulated when significant sedimentation is ap-plied, preserving a more realistic topography by filling in the generated “accommodation space” and providing additional material for the formation of new structures (e.g. Allemand and Brun, 1991; Brun and Tron, 1993; Keep and McClay, 1997; Gabrielsen et al., 2016, Fig. 11c, d). The small horst structure along the axis of the symmetric extension plate base experiment (Figs. 8a, 10i) is likely formed when both plates move away, leaving a small quantity of material behind in the middle. Previous authors have shown the impact extension asymmetry can have on rift geometry by creating strongly asymmetric rift basins (Allemand et al., 1989; Allemand and Brun, 1991; Panien et al., 2005, Fig. 11c, d). Yet these effects are not directly observed in our experiments, possibly due to the relatively minor total extension, the absence of syn-rift sedimentation or because we lack the necessary cross sec-tions as these models were not CT scanned.
4.3 Brittle-viscous reference experiments
The presence of a viscous layer in our experiments leads to quite different structures with respect to those observed in their brittle-only counterparts (Fig. 10). The brittle-viscous foam and rubber base cases produce basically the same struc-tures: when no seed is present, faulting only occurs along the sidewalls, whereas a seed strongly concentrates deformation as well, resulting in a central rift structure (Figs. 5, 7a, b, 10c, d, g, h). The decoupling of the sand from the foam or rubber base allows the brittle cover to behave as rigid blocks, more or less passively floating on the viscous layer (Zwaan et al., 2018a). By contrast, the sand in the brittle-only experiments is directly coupled to the base, forcing a pervasive type of faulting (Fig. 10a, b, e, f). Due to this decoupling effect of the viscous layer, no conjugate strike–slip fault sets occur in our brittle-viscous rubber base experiments nor in those ex-periments performed by Bellahsen et al. (2003) or Bellahsen and Daniel (2005). The fact that the rifts in our rubber base experiments are less developed towards the short ends of the set-up is most likely caused by the use of a sand talus to con-tain the viscous material there (Figs. 2d, 7b–d). This creates a deformation contrast between the immobile talus and the de-forming material above the rubber sheet, an effect that could potentially be reduced by using a rubber sidewall, as in the foam set-up (Figs. 2a, 5).
In contrast to the results of the brittle-only experiments that show strong differences depending on the set-up, those of the brittle-viscous plate base and conveyor base experi-ments are quite similar to their foam and rubber base equiv-alents (Fig. 10), most likely due to the tendency of the
vis-cous material to easily spread out when subject to relatively slow extension rates. All of these experiments, however, see minor rifting initiating at the short sides of the set-up, be-cause there the materials are confined by sidewalls or sheets that move in sync with the long sidewalls, imposing the same boundary conditions there as at the base of the set-up. The re-sulting additional drag enhances the extensional deformation at these short edges, forcing the development of rifts, which propagate toward the centre of the experiment (Figs. 8c–e, 9c, d, 10k, l). In the centre, however, the viscous spreading mechanism is dominant, so that we observe the same struc-tures as in the other brittle-viscous experiments (Fig. 10). This “short sidewall effect” is also present when applying a seed (Figs. 8e, 10l), causing the rifts to be more developed at the short ends of the experiment, and may also have oc-curred in a model by Mart and Dauteuil (2000). Their exper-iment involves a curious propagating rift system, initiating at the short edge of the set-up, which has a similar plate con-finement as in our experiments. We see similar rift initiation from the sides of the model in the work by Autin et al. (2010, 2013) as well. In order to reduce this type of boundary ef-fect, higher strain rates can be applied (Fig. 9e–f). However the use of a sand talus to confine the short ends of the experi-ment, as suggested by Tron and Brun (1991), does not reduce these boundary effects in our experiments, as the sand is even more strongly coupled to the experimental materials, the side plates or sheets, causing more friction (experiment C5, Ap-pendix C2, Fig. C2). This is expressed by the internal friction angle of our quartz sand being higher than that of quartz sand with respect to the plastic plates or sheets used at the short sidewalls (36.1◦versus ca. 20◦)
As with the reference brittle-only experiments, we do not observe a clear difference between symmetric and asymmet-ric extension. Yet previous authors have shown that asym-metric extension may affect brittle-viscous experiments as well. This is, however, mostly in combination with a rela-tively thin viscous layer that allows for a more direct transfer of deformation from the set-up base to the sand cover (e.g., Allemand et al., 1989). By contrast the relatively thick vis-cous layer in our reference experiments acts as a buffer, de-coupling the sand from the extending plates or sheets at the base of the experiments (see also Sect. 4.5).
4.4 Velocity effects: distributed extension versus passive down-bending and marginal graben formation
ra-tio of 84, see Table 2) also indicate higher brittle-viscous coupling, which is known to cause distributed or wide rift-ing (e.g. Brun, 1999; Buiter et al., 2008; Zwaan et al., 2016; Figs. 7c, d, 10m). Since both the enhanced cover-basal and high brittle-viscous coupling should lead to similar results, it is challenging to determine which factor is dominant. Still the type of deformation in these experiments is not as evenly distributed as in their brittle-only equivalents (Figs. 4, 10a, b, e, f), suggesting that the influence of the base is secondary compared to the effects of brittle-viscous coupling. We can also infer that the central rift in experiment R9 (Fig. 7c) prob-ably forms due to some wide rifting effect: the higher the extension rate (while keeping all other parameters constant), the higher the brittle-viscous coupling and the more rifts de-velop, as illustrated by experiment R10 (Fig. 7d).
Yet considering the results from the high-velocity rubber-base experiments R9 and R10 (Figs. 7c, d, 10m), those of the high-velocity brittle-viscous plate or conveyor base ex-periments P9 (Figs. 8f, g, 10n) and C12 (Fig. C2) may seem somewhat remarkable; instead of developing distributed rift-ing, these experiments generate a “down-bent” depression bordered by marginal grabens (Figs. 8f, g, 10n, C2), that may also be present in the models by Gabrielsen et al. (2016). The high extension velocity in P9 and C12 (80 mm h−1) causes high coupling between the viscous layer and the brittle cover (strength ratio: 4.4), as well as between the viscous layer and the base. This basal coupling leads to intense stretch-ing (neckstretch-ing) above the VD(s) and subsequent downward “bending” of the sand cover (Fig. 8g). High coupling be-tween the viscous layer and the base also explains why no apparent boundary effects are visible along the longitudinal sidewalls. The bending of the brittle layer at the edge of the system causes local extension in the sand and the formation of marginal grabens, which seems to resemble the structures along the Western Escarpment of the Afar (northernmost sec-tor of the East African Rift System) in Ethiopia (e.g. Abbate and Sagri, 1969; Chorowicz et al., 1999). However, interest-ing as these structures may be, the high extension velocities may approach unrealistic values (see Sect. 2.4), highlighting the importance of careful model scaling.
As previous studies have shown, increasing brittle-viscous coupling can be linked to more distributed faulting styles (e.g. Davy et al., 1995; Schueller et al., 2005, 2010; Dyk-sterhuis et al., 2007; Moresi et al., 2007; Buiter et al., 2008; Zwaan et al., 2016), which is seen in our rubber base exper-iments as well (experexper-iments R9 and R10; Figs. 7c, d, 10m). However, the experiments in these previous studies generally use a very weak or free-slip base, allowing their models to be (fully) controlled by the rheology of the brittle-viscous lay-ers. When such basal boundary conditions are not met, cou-pling between the viscous layer and the substratum is also an important factor as illustrated by our plate and conveyor base experiments (experiments P9 and C12) (Figs. 8f, g, 10n, C2). We thus identify a competition between brittle-viscous cou-pling and viscous-basal coucou-pling in such systems, depending
on which the resulting structures may vary widely. Within the context of extensional tectonics, this is in line with the concept that the strength of the uppermost mantle can have a significant influence on the deformation of the overlying crustal layers (e.g. Brun, 1999; Corti et al., 2003).
4.5 Effects of different brittle-to-viscous thickness ratios
Our brittle-viscous plate and conveyor base experiments with the reference parameters but no seed (P3, P7, C4, Figs. 8c– d, 9c, 10k) fail to produce proper rift basins, in contrast to their brittle-only equivalents (experiments P1, P2, C1 and C3, Figs. 8a, b, 9a, b, 10i, j). Instead, we either need a seed as in the foam and rubber base experiments (experiment P10, Figs. 8e, 10l) or a high brittle-to-viscous thickness ratio (> 2) to localize deformation (experiments C8 and C11, Fig. 9e– g). The decrease in viscous layer thickness in experiments C7 and C8 causes increasing strength contrasts: from the ref-erence value of 84 to 169 and 337, respectively (Table 2), corresponding to a trend towards localized (narrow) rifting (Fig. 9c–e). This is in line with the model results presented by Brun (1999), for example. However, increasing the extension rate in experiment C11 (resulting in a lower strength con-trast) does not lead to distributed deformation, but to more lo-calized faulting. Similar to the high extension rate examples discussed in Sect. 4.4, our results thus suggest that brittle-to-viscous strength ratios alone are not sufficient to properly infer a specific rifting mode, but that additional factors such as viscous-basal coupling need to be considered as well.
Figure 12.Strength profiles calculated for our reference experiments(a)and various natural cases(b–f). Reference values for the natural example areTmoho=600◦C andv=0.5 mm yr−1(b). Extension velocity variations are shown in(c)and(d)and variations due to different Moho temperatures are depicted in(e)and(f). The crust and mantle flow laws used here are anorthosite dislocation creep (Rybacki et al., 2006) and olivine dislocation creep (Hirth and Kohlstedt, 2003). Note that the filled-in profile represents a wet lithosphere, whereas the dotted profiles delineate a dry lithosphere scenario. The horizontal lines indicate various brittle-to viscous ratios (see discussion in text).
due to factors as higher strain rates (Keep and McClay, 1997; Michon and Merle, 2000), asymmetric extension or possibly syn-rift sedimentation (e.g. Brun and Tron, 1993; Fig. 11g). The formation of a single- or dual-rift structure is most likely influenced by the viscosity of the viscous layer as well. Ex-periments with high brittle-to-viscous thickness ratios thus seem to be highly sensitive to various parameters. Whether the various thickness ratios mentioned above are realistic de-pends on the specific tectonic setting that is simulated, as lithospheric rheological profiles are known to vary consid-erably in extensional settings (e.g. Brun, 1999; Burov, 2011; Tetreault and Buiter, 2018; see also Sect. 4.7).
4.6 Boundary effects and experimental confinement
Most of our reference experiments, except for the brittle-only plate and conveyor base experiments, develop some degree of normal faulting along the long sidewalls (Fig. 10). In the brittle-only experiments, this may be due to enhanced local stretching of the rubber base (Ackermann, 1997), an effect quite possibly present in the foam base equivalents as well. The rigid sand layer in the brittle-viscous experiments on the other hand is subject to “inertia”, i.e. an inability to move and extend as easily as the viscous materials, leaving “gaps” along the sidewalls that take up significant amounts of defor-mation in the experiment (Zwaan et al., 2018a).
This “inertia” effect occurs in various model studies and may significantly affect the quality of the experimental re-sult. Some authors seem to avoid these problems by simply ignoring them and focussing on the structures in the centre of the experiment. Others attempt to reduce faulting by ap-plying a viscous layer that does not reach the model side-walls (Tron and Brun, 1991; Schreurs et al., 2006; Gabrielsen et al., 2016). However, by narrowing the viscous layer, the
boundaries of the viscous material become rheological con-trasts that may trigger faulting themselves, thus causing a new type of boundary effect (e.g. Bonini et al., 1997). This also raises the question of what the viscous layer represents in nature if not a continuous viscous lower crust. Even nar-rower patches of viscous material, for instance simulating a weak zone in the crust due to magmatism, may lead to nar-rower rift structures (e.g. Brun and Nalpas, 1996; Dauteuil et al., 2002) and the seeds in our experiments can be seen as the most extreme exponent of this trend. The inferred width of the structural weakness is also relevant for set-ups involv-ing a narrow rubber base fixed between two base plates (e.g. McClay and White, 1995; McClay et al., 2002; Corti et al., 2007; Henza et al., 2010). In such experiments, all deforma-tion tends to focus above the rubber sheet, with its edges act-ing as VDs, imposact-ing the boundaries of the rift system (see also Sect. 4.2).
method to induce deformation directly at the base of the ex-perimental materials: only moving apart the two longitudinal sidewalls may suffice to cause uniform spreading of the vis-cous layer (e.g. Le Calvez and Vendeville, 2002; Marques, 2012). However, the results of such experiments may again vary with different strain rates, layering and layer thickness, materials, application of sedimentation, etc., highlighting the challenges of directly comparing the results from different modelling studies and the need to specify all relevant pa-rameters and boundary conditions, as well as any resulting boundary effects.
4.7 Recommendations for further extension experiments
Our extension experiments represent different rheological stratifications and extension conditions, and may serve as a guide for future modelling studies aiming at investigat-ing extension in specific tectonic settinvestigat-ings (Fig. 3). Since the overview presented in Fig. 3 remains schematic, we calcu-lated a series of rheological profiles for natural cases to al-low for a direct rheological comparison to the experimental strength profiles (Fig. 12). We used the rheological values of Table 3 with laboratory flow laws often adopted for the lower crust and lithospheric mantle (Hirth and Kohlstedt, 2003; Ry-backi et al., 2006) and we varied both extension velocity (0.5 to 10 mm yr−1) and Moho temperature (550 and 650◦C). The calculations show that extension velocity has a relatively mi-nor influence on the rheological profile with respect to tem-perature and dry or wet versions of the flow laws. The plots also indicate that our reference brittle-to-viscous thickness ratio of 1:1, although often used in analogue models (Corti et al., 2003, and references therein), is quite low (compare Fig. 12a with Fig. 12b) and may only occur in a relatively wet and hot lithosphere (Figs. 3b, 12f). This may for instance be in accordance with the situation in the East African Rift System (Fadaie and Ranalli, 1990; Corti, 2009), but a 2:1 or 3:1 ratio would fit better with the calculations for a normal-temperature lithosphere (Fig. 12b–d). A strong upper man-tle, as inferred for (brittle-viscous) plate and conveyor base set-ups, only occurs in a wet cold lithosphere (Fig. 12e) or in a completely dry lithosphere (dotted lines in Fig. 12), yet the complete absence of hydrous minerals may be unrealistic (Xia and Hao, 2010). Furthermore, our strength profile cal-culations are based on monomineralic flow laws (anorthosite and olivine; Hirth and Kohlstedt, 2003; Rybacki et al., 2006), whereas continental rocks are of course polymineralic. Dif-ferent rheological profiles for natural settings can be obtained by not only varying the thermal gradient, but also by varia-tions in water content, temperature or by simply using other flow laws. We choose lower crust and mantle flow laws (Ry-backi et al., 2006; Hirth and Kohlstedt, 2003, respectively) that are fairly recent and neither overly weak nor strong in comparison with other flow laws.
The rheological calculations highlight that one should carefully consider the various factors that may influence the strength of the lithosphere in a given tectonic setting be-fore selecting a specific experimental set-up. It is also im-portant to stress that although the materials involved may only represent the upper parts of the crust, deeper parts of the lithosphere (basement or mantle) are simulated via the chosen experimental extension mechanism (Fig. 3). This is most evident for brittle-only experiments that are directly coupled to the set-up (Fig. 10). However, we have shown that for low extension velocity brittle-viscous experiments, which aim at representing a hot lithosphere, any extension mech-anism should suffice due to the high degree of decoupling (Fig. 10). This decoupling effect could also allow for a sim-ple way to model an oceanic lithosphere, which is generally considered to comprise a brittle oceanic crust and a viscous lithospheric mantle (e.g. Benes and Scott, 1996). Note, how-ever, that in such experiments an imposed weakness seems to be necessary to create any rift structure at all (Fig. 10). Since efforts should be made to keep boundary effects to a mini-mum, we recommend using the foam base method for such brittle-viscous models (see also Sect. 4.6).
Our experiments could be extended to include more lay-ers (three- or four-layer lithospheres) (e.g. Corti et al., 2003, and references therein) and an underlying asthenosphere that would allow for an assessment of the effect of isostatic com-pensation on a stretching lithosphere. In such cases a strong lithosphere would strongly affect rifting processes (Brun, 1999; Corti et al., 2003), whereas in the case of a weak litho-sphere (Figs. 3b, e, 12f) the (rising) asthenolitho-sphere may have an important impact. The presence of an asthenosphere ana-logue would also allow the vertical motions associated with a major fault or shear zone in the strong upper mantle (e.g. Vendeville et al., 1987; Allemand and Brun, 1991, Fig. 1). In the commonly used plate and conveyor base set-ups, such a fault is represented by the VD, yet any associated vertical motions are not simulated. The symmetric conveyor belt ex-tension mechanism may not be well suited to crustal-scale models, as the continuous “upwelling” of the plastic sheets resembles a convection cell system, which could be taken to simulate sub-lithospheric mantle behaviour and would there-fore be more appropriate for lithospheric-scale models driven by mantle convection. For crustal-scale wide rift experiments we recommend using an asymmetric plate base or conveyor belt mechanism instead, which are the same after a shift of reference frame (Appendix A).