https://doi.org/10.5194/se-10-1219-2019
© Author(s) 2019. This work is distributed under the Creative Commons Attribution 4.0 License.
Distinct element geomechanical modelling of the formation of
sinkhole clusters within large-scale karstic depressions
Djamil Al-Halbouni1,2, Eoghan P. Holohan3, Abbas Taheri4, Robert A. Watson3, Ulrich Polom5, Martin P. J. Schöpfer6, Sacha Emam7, and Torsten Dahm1,2
1Helmholtz Centre – German Research Centre for Geosciences (GFZ), Physics of Earthquakes and Volcanoes,
Telegrafenberg, Potsdam, Germany
2University of Potsdam, Institute of Geosciences, P.O. Box 601553, Potsdam–Golm, Germany 3UCD School of Earth Sciences, University College Dublin, Belfield, Dublin, Ireland
4School of Civil, Environmental and Mining Engineering, University of Adelaide, Adelaide, South Australia, Australia 5Department S1 – Seismics, Gravimetry, and Magnetics, Leibnitz Institute for Applied Geophysics (LIAG),
Stilleweg 2, Hanover, Germany
6Department for Geodynamics and Sedimentology, University of Vienna, Athanstrasse 14, Vienna, Austria 7Geomechanics and Software Engineer, Itasca Consultants S.A.S, Écully, France
Correspondence:Djamil Al-Halbouni ([email protected]) Received: 26 January 2019 – Discussion started: 29 January 2019
Revised: 24 May 2019 – Accepted: 19 June 2019 – Published: 29 July 2019
Abstract. The 2-D distinct element method (DEM) code (PFC2D_V5) is used here to simulate the evolution of subsidence-related karst landforms, such as single and clus-tered sinkholes, and associated larger-scale depressions. Sub-surface material in the DEM model is removed progres-sively to produce an array of cavities; this simulates a net-work of subsurface groundwater conduits growing by chem-ical/mechanical erosion. The growth of the cavity array is coupled mechanically to the gravitationally loaded surround-ings, such that cavities can grow also in part by material fail-ure at their margins, which in the limit can produce individual collapse sinkholes. Two end-member growth scenarios of the cavity array and their impact on surface subsidence were ex-amined in the models: (1) cavity growth at the same depth level and growth rate; (2) cavity growth at progressively deepening levels with varying growth rates. These growth scenarios are characterised by differing stress patterns across the cavity array and its overburden, which are in turn an important factor for the formation of sinkholes and uvala-like depressions. For growth scenario (1), a stable compres-sion arch is established around the entire cavity array, hin-dering sinkhole collapse into individual cavities and favour-ing block-wise, relatively even subsidence across the whole cavity array. In contrast, for growth scenario (2), the stress
system is more heterogeneous, such that local stress concen-trations exist around individual cavities, leading to stress in-teractions and local wall/overburden fractures. Consequently, sinkhole collapses occur in individual cavities, which results in uneven, differential subsidence within a larger-scale de-pression. Depending on material properties of the cavity-hosting material and the overburden, the larger-scale depres-sion forms either by sinkhole coalescence or by widespread subsidence linked geometrically to the entire cavity array. The results from models with growth scenario (2) are in close agreement with surface morphological and subsurface geo-physical observations from an evaporite karst area on the eastern shore of the Dead Sea.
1 Introduction
pose a significant hazard to humans and infrastructure. Sink-holes, also termed dolines, are the prominent karst land-forms (Waltham et al., 2005). They form enclosed small- to large-scale depressions that are commonly considered to be morphological expressions of material removal in the under-ground and subsequent collapse of the overburden (Gutiérrez et al., 2014; De Waele et al., 2011; Waltham, 2016). Often, systems develop into agglomerations of closely spaced or co-alesced dolines and elongated valley-like depressions, poten-tially revealing linear patterns of drainage (Waltham et al., 2005). Such sinkhole cluster development can be highly dy-namic and partly accelerating, and may affect large areas in short times (e.g. Abelson et al., 2017). Understanding their development and, where possible, their precursory signals is of utmost importance to mitigate their hazard and to promote sustainable land and water usage.
The main problem for unravelling the geometric and ge-netic relationships between sinkhole cluster development and larger-scale depressions in limestone karst areas, where such landforms have historically been best described, is that the landform evolution is controlled by the relatively slow dis-solution kinetics of carbonate minerals. Consequently, the development of these karstic landform types is not directly observable in such areas, and furthermore, it is suscepti-ble to long-term influences from climate change and tec-tonic activity. Indeed, the areas in which dolines and other karstic depressions have been historically best documented have been modified not only by karst processes but also by fluvial and/or glacial processes (compare ´Cali´c, 2011).
An opportunity to shed new light on such relationships has arisen in an evaporite karst setting at the margins of the shrinking Dead Sea (Yechieli et al., 2016). There, clus-ters of tens to over a hundred sinkholes (1–75 m diameter) that are surrounded by larger-scale (100–800 m diameter) de-pressions have rapidly developed over the last 40 years (Al-Halbouni et al., 2017; Atzori et al., 2015; Filin et al., 2011). In particular, recent studies by (Al-Halbouni et al., 2017; Watson et al., 2019) involving field work, remote sensing and photogrammetric surveying enabled the detailed docu-mentation of spatiotemporal relationships between sinkhole and depression development at Ghor Al-Haditha, on the east-ern shore of the Dead Sea (Fig. 1a). The area exhibits mature karst landforms comprising individual and compound sink-holes. The term “compound sinkhole” here means the nested or non-nested coalescence of individual sinkholes. Sinkhole clusters or aggregations commonly comprise multiple indi-vidual sinkholes and/or compound sinkholes in close prox-imity. Such clusters commonly lie within gentler, larger-scale (uvala-like) depressions of up to several hundreds of metres in diameter, as depicted in Fig. 1b and c.
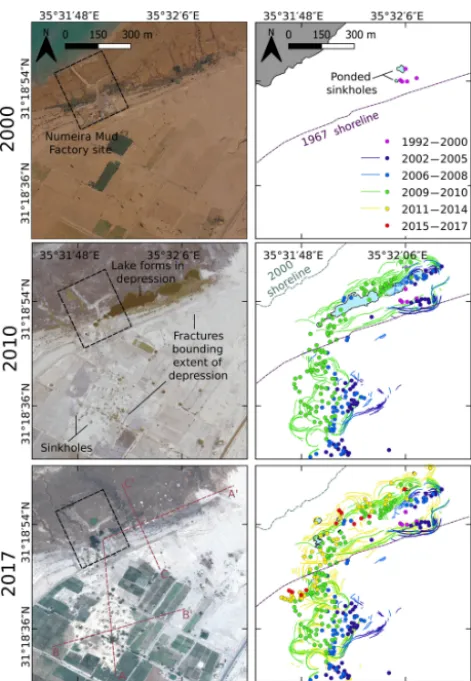
Initially, these karst landforms develop as small localised subsidence zones, with single sinkholes that form in hetero-geneous material made of Dead Sea mud, alluvial fan sedi-ments and salt (Watson et al., 2019). Wider-scale subsidence and sinkhole clustering follow, with ground fracture systems
developing that are geometrically related to the larger-scale depression rather than to the individual sinkholes or sinkhole clusters (Fig. 2).
In this paper, we test the hypothesis that the driving pro-cess for the geomorphological and structural development of such large-scale karst features is a widespread, differential subsidence above an array of subsurface cavities, with tem-porally and spatially variable patterns of material removal driven by base-level fall associated with the shrinking of the Dead Sea.
To test our hypothesis, we use a novel 2-D distinct ele-ment method (DEM) numerical modelling. We examine two end-member growth scenarios of model cavity arrays, and we look at the surface morphologies, subsurface structure and stress patterns developed by subsidence of the overburden as those cavity arrays grow. The numerical results are dis-cussed with respect to both surface and subsurface data from the Dead Sea evaporite karst. Interpretation of shear wave re-flection data indicates that the subsurface under the alluvial fan sediments at the Ghor Al-Haditha site is characterised by inclined layering typical of a prograding Gilbert-type delta, superimposed on which are zones of disrupted seismic reflec-tors, as well as bowls and depression structures (Polom et al., 2018). We provide in this work both a qualitative and quanti-tative comparison of the results from the seismic survey and from the numerical modelling. We show that our more plex end-member modelling scenario is able to explain com-plementary observations from surface morphology to subsur-face hydrology and subsursubsur-face geophysics.
2 Numerical approach
ma-Figure 1.Topography of the Ghor Al-Haditha sinkhole area.(a)Digital surface model (DSM) from 2016 on Pleiades satellite image from 2015 for the sinkhole area at the Dead Sea (inset). The DSM has a resolution of 10 cm px−1and accuracy of 37 and 31 cm (H and V), respectively. The main zone affected by sinkholes extends from the south towards the NNE along the contact zone between alluvial fans and the mud flat (dashed white line) and comprises several partly connected large depression zones, of which the main area is indicated by the square. SP1 is a section of seismic profile 1 of Polom et al. (2018).(b)Typical examples of sinkhole formations in the main depression. (I) View from the stable agricultural area towards the centre of the depression. (II) Nested sinkholes and ground cracks from the opposite view. (III) Destroyed “Numeira” mud factory at the turning point (TP) of the depression.(c)N–S and E–W topographic profiles across the several-hundred-metre depression, derived from the DSM of 2016.
terial is represented as an assembly of non-deformable par-ticles in the shape of disks of unit thickness (2-D, Fig. 3) or spheres (3-D). The particles are assigned a density, ra-dius and elastic contact modulus. They are assembled with a certain porosity and follow a defined size distribution. The particles follow the Newton–Euler laws of motion and the linear force-displacement law as they interact elastically at each contact point. The assembly is generated via a ran-domised particle-packing scheme and a gravitational settling scheme (Al-Halbouni et al., 2018), after which particles can be bonded with their neighbours (Potyondy and Cundall, 2004). In this study, we used the parallel-bond model (PBM) in the commercially available PFC2D software (Potyondy, 2014), which sets a second pair of elastic springs that in-corporate moments and can fail either in shear or tension, al-lowing for a complex elasto-plastic rheology (Al-Halbouni et al., 2018; Holohan et al., 2011; Potyondy and Cundall, 2004;
Schöpfer et al., 2009). The resulting differential equations are solved via a finite-difference explicit time-stepping al-gorithm (Jing and Stephansson, 2007). Each model requires multiple realisations as the outcomes generally depend on the randomised particle packing. For more mathematical de-tails on the calculations and modelling scheme, refer to Al-Halbouni et al. (2018), Itasca (2014), Jing and Stephans-son (2007), Potyondy (2014) and Wang et al. (2018).
2.2 Cavity growth in a DEM model
Figure 2.Remote sensing analysis of the evolution of sinkholes, cracks and large depressions at the main depression of Ghor Al-Haditha, Dead Sea. Small single sinkholes appear in 2000 at the former “Numeira” mud factory site (0.6 m px−1aerial photo from Royal Jordanian Geographic Centre). Up to 2010, lakes, sinkhole clusters and large fractures have appeared around a depression zone spanning over both alluvium and the mud flat (0.5 m px−1 GeoEye-1 satellite image). Up to today, the number of fractures and sinkholes as well as the depth of the depression has increased (0.5 m px−1Pleiades satellite image). Red lines in lower left image mark the locations of the profiles shown in Fig. 1c.
uniform particle distribution between a minimum (Rmin=
0.24 m) and maximum particle radius (Rmax=0.4 m); an
ini-tial porosity of the unsettled assembly of n=0.2; no-slip boundary conditions; and a fixed wall elastic modulus of Ew=5 GPa. Instead of simulating material removal in a
single cavity as in Al-Halbouni et al. (2018), here, we im-plemented an array of multiple cavities of arbitrary shape (Fig. 3a; see Appendix A1). The adopted procedure is an in-cremental particle removal that mimics subrosion, i.e. the re-moval of subsurface material by chemical leaching and/or physical erosion. Our 2-D model thus represents a flow-perpendicular cross-section through a groundwater conduit network, which we envisage to result from dissolution that rapidly localises through a feedback mechanism of enhanced
Figure 3.Generic setup for multiple cavity modelling with DEM. (a)The core of the model and the specific setup of the void zone and implemented features. Arbitrary material removal zones can be defined and associated with different removal functions activated at arbitrary removal zone growth increments.(b)The subrosion pro-cedures for (1) models with deep constant subrosion and (2) models with deepening and differential cavity growth are highlighted.
fluid flow with increasing dissolution (Weisbrod et al., 2012) and which in turn can also promote conduit growth by phys-ical erosion.
2.3 Material parameters
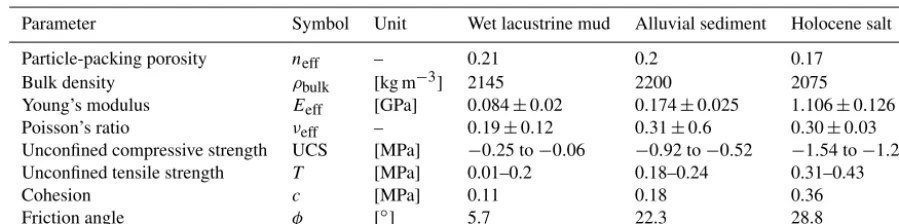
The bonded particle assembly’s bulk material properties, which emerge from the properties defined on the particle scale, were constrained by simulated geomechanical tests on material samples (Schöpfer et al., 2007; Al-Halbouni et al., 2018). Parallel-bond tensile strength, modulus and fric-tion, cohesion and friction angle, as well as contact modulus and friction, are hence transferred to corresponding bulk val-ues of unconfined compressive strength (UCS) and tensile strength (T), Poisson’s ratio (ν) and Young’s modulus (E). This calibration procedure has been done for three materials representing those in which sinkholes form at the Dead Sea shoreline: (1) low-strength marl (mud) of the former Dead Sea lake bed, (2) middle-strength sandy-gravel alluvial fan sediments and (3) relatively high-strength Holocene rock salt of the Dead Sea (Table 1). For (1), a bond-healing proce-dure has been implemented to account for a more realistic recombination behaviour of naturally wet muddy material. For each material, the calibration was run on 10 subsamples ofH×W=10×8 m size, with approximately 200 particles of a mean radiusR=0.32 m. See Al-Halbouni et al. (2018) for details on the procedure.
2.4 Geophysical parameter tracking
Distributed measurement circles of 10 m diameter (area Am=78.5 m2)are used to record stresses, strain rates, po-sitions and porosity of the particle assemblies (see Al-Halbouni et al., 2018, for details). From recording of the stress components (σxxσxy, σyx, σyy) and particle areas, we calculate the principal stresses, σ1 (most compressive, i.e.
most negative) and σ3 (least compressive) The maximum
shear stress is calculated via half the differential stress (e.g. Holohan et al., 2015):
τmax=
(σ3−σ1)
2 . (1)
For strain calculation, the displacement gradient tensor is cal-culated for particles inside the 50 % overlapping measure-ment circles between two simulation stages (e.g. Schöpfer et al., 2006). The maximum in-plane shear strain is determined via the principal strains (ε1,ε3) and the shear strain (γxy):
γmax=2 s
(ε1−ε3)2
2 +
γxy2
2 . (2)
We use porosity-tracking results to determine apparent elas-tic moduli, which can then be translated via bulk density into apparent bulk seismic velocities. In general, for a homoge-neous, linearly elastic, isotropic medium, compression wave velocities (vp) and shear wave velocities (vs) are estimated
by
vs= s
G
ρ (3)
vp= s
K+4
3ν
ρ =
s
2G(1−ν)
ρ (1−2ν). (4)
KG are the bulk/shear modulus, respectively. E=2G (1+ν) is Young’s elastic modulus for homo-geneous, isotropic materials, withνas the Poisson ratio.ρis the bulk density calculated byρ=ρparticle(1−n), withnas
the particle-packing porosity. A correction factor is needed to account for the differences between static and dynamic moduli to enable a comparison of numerical simulation with field data. Dynamic field methods like seismic reflection profiling measure at small strains and therefore reveal high values of the shear modulus. E andν of the model mate-rials are known from simulated large-strain compression tests for a variation of confining pressures and porosities (Al-Halbouni et al., 2018). We here useGdyn ∼1.5×Gstat,
the dynamic shear modulus, approximated as a minimum scaling of the static shear modulus determined for uncon-solidated sand in a cycling loading/unloading and shearing test (Soldal and Mondol, 2015). The factor depends on the applied static technique in laboratory experiments and on the cycles; the difference arises mainly from the strain amplitude (Hammam and Eliwa, 2013; Wichtmann and Triantafyllidis, 2009). Furthermore, from the simulated compression tests, conservative values for moduli and Poisson ratio are taken at limits where few or no cracks have appeared in the sample. For a more realistic approach, the values are further adjusted by accounting for the crack (broken bond) density in the model, following Dahm and Becker (1998). For the adjustment to the DEM, crack density is defined as c=kπ R/Am, withk as the number of cracks,Amthe area of the measurement circle andR the mean particle radius, which is a proxy to the parallel-bond (crack) half length (see Al-Halbouni et al., 2018, for details). Cracks, i.e. broken parallel bonds in DEM, are recorded by using an intrinsic “fishcall” procedure (Hazzard, 2014; Hazzard and Young, 2004) and distributed onto the according measurement circles. With increasing crack density, ν and the apparent (effective) shear modulusGeffare expected to change by
ν(c)= (1−ν0) e
f c
2 +2ν0−1
2(1−ν0) e f c
2 +2ν0−1
(5)
G(c)eff=G0/(2(1−ν0) e f c
2 +2ν0−1). (6)
For randomly oriented cracks, the mean of the shear trac-tions on the cracks is one-half of the maximum shear stress in the body (compare Dahm and Becker, 1998), for which a factor off =0.5 can be estimated. Furthermore,ν0=0.5 is
Table 1.Estimated mean bulk geomechanical properties of the main materials in sinkhole-affected areas at the Dead Sea. The variation of the bulk strength values is related to analysis by both Mohr–Coulomb and Hoek–Brown failure criteria assuming intact rock (Al-Halbouni et al., 2018). Note the geotechnical engineering convention of compressive stress being taken as negative.
Parameter Symbol Unit Wet lacustrine mud Alluvial sediment Holocene salt
Particle-packing porosity neff – 0.21 0.2 0.17
Bulk density ρbulk [kg m−3] 2145 2200 2075
Young’s modulus Eeff [GPa] 0.084±0.02 0.174±0.025 1.106±0.126
Poisson’s ratio νeff – 0.19±0.12 0.31±0.6 0.30±0.03
Unconfined compressive strength UCS [MPa] −0.25 to−0.06 −0.92 to−0.52 −1.54 to−1.23
Unconfined tensile strength T [MPa] 0.01–0.2 0.18–0.24 0.31–0.43
Cohesion c [MPa] 0.11 0.18 0.36
Friction angle φ [◦] 5.7 22.3 28.8
the shear modulus of a homogeneous, isotropic rock mass (Dahm and Becker, 1998).
3 Modelling results
In this section, we present outcomes of both end-member cavity growth scenarios, while focussing on a final model setup that most closely reproduces the natural karst land-forms (Sect. 1). For both end-member cavity growth scenar-ios, we also show the results of models for layered combi-nations of weak and strong materials common at the Dead Sea shoreline. Note that for certain model conditions (weak material and/or deep subrosion; see also Al-Halbouni et al., 2018) the cavity walls and overburden tend to collapse im-mediately, and so cavities may remain small during a model evolution or may exist only instantaneously for each incre-ment of material removal.
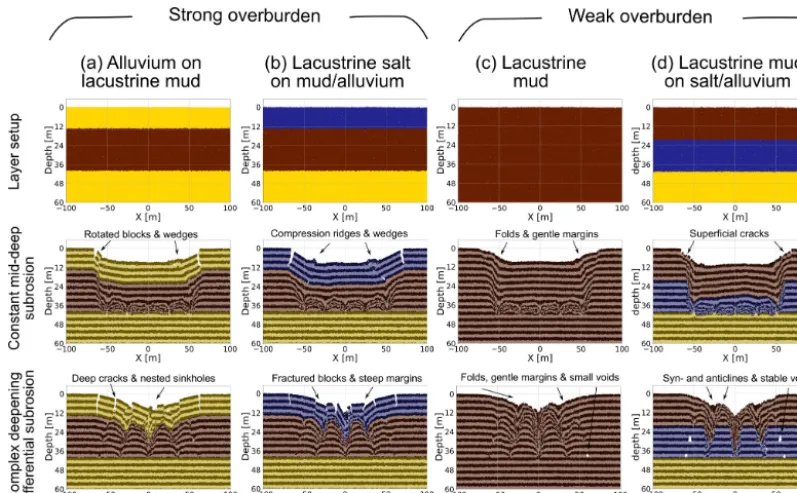
In Fig. 4, we compare the outcomes of both end-member cavity growth scenarios for four different material setups representing weak and strong overburden configurations: (I) alluvium-on-lacustrine mud (Fig. 4a), (II) a thin salt layer above lacustrine mud and alluvium (Fig. 4b), (III) pure la-custrine mud (Fig. 4c) and (IV) a mud layer above a salt and alluvium succession (Fig. 4d). In this overview, a clear difference between the cavity growth scenario (1), constant medium-depth (40 m) subrosion, and scenario (2), a differen-tial deepening subrosion, can be seen. While scenario (1) re-sults in block-wise subsidence or large-scale sagging over the entire array, scenario (2) reproduces the observed pattern of multiple sinkholes in a large-scale depression zone. The main structural and morphological features that relate to dif-ferences in material and in subrosion scenario are marked in each individual plot.
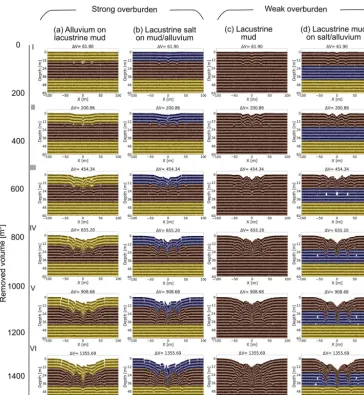
In Fig. 5, we show the main evolutionary stages (I–VI) of sinkhole/depression development for cavity growth nario (2), i.e. the deepening differential cavity growth sce-nario. Detailed animations of the evolution can be found in the Supplement.
For all combinations of material type, the large-scale de-pression is deepest throughout the evolution above the central and fastest growing cavity in each array (as per definition in the model setup).
In general, for the material combination of a strong or weak overburden above a weak cavity-hosting material (Fig. 5a–c), individual sinkholes form synchronously with, or just before, the development of a larger-scale synclinal depression that initially spans several central cavities and eventually spans the cavity array as a whole. The forma-tion of the sinkholes more clearly predates the array-scale depression where the overburden is weak. The margins of the array-scale synclinal depression are commonly delim-ited, especially in the strong overburden, by fractures and/or faults. These marginal fractures geometrically relate to sub-sidence across several cavities or to subsub-sidence across the en-tire array, rather than to collapses into individual cavities. In weaker overburden, the margins of the main depression are defined by inward bending (sagging) of the overburden lay-ers (although in detail there are many small-scale fractures here).
For the material combination of a weak overburden above a strong cavity-hosting material (Fig. 5d), large cavities can develop before the overburden collapses into them. This pro-duces deeper and wider sinkholes in the later stages of the model evolution. Also in this case, the strong cavity-hosting material does not deform so easily around the cavity array as a whole; therefore, synclinal bending of the overburden across the cavity array is much less pronounced. Conse-quently, a larger-scale depression forms in this case mainly by nesting and coalescence of the sinkholes.
syn-Figure 4.Comparison between final results for two cavity growth end-members and different material compositions common at the Dead Sea shoreline. The removed volume at the shown stages is approximately 900 m3. Strong overburden:(a)alluvium/mud succession and (b)salt-on-mud/alluvium succession. Weak overburden:(c)pure lacustrine mud and(d)mud-on-salt/alluvium succession. Note that passive marker layers are applied to highlight structural features.
clinal form. These cavity-scale synclinal structures represent the downward flow of the weak material into the cavities or, where cavity formation is inhibited, into the zones of mate-rial removal.
Depth-to-diameter (De/Di) ratios of simulated sinkholes and depressions are given in Table 2 as mean values of five model assemblies of each material combination. The dimen-sions of depresdimen-sions at the scale of the entire cavity array range from∼65 to 190 m across and∼2 to 18 m deep, while individual sinkholes have dimensions of∼1.5–36 m across and∼0.5–12 m deep. Higher De/Di ratios of 0.48–0.64 for sinkholes are generally recorded for cover material of higher strength (alluvium, salt), while lower De/Di ratios of 0.22– 0.24 are found for low-strength cover material (mud). The De/Di ratios of 0.08–0.14 of the larger-scale depressions are many times lower (in some cases, nearly an order of magni-tude lower) than those of the sinkholes.
The evolution of depth and diameter of large-scale depres-sions (Fig. 6) shows the influence of the material strength on their geometries. A clear divergence can be observed be-tween mud subsurface and salt subsurface models. A me-chanically weak subsurface (mud) enables a lateral widening of the depression at the expense of deepening. A mechani-cally strong (salt) subsurface inhibits the synclinal bending at the margins of the main depression, leading to deepening of the depressions and preventing their widening.
The influences of different positions and different speeds of material removal zones have also been tested thoroughly
(see Appendix A for details). In all material cases for sce-nario (1), i.e. the constant cavity growth level and rate, and regardless of the depth of the array, only large, array-scale depressions occur and no sinkholes form in relation to the individual cavities. A shallower cavity array leads only to faulting/segmentation of the sinking block and/or fracturing of the margins. Varying the speed of array-wide subrosion produces no discernible difference in model outcome, as ex-pected for the quasi-static approach.
Figure 5.Final model sinkhole evolution results for four different material combinations common at the Dead Sea shoreline. Strong over-burden:(a)alluvium/mud succession and(b)salt-on-mud/alluvium succession. Weak overburden:(c)pure lacustrine mud and(d) mud-on-salt/alluvium succession. The removed volume [m3] is shown above the plots. Note that passive marker layers are applied to highlight structural features.
3.1 Stresses and strains in a multiple void space system
The differences in model outcome depending on the cavity growth scenario are better understood when looking at the stress and strain distribution patterns. The maximum shear stressτmaxaround the cavity arrays in model cavity growth
scenarios (1) and (2) is shown in Fig. 7. We here compare two different material setups: strong alluvium on weak mud and weak mud on strong salt and alluvium. Each model has the same particle assembly and comprises five void spaces at∼40 m depth at stages immediately before or exactly dur-ing the collapse of the overburden. The differential subrosion scheme here uses the same setup as in the model (Fig. 14g) in Appendix A2, which is without a deepening of the subrosion zone, to avoid effects of remnant stress distributions.
Regarding the mechanical development, cavity growth scenario (1) produces a stress arch spanning the whole array of cavities, best visible in the alluvium-on-mud combination of Fig. 7a. For cavity growth, scenario (2) produces a more complex pattern of more localised stress concentrations and arches appearing around or between individual cavities. The setup of a constant cavity growth rate hence leads to a block-wise subsidence, while for differential cavity growth rate, the interaction of stresses around and between the cavities leads to multiple sinkhole development in a large-scale depression. Appendix A3 shows similar results for principal stresses.
For the same scenarios, the maximum shear strainγmaxis
fault-Table 2.Depth-to-diameter ratios of simulated array-scale depressions. The average results for the four different material setups and different stages of depression development are given. The depth of a depression is hereby considered the deepest point that might coincide with the deepest point of a sinkhole within the depression. The diameter goes as far as a vertical surface displacement of∼10 cm amplitude can be observed. A total of five realisations were done for each material combination.
Type/model setup Lacustrine mud Alluvium on mud Salt on mud/alluvium Mud on salt/alluvium
Depression – early stage 0.05±0.003 0.03±0.009 0.04±0.003 0.07±0.006 Depression – middle stage 0.08±0.004 0.07±0.013 0.08±0.006 0.12±0.010 Depression – late stage 0.08±0.004 0.09±0.004 0.11±0.007 0.14±0.005
Sinkholes – final stage 0.22±0.12 0.48±0.36 0.64±0.3 0.24±0.08
Figure 6. Depth versus diameter for different stages of the final model large-scale depressions for different material combinations. A clear divergence can be observed between mud-rich subsurface and salt-rich subsurface models at the late stage of the simulation. The number of realisations of each model isn=5.
ing/segmentation for the differential subrosion scenario (2), with stable areas of low strain in between the subsiding blocks. In comparison to the shear stress images, this rep-resentation more clearly illustrates cracking and fracture de-velopment. These observations are complemented by the in-cremental strain and maximum shear stress evolution as pre-sented in Appendix A4 and A5.
3.2 Generic geophysical parameters
Figure 9 shows the synthetic geophysical parameters that characterise the model underground. As we consider a non-elastically deformed underground, all derived elastic parame-ters must be regarded as apparent. We concentrate on a snap-shot of the final stage of the alluvium-on-mud model simu-lating cavity growth scenario (2); see Fig. 5a at a removed volume of1V =1355 m3for the most important structural features. A deep and large depression zone with sinkholes has formed already. At this stage, the actively growing cav-ity set (or active subrosion zone) lies at ∼50 m depth. The initial porosities lie between 0.2 and 0.1 depending on the depth (Fig. 9a). We consider areas of porosities over 0.5 as “empty” space with a zero modulus/seismic velocity. Initial
values of the shear wave velocity in “stable” ground are 100– 150 m s−1for mud and 200–450 m s−1for alluvium (Fig. 9b). The porosity distribution at the final stage can be seen in Fig. 9c. The number of cracks is depicted in Fig. 9d. Note that cracks in alluvium are counted in a cumulative way, while cracks in mud are calculated per stage, due to the healing pro-cedure for broken bonds in mud (see Sect. 2 and Al-Halbouni et al., 2018). These cracks cause, in addition to the poros-ity, further changes of the apparent shear modulus (Eq. 6) and Poisson ratio (Eq. 5) and hence reduce the effective ap-parent elastic modulus of the underground (Fig. 9e). This is also expressed in the apparent shear wave velocity (Eq. 3) for the same stage (Fig. 9f). We observe strong changes in the central deep part of the model, where the largest void space growth rate exists. Remnants of earlier subrosion at shallower depths are nicely reflected in the apparent modu-lus and shear wave velocity distribution. More stable parts of the alluvium layers have higher values ofE> 500 MPa andvS> 275 m s−1 (HVZ – high-velocity zone). The
low-est values ofE< 100 MPa and vS< 100 m s−1 occur in the
mud layer close to the zones with highest porosity and most cracks in the currently active area cavity growth (very-low-velocity zone – VLVZ). In between lies the low-(very-low-velocity subrosion-affected part both in the mud and alluvium lay-ers (low-velocity zone – LVZ), corresponding to the areas of earlier cavity growth and overburden disruption. The model shows up to 75 % shear wave velocity reduction in the cen-tral subrosion-affected parts of the mud in comparison to the initial values and up to 50 % for the alluvial overburden or contact zone between mud and alluvium.
4 Discussion
Figure 7.Maximum shear stress around void spaces for(a)constant and(b)differential cavity growth scenarios models. Chosen are two material combinations where the subrosion-affected layer differs in strength: alluvium-on-mud multilayer and mud-on-salt/alluvium succes-sion. Shown are critical stages after void space installation followed by or exactly during overburden collapse for the same particle assembly. The removed volume [m3] is shown above the plots.
Figure 8.Maximum finite shear strain for(a)constant and(b)differential cavity growth scenarios models. Chosen are two material combi-nations where the subrosion-affected layer differs in strength: alluvium-on-mud multilayer and mud-on-salt/alluvium succession. Shown are the same critical stages after void space installation as in Fig. 7. The removed volume [m3] is shown above the plots.
features of the karst landform evolution typical in that area (Figs. 1, 2; compare Al-Halbouni et al., 2018; Watson et al., 2019):
– In all materials, multiple sinkholes have formed with many clustered, coalesced and/or nested.
– Larger-scale depression zones with pronounced marginal cracks have also developed around the sink-holes and sinkhole clusters. Formation of sinksink-holes began before, or at the same time as, the appearance of the first marginal cracks of the depression zones. Lateral expansion of the depression occurs in tandem with sinkhole formation.
– Morphological differences depend in which material the sinkholes form: low depth/diameter (De/Di) ratio for mud-flat sinkholes; high De/Di for alluvium sinkholes. Sinkholes in high-strength materials have partly over-hanging sides.
– The De/Di ratios of the larger-scale depressions are an order of magnitude lower than those of the sinkholes within them.
4.1 Implications for karst landforms of clustered sinkholes and large-scale depressions
As discussed by ´Cali´c (2011), for limestone karst areas, dif-ferences between enclosed depression types in karst regions occur in regard to scale, inter-relationship and morphometry. Sinkhole (or doline) diameters occur on a sub-100 m scale, uvalas typically occur on a several-hundred-metre to kilome-tre scale in limestone karst and so-called poljes on even a larger scale. A single uvala typically includes numerous do-lines within it, which led to the concept of uvala formation by doline coalescence (Gutiérrez et al., 2014; Waltham et al., 2005). The further development of dolines to uvalas and ul-timately to poljes, is regarded by most workers as erroneous, and some do not consider uvalas to evolve by doline coa-lescence either ( ´Cali´c, 2011). Although our simulations are purely mechanical and hence lack some important hydrolog-ical aspects for comparison to areas of limestone or evaporite karst, they nonetheless yield some new insights into the po-tential controlling factors on the inter-relationship between these different depression types.
Figure 9.Geophysical characterisation of the underground. Derived generic parameters for the initial and final models of alluvium on mud shortly before stage VI (see Fig. 5a).(a)Porosity and(c)distribution. Panels(b)and(f)indicate apparent shear wave velocities.(d)Number of cracks in the vicinity of the subrosion zone. Note that the cracks in the mud layer arise from the current stage of material removal (due to rebonding), whereas those in alluvium layers are accumulated throughout the model evolution.(e)Apparent dynamic elastic (Young’s) modulus. Black lines mark the initial limits of the mud horizon. The surface has collapsed partly into a depression plus sinkholes.
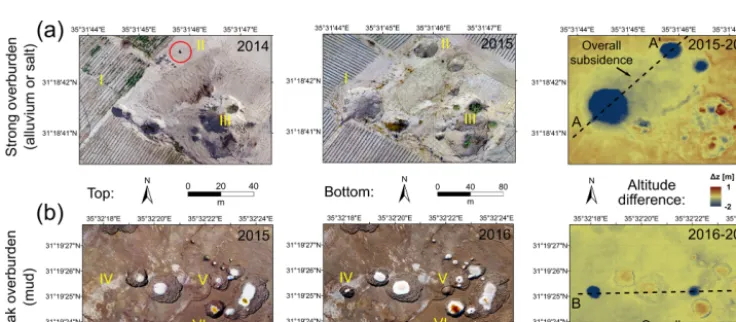
Figure 10.Examples for subsidence and sinkhole formation at Ghor Al-Haditha from orthophotos and DSM difference maps. All orthophotos and DSMs have the same resolution (10 cm px−1)and the accuracies (horizontal, vertical) are as follows: 2014 (10, 11 cm), 2015 (12, 17 cm) and 2016 (37, 31 cm).(a)Vertical displacement between 2014 and 2015 in the alluvium. Large sinkholes have formed in the alluvium (I, II) with slight overall subsidence along cross-section A–A’ from SW to NE. The red circle marks a small precursory hole at (II). Vegetation growth may cover subsidence effects in coalesced sinkholes (III).(b)Vertical displacement changes between 2015 and 2016 in the mud flat. Precursory information (reactivated sinkholes) may exist (IV) or not be visible (V). Nests of sinkholes exist (VI) in an area of pronounced overall subsidence of 0.5 m±0.2 m determined for cross-section B–B’ from W to E. Compare topographic profiles in Fig. 11.
rate across the cavity array alone is not sufficient to gener-ate sinkhole clusters, even if the interacting cavities were at different depths. This is due to the resultant stress sys-tem, whereby a well-developed stress arch spans the entire constant-growth cavity array, which acts mechanically as a single entity. A differential cavity growth, on the other hand, produces more localised stress concentrations and arches above individual cavities in the array, leading to localised overburden failure and collapse into those cavities. The
pro-gressive deepening of subrosion is particularly important to account for the observation at the Ghor Al-Haditha site of initiation of larger-scale depression synchronously with or shortly after sinkhole development.
rel-atively strong cavity-hosting layer inhibits deformation be-yond the immediate cavity surroundings and promotes the formation of relatively large sinkholes that coalesce. In mod-els with a relatively weak soluble layer, however, the uvala-like depression develops as a spatially and temporally dis-tinct feature from the sinkholes within it. Rather than forming by sinkhole coalescence, the uvala-like depression reflects a wider-scale subsidence into the cavity array (or subrosion zone) as a whole that results from more widely distributed deformation in the weak cavity-hosting layer (Fig. 5a, b and c). The results of this latter model setup are consis-tent with observations of the spatiotemporal relationships be-tween sinkholes and uvalas in the evaporite karst examples at Ghor Al-Haditha (Fig. 2).
In our model results, we also reproduce the main rela-tive morphometric attributes of sinkholes and uvala-like de-pressions as observed at the Ghor Al-Haditha study area. As shown by Al-Halbouni et al. (2018), sinkhole depth/diameter ratios in the models and nature are dependent on overburden material properties, especially strength. Sinkholes in strong alluvium overburden have De/Di∼0.48 in the models com-pared with De/Di∼0.40 in nature; sinkholes in weak mud overburden have De/Di ∼0.22 in the models compared with De/Di ∼0.10 in nature (Watson et al., 2019). The uvala-like depressions at Ghor Al-Haditha have a De/Di
∼0.016–0.042 (Watson et al., 2019), which, as seen also for limestone karst settings ( ´Cali´c, 2011), is about an order of magnitude less than the sinkholes. A similar relationship is seen in our models in which the larger-scale depressions have De/Di∼0.07–0.14; this ratio could have been made even lower simply by having a wider cavity array.
4.2 Detailed comparison with temporal development of subsidence at the Dead Sea sinkhole area
We analysed data from repeated photogrammetry of 3 con-secutive years of the sinkhole area of Ghor Al-Haditha, at the eastern side of the Dead Sea (Fig. 1a and Al-Halbouni et al., 2017). The datasets have been used to derive DSM differ-ence maps between the consecutive years via GIS software.
Figure 10 shows the spatiotemporal evolution of recent sinkhole formations and patterns of holes, drainage channels, cracks and depression structures as observed in all cover ma-terials in and around the main depression zone of the area (see Figs. 1 and 2). In the relatively strong alluvial sandy-gravel cover material (Fig. 10a), we observe a cluster of rather deep and narrow sinkholes forming between 2014 and 2015. Small conical holes are precursors to the development of larger conical sinkholes (I and II). A typical coalescence and partial overprinting of large and small holes can be seen at the lower right (III). The DSM difference in Fig. 10a de-picts the new sinkholes and lateral sinkhole growth. We ob-serve a small overall subsidence between the new sinkholes but a rather stable surrounding.
In the relatively weak clayey limestone carbonate material (Fig. 10b), we observe the development of a cluster of typical wide and shallow sinkholes formed between 2015 and 2016. Similar to the alluvium, coalescence of individual holes into larger ones as well as the alignment of a series of different sized holes are observed. The development of new collapses during 1 year in this material can either show possible pre-cursory structures (IV) or not (V). The scarps are generally not stable in time (VI) due to the weak material, as seen in the DSM difference map. An overall wider-scale subsidence of approximately 0.5 m±0.2 m is observed in the mud and between the sinkholes in the alluvium.
For qualitative comparison with our models, Fig. 11 shows the profiles across the DSM and vertical surface displace-ment for different stages of our models for weak and strong overburden. Although a precise matching is not intended, we clearly observe similar features in the modelled topographic profiles in comparison to the ones of the sinkholes/depression system at the Dead Sea. In weak material in the field, slight subsidence at the early stage is visible, revealing the con-tours of the future sinkhole (imprints), which were also ob-served in the model. In strong material, early collapse sink-holes may be a precursor for further large-scale collapses and nesting, both in nature and in the models. Sinkhole develop-ment is usually accompanied by fracturing at the margins of the larger-scale depression (see Figs. 2, 5a, c and 11c). Large, deep fractures occur in strong material, while small, shallow fractures in the cohesive weak material (see also Holohan et al., 2011). In general, the fractures indicate a widening of the depression zone. Finally, because of the prescribed geometry of the subrosion zone, which is expected to be more complex in natural karst systems, and the limitation to 2-D modelling, we cannot infer conclusions about the observed migration of such sinkhole clusters in nature (Fig. 2).
4.3 Subsurface patterns of sinkhole clusters and subrosion
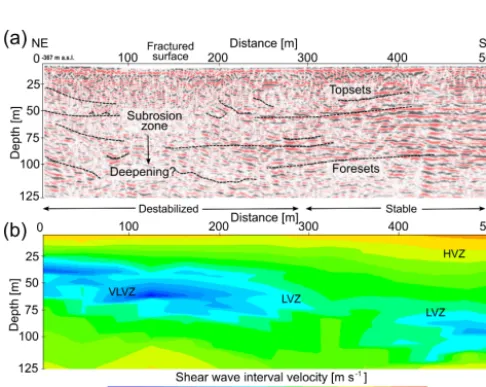
From shear wave reflection seismics, zones with low reflec-tivity and velocity inversion anomalies in the S-wave ve-locity field are indicators for zones of material depletion or faults (Wadas et al., 2016). In the central part of the sinkhole-affected alluvial fan system at Ghor Al-Haditha, a deep-seated (≥60 m depth) main subrosion zone based on the de-termined top of a lacustrine mud layer has been identified by comparison of shear wave reflection profiles with borehole logs (Polom et al., 2018). In several profiles of that work, shallower subrosion zones can also be identified, and a gen-eral dip tendency of the deeper layers towards the NW is ob-served, indicating a Gilbert-type alluvial fan foreset/topset system. We picked a section of profile 1 (see Fig. 1) of Polom et al. (2018) as an example, and we present an interpreted version of the shallower part in Fig. 12a.
Figure 11.Topographic profiles data as indicated in Fig. 10 and corresponding models. Top row: topography and vertical displacement. Figure 10 of(a)cross-section A–A’ from SW to NE in the alluvium and(b)cross-section B–B’ from W to E in the mud flat. Bottom row: representative topographic profiles across final models for(c)high-strength alluvium on mud and(d)low-strength lacustrine mud.
Figure 12.Subrosion-affected parts of shear wave reflection seis-mic profile 1 at the sinkhole site of Ghor Al-Haditha.(a)Modified and interpreted first 500 m of profile 1 after Polom et al. (2018). (b) Shear wave interval velocity versus depth with marked very-low- (VLVZs), very-low- (LVZs) and high-velocity zones (HVZs).
parts, close to the main depression zone, are affected by downsagging of up to several metres, by disturbed layers, and by bowl- or cone-shaped features in the upper 50 m. Near-surface uneven reflectors may indicate local fracturing of the layers. Locally, more stable parts, i.e. stronger reflections, ex-ist. This is comparable to the subsurface structure as found in the final stages of the alluvium-on-mud model (Fig. 5a). The stable blocks are especially clearly visible in the incremental strain evolution plots (see Fig. 17 in Appendix A4). An in-dication of a deepening subrosion zone can be inferred from the change in the transparency of the reflectors.
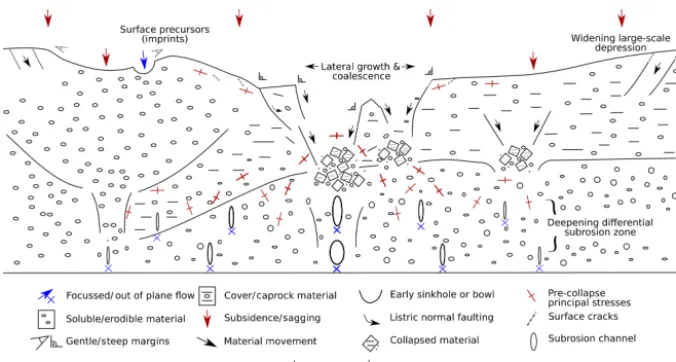
Figure 13.Conceptual model of sinkhole cluster and large-scale depression development. Several sinkholes of different stages, types and varying subrosion depths are indicated in this sketch (centre – caprock sinkholes; left – suffosion sinkhole).
blue to blue zones) indicate either subsurface zones of true low velocities due the specific lithologic formation, i.e. soft sediments, or zones of disturbed formations where the shear modulus is reduced due to mechanical stress of the formation by disruptions, caused by an upward-propagating deforma-tion process. Very low values below 100 m s−1may indicate areas where the shear wave could not propagate the area by a straight ray path and turned around it, e.g. in the case of a cavity (Gdyn=0) or a collapsed zone of very low shear
mod-ulus. In this case, the resulting elongated propagating paths compared to the regular straight paths lead to zones of ap-parently very low interval velocities of less than 100 m s−1, partly close to zero, which are not realistic for true lithologic units.
The decrease in apparent seismic shear wave velocity has been attributed by Polom et al. (2018) to diminished grain coupling (either by pore pressure effects or enhanced frac-turing of the rocks) and to the influence of a high-velocity surface layer (e.g. asphalt). The simulated apparent velocity values of Sect. 3.2 lie in the range of the field estimates with a strong reduction in the simulated mud layer during crack-ing and collapse. We consider the presented simulation stage of Fig. 9 as most appropriate to explain the observed shear wave velocity reduction, which we interpret to be caused by enhanced fracturing, i.e. crack density increase, porosity in-crease and consequent modulus reduction in a deepening dif-ferential subrosion zone. As such, our final model qualita-tively and quantitaqualita-tively aids the interpretation of the sub-surface geophysical patterns for the material combination as found at the Ghor Al-Haditha field site.
A conceptual model in Fig. 13 summarises the main find-ings of this study and how they relate to the complex, dynamic karst systems in nature. A large-scale depression builds up due to distributed material removal in the under-ground by subrosion in a karstic drainage network. Nested
and/or clustered sinkholes may appear with relatively sta-ble blocks in between. Lateral material heterogeneities may cause different sinkhole morphologies and surface expres-sions of cracks/fractures that surround the large-scale pression. Depending on the material strength, large-scale de-pressions may build up either by sagging, block-wise brit-tle failure, lateral widening or coalescence of sinkholes. The subsurface shows strong layering disturbances and porosity and modulus changes leading to a low seismic velocity zone (LVZ). The pre-collapse principal stress system is divided into individual stress arches due to the differential subrosion pattern. Water infiltration generally may cause additional su-perficial dissolution structures.
5 Summary and conclusions
In this study, we presented a physically realistic 2-D dis-tinct element numerical modelling approach to simulate the growth of a system (array) of karstic cavities with the subse-quent formation by subsidence of multiple (clustered) sink-holes within a larger-scale (uvala-like) depression. Two end-member growth scenarios of the multiple cavity array were tested with the following main outcomes:
1. Cavity growth at the same depth level and growth rate yields a stable compression arch around the entire cav-ity array. This scenario hinders individual sinkhole col-lapses but favours a simple block-wise subsidence span-ning the whole cavity array.
sinkhole clusters within a larger-scale, gentler (uvala-like) depression.
The influences of geomechanical variation in growth sce-nario (2) were further investigated by simulating four differ-ent layered combinations of low- and high-strength materials representing the cavity-hosting medium and its overburden. The model results were also compared with surface mor-phologies from remote sensing and with subsurface struc-tures from geophysical studies at the active sinkhole forma-tion area near Ghor Al-Haditha at the Dead Sea. We found that
– For models with a weak cavity-hosting material, cavi-ties remain small throughout, and wide-scale deforma-tion in the cavity-hosting material and the overburden is promoted. This leads to development of a large-scale depression formed by subsidence that is structurally dis-tinct from the individual sinkholes and is geometrically linked to the cavity array as a whole.
– For models with a strong cavity-hosting material, large cavities can develop before the overburden collapses into them and wider-scale deformation is inhibited. Consequently, a larger-scale depression forms in this case mainly by coalescence of sinkholes.
– Deepening of the differentially growing cavity array in model scenario (2) leads to sinkholes forming syn-chronously with, or just before, the development of a larger-scale synclinal depression. This order of appear-ance of sinkholes relative to the larger-scale depression is observed at the Ghor Al-Haditha sinkhole area. The modelling condition of deepening cavity growth is rep-resentative of a base-level fall, the main hydrogeologi-cal boundary condition occurring at the Dead Sea shore-line.
– Morphometric relations (depths and diameters) for both sinkholes and large-scale depressions as observed in na-ture are successfully reproduced in the models.
– Subsurface structures and calculated shear wave veloc-ities match to a high degree those inferred from field estimations in shear wave seismic data. A low seismic velocity zone (100–275 m s−1) is imaged and simulated, compatible with the existence of a deepening subrosion zone at the Ghor Al-Haditha field site.
Finally, we conclude that the presented numerical modelling approach of multiple cavity growth has proven to be success-fully applicable to sinkhole–depression systems and that it provides a basis for enhanced geomechanical understanding of karst development and hazard assessment.
Data availability. A full set of metadata is available upon request.
Appendix A: Numerical simulation of multiple void spaces with DEM
A1 Cavity growth implementation
The cavity growth function, f (i), which relates the initial removed area A0 to the area increment to be removed Ai (Al-Halbouni et al., 2018), has been updated to account for multiple voids that can start and stop growing at defined in-tervals (i0,imax). The function hence depends on each single
void of indexj and the formula becomes
Ai =fj(i, ) A0, i∈ [i0, imax]. (A1)
The linear void space growth function relating initial void space area with the removed area at further intervals stands as an approximation for real fracture or void growth by physio-chemical processes in karst aquifers. Pure physio-chemical dissolu-tion of limestone or gypsum versus fracture widening shows a linear behaviour as long as the concentration of the under-saturated incoming fluid is lower than 90 % of the equilib-rium concentration for that mineral (Dreybrodt et al., 2005; Kaufmann and Dreybrodt, 2007; Romanov et al., 2010). A2 Optimal model development
For finding the optimal model, we generally define five indi-vidual semi-elliptical voids with a distance of 25–40 m from each other. They belong to one of three initial size groups and one of three void space growth function classes. Initial areas of set 1 (small) areA0,1=2.7–6 m3 and linear eccentricity e1=1.7–2.2 of set 2 (mid-sized)A0,2=10–14 m3ande2=
3.5–4.0 and of set 3 (big) A0,3=24.5 m3 ande3=5–5.5.
Material removal of set A (slow) has an incremental func-tion of fj=1(i)=1.0i, set B (mid-speed) fj=2(i)=1.
05-1.075i and set C (fast)fj=3(i)=1.1i. The subrosion zone
is defined in different depth below the surface: set I (shal-low) is for 20 m depth, set II (middle) for 30 m depth, set III (mid-depth) for 40 m depth, set IV (deep) for 50 m depth and set V (very deep) for 60 m depth. Representative of different material combinations, all results of the tests are shown in Fig. 14 for the alluvium-on-mud layer setup. The following table summarises the different tested void space setups. The results for the final model are shown in Sect. 3.
Constant void space growth (test scenario 1).Figure 14a
shows the evolution of a growing void space system of five voids of set A until surface collapse for multiple layers of alluvium and mud. It shows cracks at the margins of the col-lapse zone and gradual sinking of a whole block. Individual smaller-scale sinkholes do not form. See the main text of the paper for the description of the results for this test scenario.
Constant void space growth with shallower inner voids.
Figure 14b shows the evolution of a growing void space sys-tem of five voids of set A with two inner voids 10 m higher than the others. It shows cracks at the margins of the collapse zone and gradual sinking of the whole block but with a
divi-sion of the block into segments. Real individual smaller-scale sinkholes do not form but are only an effect of the segmenta-tion by the higher-lying voids.
Constant void space growth with shallower outer voids.
Figure 14c shows the evolution of a growing void space sys-tem of five voids of set A with the two outer voids 10 m higher than the others. It shows cracks at the margins of the collapse zone and gradual sinking of the whole block and toppled blocks at the margins. Real individual smaller-scale sinkholes do not form – only a large and rather flat depres-sion.
Accelerating growth of outer voids.Figure 14d shows the
evolution of a growing void space system of three inner voids of set A with the two outer voids of set B, which leads effec-tively to an accelerated growth of the outer voids. We observe cracks and toppled blocks at the margins of the collapse zone, a gradual sinking of the whole block and first individual but very large sinkholes. The deepest part of the depression is one of the sinkholes. The convex-shaped bending of the mid-dle part is not observed in our field study.
Differential growth with same initial areas. Figure 14e
shows the evolution of a growing void space system of the two outer voids of set A, the two inner voids of set B and the central void of set C, effectively an accelerating growth for the inner voids. We find cracks and toppled blocks at the margins of the collapse zone, a gradual sinking of the whole block. A large-scale, more steep-sided depression forms.
Constant growth with variable initial areas.In Fig. 14f,
the same effect as in the previous model can be produced by larger initial areas of the inner void spaces, with the largest material removal zone in the centre. The growth rate is con-stant for each individual void space leading but the initial sizes differ. Here, we produce a compression ridge at the cen-tre of the depression zone.
Differential void space growth with variable initial areas.
In Fig. 14g, a combination of a larger starting area with the fastest growing rate in the centre as in Fig. 14e and f is used to achieve an accelerating differential void space growth. We can see the same effect as in the previous models but with a first formation of a small-scale sinkhole in the centre of the depression.
Deepening differential void space growth (test scenario 2).
Table A1. Tested sets of void spaces for the DEM models. All of them were applied to the material settings common at the Dead Sea shoreline. The model set combination is given in the terminology: initial area set/void space growth class/subrosion depth set. So, e.g. 1/A/I would stand for small-sized, shallow-seated void spaces growing at a constant rate.
Removal A: all B: three C: two D: two E: all F: all G: all voids H: deepening I: final model:
zone voids inner outer outer voids voids voids differential deepening
(void the same voids voids voids differential same growth rate growth rate differential
space)/ (A0,2) shallower shallower accelerating but same but variable and variable and variable growth rate
model (A0,2) (A0,2) growth initial areas initial areas initial areas initial areas and variable
set name (A0,2) (A0,2) (A0,2, A0,3) (A0,1, A0,2, A0,3) (A0,1, A0,2, A0,3) initial areas (A0,1, A0,2, A0,3)
Central 2/A/III 2/A/II 2/A/III 2/A/III 2/C/III 3/A/III 3/C/III 1: 3/C/I 1: 3/C/I
Central 2: 3/C/III 2: 3/C/II
3: 3/C/V 3: 3/C/III 4: 3/C/IV
Two 2/A/III 2/A/II 2/A/III 2/A/III 2/B/III 2/A/III 2/B/III 1: 2/B/I 1: 2/B/I
Inner 2: 2/B/III 2: 2/B/II
3: 2/B/V 3: 2/B/III 4: 2/B/IV
Two 2/A/III 2/A/III 2/A/II 2/B/III 2/A/III 1/A/III 1/A/III 1: 1/A/I 1: 1/A/I
Outer 2: 1/A/III 2: 1/A/II
3: 1/A/V 3: 1/A/III 4: 1/A/IV
A3 Principal stresses in a multiple void space system Figures 15 and 16 show the developed maximum σ1 and
minimum andσ3compressive stress for the constant
subro-sion versus differential subrosubro-sion setups (scenarios 1 and 2) and two different material combinations. A large compres-sion arch spanning the cavity array develops in scenario (1) but is more fragmented in scenario (2). For the weak overbur-den, rather individual stabilising compressive arches build up in the strong interlayer and hardly translate upward. The min-imum compressive stress plots for both setups show similar behaviour. Tensile stresses are recorded near the surface for strong overburden material. In contrast, the strong interlayer beneath the weak material leads to strong tensile stresses lined up at the edges of the cavities with spalling phenomena for both subrosion schemes. This line is centrally broken in the differential subrosion scheme. Shear stress observations are discussed in Sect. 3.1.
A4 Incremental shear strain evolution
Figure 17 shows the incremental shear strain evolution for all simulated material combinations for the differential deep-ening subrosion scenario (2). The different mechanical re-sponse to material removal in the subsurface is nicely illus-trated by these images. Strong strain localisation occurs in all models in the material removal zones, at the boundaries of the depressions and at the margins of formed fractures. The continuous evolution of cracks into long fractures is nicely imaged as well.
A5 Maximum shear stress evolution
Figure A2.Maximum principal stress around void spaces for(a)constant and(b)differential cavity growth scenarios models. Chosen are two material combinations where the subrosion-affected layer differs in strength: alluvium-on-mud multilayer and mud-on-salt/alluvium succession. Shown are critical stages after void space installation followed by or exactly during overburden collapse for the same particle assembly. The removed volume [m3] is shown above the plots.
Supplement. The supplement related to this article is available online at: https://doi.org/10.5194/se-10-1219-2019-supplement.
Author contributions. DAH and EPH led the production of figures
and writing of the manuscript. DAH undertook the majority of the data analysis associated with the DSMs and modelling. EPH, DAH, RAW and UP undertook the field studies and close-range pho-togrammetric surveys in 2014–2016. UP and RAW contributed with satellite image and seismic data analysis. All authors reviewed and commented on the manuscript, and they contributed to discussions of the data.
Competing interests. The authors declare that they have no conflict
of interest.
Acknowledgements. We would like to acknowledge our colleagues
from MEMR, namely Ali Sawarieh and Hussam Alrshdan, for their continuous support. Particular thanks go to Damien Closson, Thomas R. Walter, Marc K. Elmouttie and Charlotte M. Krawczyk. We would additionally like to thank the reviewers and the editor for the fruitful discussion. Finally, particular thanks go to Itasca for providing the license of PFC-V5 in the framework of the IEP and the German Academic Exchange Service (DAAD) for a short-term doctorate research grant.
Financial support. This research has been supported by the
Federal Ministry of Education and Research of Germany (grant no. 03G0843) and the Helmholtz DESERVE Virtual Institute (grant no. VH-VI-527).
The article processing charges for this open-access publication were covered by a Research
Centre of the Helmholtz Association.
Review statement. This paper was edited by Federico Rossetti and
reviewed by Renaud Toussaint and Nestor Cardozo.
References
Abelson, M., Yechieli, Y., Baer, G., Lapid, G., Behar, N., Calvo, R., and Rosensaft, M.: Natural versus human control on subsur-face salt dissolution and development of thousands of sinkholes along the Dead Sea coast, J. Geophys. Res.-Earth, 122, 1262– 1277, https://doi.org/10.1002/2017JF004219, 2017.
Al-Halbouni, D., Holohan, E. P., Saberi, L., Alrshdan, H., Sawarieh, A., Closson, D., Walter, T. R., and Dahm, T.: Sinkholes, subsidence and subrosion on the east-ern shore of the Dead Sea as revealed by a close-range photogrammetric survey, Geomorphology, 285, 305–324, https://doi.org/10.1016/j.geomorph.2017.02.006, 2017. Al-Halbouni, D., Holohan, E. P., Taheri, A., Schöpfer, M. P. J.,
Emam, S., and Dahm, T.: Geomechanical modelling of sinkhole
development using distinct elements: model verification for a sin-gle void space and application to the Dead Sea area, Solid Earth, 9, 1341–1373, https://doi.org/10.5194/se-9-1341-2018, 2018. Atzori, S., Antonioli, A., Salvi, S., and Baer, G.:
InSAR-based modeling and analysis of sinkholes along the Dead Sea coastline, Geophys. Res. Lett., 42, 8383–8390, https://doi.org/10.1002/2015GL066053, 2015.
Bartov, Y.: Lake Levels and Sequence Stratigraphy of Lake Lisan, the Late Pleistocene Precursor of the Dead Sea, Quaternary Res., 57, 9–21, https://doi.org/10.1006/qres.2001.2284, 2002. Baryakh, A. A., Rusin, E. P., Stazhevsky, S. B., Fedoseev, A. K.,
and Khan, G. N.: Stress-strain state of Karst areas, J. Min. Sci., 45, 3–10, 2009.
BGR, IAH, KIT and UNESCO: World Karst Aquifer Map, 1:40000000, Berlin, Reading, Karlsruhe, Paris, 2017.
´
Cali´c, J.: Karstic uvala revisited: Toward a redefi-nition of the term, Geomorphology, 134, 32–42, https://doi.org/10.1016/j.geomorph.2011.06.029, 2011. Chen, Z., Auler, A. S., Bakalowicz, M., Drew, D., Griger, F.,
Hart-mann, J., Jiang, G., Moosdorf, N., Richts, A., Stevanovic, Z., Veni, G., and Goldscheider, N.: The World Karst Aquifer Map-ping project: concept, mapMap-ping procedure and map of Europe, Hydrogeol. J., 25, 771–785, https://doi.org/10.1007/s10040-016-1519-3, 2017.
Cundall, P. A.: A computer model for simulating progressive large scale movements in blocky rock systems, Proc. Symp. Rock Fract, (ISRM), Nancy, 1, 1971.
Cundall, P. A. and Strack, O. D. L.: A discrete numerical model for granular assemblies, Géotechnique, 29, 47–65, 1979.
Dahm, T. and Becker, T.: On the elastic and viscous properties of media containing strongly interacting in-plane cracks, Pure Appl. Geophys., 151, 1–16, https://doi.org/10.1007/s000240050102, 1998.
De Waele, J., Gutiérrez, F., Parise, M., and Plan, L.: ogy and natural hazards in karst areas: A review, Geomorphol-ogy, 134, 1–8, https://doi.org/10.1016/j.geomorph.2011.08.001, 2011.
Dix, C. H.: Seismic velocities from surface measurements, Geo-physics, 20, 68–86, 1955.
Dreybrodt, W., Gabrovšek, F., and Romanov, D.: Processes of a Speleogenessis: A Modeling Approach, Založba ZRC, 2005. Fazio, N. L., Perrotti, M., Lollino, P., Parise, M.,
Vat-tano, M., Madonia, G., and Di Maggio, C.: A three-dimensional back-analysis of the collapse of an under-ground cavity in soft rocks, Eng. Geol., 228, 301–311, https://doi.org/10.1016/j.enggeo.2017.08.014, 2017.
Filin, S., Baruch, A., Avni, Y., and Marco, S.: Sinkhole characteriza-tion in the Dead Sea area using airborne laser scanning, Nat. Haz-ards, 58, 1135–1154, https://doi.org/10.1007/s11069-011-9718-7, 2011.
Gutiérrez, F., Parise, M., De Waele, J., and Jourde, H.: A review on natural and human-induced geohazards and impacts in karst, Earth-Sci. Rev., 138, 61–88, https://doi.org/10.1016/j.earscirev.2014.08.002, 2014.
Hatzor, Y. H., Wainshtein, I., and Bakun Mazor, D.: Stability of shallow karstic caverns in blocky rock masses, Int. J. Rock Mech. Min. Sci., 47, 1289–1303, https://doi.org/10.1016/j.ijrmms.2010.09.014, 2010.
Hazzard, J. F.: Acoustic Emission Calculation in PFC5.0, Min-neapolis, Minnesota, USA, 2014.
Hazzard, J. F. and Young, R. P.: Dynamic modelling of in-duced seismicity, Int. J. Rock Mech. Min. Sci., 41, 1365–1376, https://doi.org/10.1016/j.ijrmms.2004.09.005, 2004.
Holohan, E. P., Schöpfer, M. P. J., and Walsh, J. J.: Mechani-cal and geometric controls on the structural evolution of pit crater and caldera subsidence, J. Geophys. Res., 116, B07202, https://doi.org/10.1029/2010JB008032, 2011.
Holohan, E. P., Schöpfer, M. P. J., and Walsh, J. J.: Stress evolution during caldera collapse, Earth Planet. Sc. Lett., 421, 139–151, https://doi.org/10.1016/j.epsl.2015.03.003, 2015.
Itasca: PFC 5.0 Manual, Itasca International, Inc., Technical Docu-mentation, 2014.
Jing, L. and Stephansson, O.: Fundamentals of Discrete Element Methods for Rock Engineering, Elsevier, 2007.
Kaufmann, G. and Dreybrodt, W.: Calcite dissolution ki-netics in the system CaCO3-H2O-CO2 at high under-saturation, Geochim. Cosmochim. Ac., 71, 1398–1410, https://doi.org/10.1016/j.gca.2006.10.024, 2007.
Parise, M. and Lollino, P.: A preliminary analysis of fail-ure mechanisms in karst and man-made underground caves in Southern Italy, Geomorphology, 134, 132–143, https://doi.org/10.1016/j.geomorph.2011.06.008, 2011. Polom, U., Alrshdan, H., Al-Halbouni, D., Holohan, E. P., Dahm,
T., Sawarieh, A., Atallah, M. Y., and Krawczyk, C. M.: Shear wave reflection seismic yields subsurface dissolution and subrosion patterns: application to the Ghor Al-Haditha sinkhole site, Dead Sea, Jordan, Solid Earth, 9, 1079–1098, https://doi.org/10.5194/se-9-1079-2018, 2018.
Potyondy, D. O.: The bonded-particle model as a tool for rock me-chanics research and application: current trends and future direc-tions, Geosystem Eng., 17, 342–369, 2014.
Potyondy, D. O. and Cundall, P. A.: A bonded-particle model for rock, Int. J. Rock Mech. Min. Sci., 41, 1329–1364, https://doi.org/10.1016/j.ijrmms.2004.09.011, 2004.
Romanov, D., Kaufmann, G., and Hiller, T.: Karstification of aquifers interspersed with non-soluble rocks: From basic principles towards case studies, Eng. Geol., 116, 261–273, https://doi.org/10.1016/j.enggeo.2010.09.008, 2010.
Schöpfer, M. P. J., Childs, C., and Walsh, J. J.: Localisation of nor-mal faults in multilayer sequences, J. Struct. Geol., 28, 816–833, https://doi.org/10.1016/j.jsg.2006.02.003, 2006.
Schöpfer, M. P. J., Childs, C., and Walsh, J. J.: Two-dimensional distinct element modeling of the structure and growth of normal faults in multilayer sequences: 1. Model calibration, boundary conditions, and selected results, J. Geophys. Res., 112, B10401, https://doi.org/10.1029/2006JB004902, 2007.
Schöpfer, M. P. J., Abe, S., Childs, C., and Walsh, J. J.: The im-pact of porosity and crack density on the elasticity, strength and friction of cohesive granular materials: Insights from DEM modelling, Int. J. Rock Mech. Min. Sci., 46, 250–261, https://doi.org/10.1016/j.ijrmms.2008.03.009, 2009.
Soldal, M. and Mondol, N. H.: Dynamic to static relationships of shear modulus for sand and sandstones, in: Thrid international Workshop on Rock Physics, Perth, Australia, 2015.
Tharp, T. M.: Mechanics of upward propagation of cover-collapse sinkholes, Eng. Geol., 52, 23–33, https://doi.org/10.1016/S0013-7952(98)00051-9, 1999.
Wadas, S. H., Polom, U., and Krawczyk, C. M.: High-resolution shear-wave seismic reflection as a tool to image near-surface subrosion structures – a case study in Bad Frankenhausen, Ger-many, Solid Earth, 7, 1491–1508, https://doi.org/10.5194/se-7-1491-2016, 2016.
Waltham, T.: Control the drainage: the gospel accorded to sinkholes, Q. J. Eng. Geol. Hydroge., 49, 5–20, https://doi.org/10.1144/qjegh2015-088, 2016.
Waltham, T., Bell, F., and Culshaw, M. G.: Sinkholes and subsi-dence: Karst and Cavernous Rocks in Engineering and Construc-tion, Springer, Berlin, Heidelberg, 2005.
Wang, C., Deng, A., and Taheri, A.: Three-dimensional discrete element modeling of direct shear test for gran-ular rubber-sand, Comput. Geotech., 97, 204–216, https://doi.org/10.1016/j.compgeo.2018.01.014, 2018.
Watson, R. A., Holohan, E. P., Al-Halbouni, D., Saberi, L., Sawarieh, A., Closson, D., Alrshdan, H., Abou Karaki, N., Siebert, C., Walter, T. R., and Dahm, T.: Sinkholes and uvalas in evaporite karst: spatio-temporal development with links to base-level fall on the eastern shore of the Dead Sea, Solid Earth Dis-cuss., https://doi.org/10.5194/se-2018-105, in review, 2019. Weisbrod, N., Alon-Mordish, C., Konen, E. and Yechieli,
Y.: Dynamic dissolution of halite rock during flow of, diluted saline solutions, Geophys. Res. Lett., 39, 1–7, https://doi.org/10.1029/2012GL051306, 2012.
Wichtmann, T. and Triantafyllidis, T.: On the correlation of “static” and “dynamic” stiffness moduli of non-cohesive soils, Bautech-nik, 86, 28–39, https://doi.org/10.1002/bate.200910039, 2009. Yechieli, Y., Abelson, M., and Baer, G.: Sinkhole formation and