www.nonlin-processes-geophys.net/18/367/2011/ doi:10.5194/npg-18-367-2011
© Author(s) 2011. CC Attribution 3.0 License.
Nonlinear Processes
in Geophysics
A nonlinear method of removing harmonic noise in geophysical data
Y. Jeng and C.-S. Chen
Department of Earth Sciences, National Taiwan Normal University, 88, Sec. 4, Ting-Chou Road, Taipei, 116, Taiwan Received: 3 March 2011 – Revised: 22 April 2011 – Accepted: 2 June 2011 – Published: 21 June 2011
Abstract. A nonlinear, adaptive method to remove the har-monic noise that commonly resides in geophysical data is proposed in this study. This filtering method is based on the ensemble empirical mode decomposition algorithm in con-junction with the logarithmic transform. We present a syn-thetic model study to investigate the capability of signal construction from the decomposed data, and compare the re-sults with those derived from other 2-D adaptive filters. Ap-plications to the real seismic data acquired by using an ocean bottom seismograph and to a shot gather of the ground pene-trating radar demonstrate the robustness of this method. Our work proposes a concept that instead of Fourier-based ap-proaches, the harmonic noise removal in geophysical data can be achieved effectively by using an alternative nonlinear adaptive data analysis method, which has been applied ex-tensively in other scientific studies.
1 Introduction
The interference of harmonic noise in geophysical data has long been a nuisance problem for geophysicists. The noise commonly originates from power-line harmonic radiation, global lightning, EM transmitters, oscillating sources, and inadequate data processing (Butler and Russell, 1993; Jeng et al., 2007; Bagaini, 2010). It may contaminate the data di-rectly during time-domain measurements of EM fields, or in-directly, by EM coupling to instrument cables during the data acquisition and perhaps by artifacts produced during the data processing (Butler and Russell, 2003; Huang and Wu, 2008). Various methods have been proposed to suppress harmonic noise in geophysical records. Conventional Fourier based linear filtering techniques are not desirable mainly due to the
Correspondence to: Y. Jeng (geofv001@ntnu.edu.tw)
results of signal distortions and artifacts generated. Subtract-ing an estimate of the harmonic noise from the recorded data is the current main approach (Nyman and Gaiser, 1983; But-ler and Russell, 1993; Jeffryes, 2002; Meunier and Bianchi, 2002; Butler and Russell, 2003; Saucier et al., 2006). The estimate includes the estimating of harmonic noise funda-mental frequency, and amplitudes and phases of all harmon-ics. However, most of the spectrum estimation related meth-ods pointed out above are critically relied on the accuracy of the estimated fundamental frequency; normally the allowed error is less than 0.02 %. Furthermore, these methods are derived under the assumption that each sinusoidal contam-inant is stationary, i.e., constant in amplitude, phase, and frequency over the length of the record (Butler and Russell, 2003). This assumption is impractical because the attributes of harmonic noise always drift with time for many reasons. Other effective methods are by using inversion techniques or by implementing filters with pattern-based scheme (Gui-tton and Symes, 2003; Gui(Gui-tton, 2005; Haines et al., 2007). The inversion technique-based methods require a sufficient number of traces, and are applicable if data quality is good. Filters employing pattern models are effective but they are time-consuming, and adequate pattern models are necessary for filter estimation (Haines et al., 2007).
This section briefly describes the technique applied to re-move the harmonic noise that affects geophysical records. More details can be found in the contributions of Huang et al. (1998) and Wu and Huang (2005, 2009). The adaptive data analysis technique that we adopted includes the em-pirical mode decomposition (EMD) algorithm with its re-vision EEMD method. In this study, we generally call this new and evolving technique “the EEMD method” which in-cludes the original EMD algorithm and the Hilbert-Huang Transform (HHT). The application of this analysis has been widely demonstrated in the recent peer-reviewed literature both in science and engineering communities, and it has been verified very effective in spectrum analysis and noise filter-ing (Gloerson and Huang, 2003; Flandrin et al., 2004; Peel and McMahon, 2006; Battista et al., 2007; Jeng et al., 2007; Huang and Wu, 2008; Feldman, 2009; Tsolis and Xenos, 2009; Jackson and Mound, 2010; Lee and Ouarda, 2010; Lin and Jeng, 2010). Some contributions of the EMD technique have been made on the seismic data processing; however, due to the high attenuation nature of the reflection data, it still has room for more elaborate studies. In this paper, we propose a modified scheme which is useful in applying the EEMD method to remove the harmonic noise in reflection data.
Our hypothesis of utilizing this technique in removing the harmonic noise is that a set of recorded data can be consid-ered a gather of many simple oscillatory modes of differ-ent frequencies, and we can localize an evdiffer-ent in both time and frequency domains by the proposed decomposition pro-cedure. Huang et al. (1998) defined the simple oscillatory mode as the intrinsic mode function (IMF) which is a func-tion satisfying two condifunc-tions: (1) the number of extrema and the number of zero-crossings must either equal or differ at most by one; and (2) at any point, the mean value of the envelope determined by the local maxima (upper envelope) and the envelope determined by the local minima (lower en-velope) is zero. As a result, each decomposed component, the IMF, has instantaneous frequency with physical meaning, and the harmonic noise should be separated from the signal in accordance. Our previous work has investigated various cases using the EMD method, suggesting that the separation of different intrinsic oscillatory modes of the reflection data is feasible.
Fig. 1. Process of sifting. (a) The original single trace datag(t ) extracted from a typical GPR record acquired in the field. (b) Orig-inal datag(t )with upper and lower envelopes and the meanm1of the two envelopes. (c) The first mode,d1, which is the difference between the original data andm1. This is not an IMF yet.
The EMD algorithm is briefly summarized as follows by using a typical GPR single trace,g(t ), acquired in the field. To begin with, we establish the upper and lower envelopes for this given data setg(t )(Fig. 1a, b) and compute the mean of the two envelopesm1(Fig. 1b). It follows that the difference between the input datag(t )andm1is the prototype of the first mode (Fig. 1c),d1, in prototype:
d1=g(t )−m1 (1)
SDj= T P
t=0
dj−1(t )−dj(t ) 2 T P t=0 dj2−1(t )
(2)
should be smaller than a predetermined value (values be-tween 0.2 and 0.3 are suggested). Another simpler but maybe better criterion is that the sifting process stops only the output consistently (stay the same for between 3 and 8 consecutive times of sifting) fulfills the definition of IMF (Huang et al., 1998; Huang and Wu, 2008). Ifd1j(d1mode function afterj times sifting) satisfies the stoppage criterion, then we define it asc1, which is the first IMF of the given data setg(t )with the highest frequency. The componentc1can be subtracted from the original datag(t )to obtain a residuer1which still contains lower frequency components. The residuer1is then treated as the new data ready for the next sifting process. The original data are therefore iteratively decomposed inton IMFs (c1tocn) of different frequency band and a residuern
is obtained after repeating the sifting procedurentimes as
g(t )=
n X
i=1
ci+rn (3)
A more robust sifting algorithm, EEMD, was proposed by Wu and Huang (2005, 2009) as a revision of the EMD. This new version adopts the noise-assisted data analysis approach (NADA) and noise-assisted signal extraction (NASE) tech-nique into EMD algorithm to eliminate the mode mixing problem of EMD which occurs as a consequence of signal intermittency. The EEMD method can be illustrated by sim-ple mathematical expressions as follows. Before sifting pro-cess, we add finite amplitude white noisew(t )to the input datag(t )to get the noise added dataG(t )as
G(t )=g(t )+w(t )×R, (4) whereR is the ratio of the standard deviation of the added noise amplitude to that of the original datag(t ). The EMD is then applied toG(t )to generate the noise added IMFs. By repeatingktimes of the noise adding procedure with different white noise series but of the same amplitude each time, an ensemble of the correspondingith IMF component,Ei, will
be:
Ei(t )= k X
j=1
cij(t ), (5)
wherecij is thejth noise added trial of theith IMF
compo-nent ofG(t ). The mean of the IMFs in ensembleEi is equal
to
¯
ci=
1 k
k X
j=1
cij. (6)
As the number of the ensemble memberkapproaches in-finity, the process of taking the mean will cancel out the white noise added on each time of trial due to the randomness of the noise, and the mean,c¯i, will approach to the truth of theith
IMF component. Thus, the mode mixing problem of EMD would be greatly alleviated because the added white noises of different scales would make uniformly distributed refer-ence scales available in the whole time-frequency space for the signal to populate, but would cause no interference in the signal.
The actual value of the added noise amplitudeR and the number of the ensemble memberkare case dependent. Wu and Huang (2005, 2009) suggested that 0.2 and a value of few hundreds for the two parameters would lead to a good result in most cases. Lin and Jeng (2010) allowed 0.5 and 100 forRandk, respectively, to process their relatively small quantity of data dominated by low frequency signals. In our case, the data quantities are large and most of the data contain high frequency signals; therefore, we use 0.1 for the added noise amplitudeR, and use 50 for the number ofkin EEMD algorithm to compromise with the computer time.
It is important to note that in the procedure of decompo-sition, the attenuation of reflection data also is a factor of causing the mode mixing problem. The weak later part of a given attenuated signal becomes significant after the prior IMF is subtracted from the original data. Therefore, the at-tenuated signal may allocate in pieces in more than one IMF. In order to provide a certain solution for signal/noise separa-tion techniques based on the EMD method, we performed the logarithmic transform technique in this study to balance the display of data values and to increase the sensitivity of the de-composition. The advantage of doing this is that the logarith-mic transform allows displaying data of large dynalogarith-mic range without introducing any artificial distortion. Conventionally, some approaches are used to deal with the data attenuation. Among them, the AGC (auto gain control) correction and the energy compensation by using a gain function are two com-mon techniques. The AGC correction is easy to apply, but the original attributes of the data will be distorted after the amplitude adjustment, and further signal analysis could be irrelevant. As for the gain correction, the true inverseQ (at-tenuating factor) filter for the data cannot be obtained without the help of a precise laboratory measurement or other joint estimates (Irving and Knight, 2003).
Fig. 2. Simulation of the reflection model. (a) Shot gather model without harmonic noise. (b) Model with harmonic noise and ground roll
added. (c) Logarithmic transform performed on the model shown in (b).
Fig. 4. Filter bank of the harmonic noise affected model data with logarithmic transform.
results using different combinations of components should be done for making an optimal decision. More details of se-lecting process are illustrated in the synthetic model analysis followed.
The images we treated in this study are collections of single one-dimensional traces. Since the data attributes are dimensional, we decompose each trace using one-dimensional EEMD method and collect the components of each trace of the same level to construct the two-dimensional image components of each level. From the point of view of image processing, a two-dimensional EMD algorithm should be a good alternative for image decomposition. However, it is not considered in this study due to the reasons of much longer processing time and marginal improved images may not be worth considerable additional endeavors. Another rea-son is that artifacts may be created by using two-dimensional algorithm to process data of one-dimensional attributes.
3 Synthetic model analysis
IMF-Fig. 5. Comparison of filtering results of the proposed method and other 2-D adaptive techniques to the model contaminated with harmonic
noise and ground roll. The amplitudes are shown on the logarithmic scale for comparison. (a) EEMD filtering without the aid of logarithmic transform. Components IMF-2 to IMF-9 were subtracted from the dyadic filter bank to suppress the noise. (b) Logarithmic transform performed before EEMD filtering. Components IMF-3 to IMF-9 were subtracted from the dyadic filter bank in this case. (c) Result of applying the optimum 2-D median filter. (d) Result of applying the 2-D adaptive Wiener filter. (e) Error ratios of the EEMD filter, logarithmic EEMD filter, optimum 2-D median filter (2DMF), and 2-D adaptive Wiener filter (2DWF).
9 is the residue representing the trend or the background energy of the data analyzed. Because the signal and the noise patterns of reflection data are easy to distinguish, the attributes of IMF-1 to IMF-8 in the dyadic filter bank are summarized as follows: IM-1 shows highest S/N ratio; most
out by Wu and Huang (2005, 2009), the EEMD components of data are not necessarily IMFs, for EEMD involves numer-ous summations of IMFs. We found that this drawback is more serious when highly attenuated data are analyzed. This is probably due to the dramatic dynamic range change in the sifting process for highly attenuated data, and the coverage of envelopes varies significantly in each mode during the pro-cess. Therefore, for EEMD components containing both sig-nal and noise may be treated as raw data and decomposed further to extract more signal out.
However, decomposing the IMFs may increase the decom-position level, increasing simultaneously the possibility of having IMFs which lack physical meaning. In such case, the resulting IMF may approach a stationary mono-frequency component as derived from the Fourier decomposition. The logarithmic transform we used in this study already relaxes the dynamic range problem and improves the sensitivity of the EMD method. Therefore, as for the purpose of recogniz-ing reflection events, more refined models may not indicate better solutions.
The dyadic filter bank of the model with logarithmic trans-form is demonstrated in Fig. 4. We can see that the sifting process of the EEMD technique worked more precisely in this case. IMF-1 and IMF-2 are dominated by reflection and refraction signal components; IMF-3 to IMF-8 contain both signal and noise of various frequency ranges. Because the logarithmic transform suppressed much of the harmonic en-ergy in this case, it is almost invisible in all the decomposed components.
To proceed with the filtering process, we subtracted the components dominated by harmonic noise and ground roll from the dyadic filter bank, and reconstructed the model us-ing the signal components left. As expected, the logarithmic transform reduced the mode mixing problem, resulting in a better resolution in signal and noise recognition. Figure 5 shows a comparison of the results of EEMD filtering without and with the application of logarithmic transform, and com-pares them with the results of applying two other adaptive filtering techniques proposed by Jeng et al., 2009. To make the comparison more convincing, the amplitudes of all the figures are presented on the logarithmic scale. Comparing Fig. 5a with Fig. 5b, we found that with the logarithmic trans-form, less IMFs were subtracted from the data but a better result was achieved. In addition, the suppression of ground roll is an extra credit of using our method; however, the in-vestigator is free to decide which noise to eliminate because most of the harmonic noise and ground roll reside in differ-ent compondiffer-ents. Figure 5c, d indicate the filtering results of the optimum 2-D median filter with 3×15 window and the 2-D adaptive Wiener filter with 3×17 window, respectively. A quantitative comparison was made by calculating the error ratios of different filtering processes. The error ratio Err is defined as
Err=1−Corr (7)
where Corr indicates the correlation coefficient between the original model without noise added and the filtered result. In our case, we treated the model data M as an m×n matrix, and F represents the filtered data of the same dimension, then
Corr=
P m
P n
(Mmn− ¯M)(Fmn− ¯F)
r (P
m P
n
(Mmn− ¯M)2)(P m
P
n
(Fmn− ¯F)2)
(8)
whereM and¯ F are the means of matrixes M and F, respec-¯ tively.
Comparing the filtered results and the original model with-out noise, the proposed EEMD method with logarithmic transform gives the lowest error ratio (Fig. 5e).
4 Field data examples
Fig. 6. OBS field data. (a) Original OBS data showing refraction and reflection events and harmonic noise. (b) Logarithmic transform of
original OBS data.
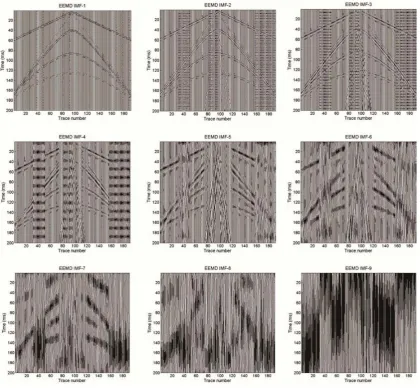
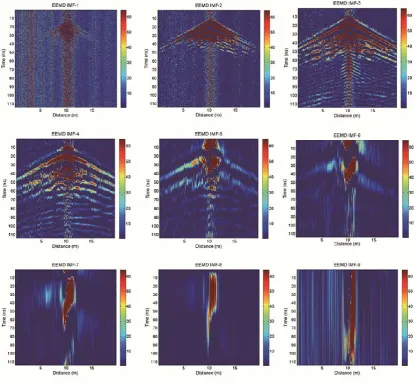
Fig. 8. Filter bank of the OBS data with logarithmic transform.
Fig. 9. OBS field data after harmonic noise removal. (a) Result of applying the harmonic noise removing method without the aid of
Fig. 10. GPR shot gather data. (a) Original GPR data showing refraction and reflection events and harmonic noise. (b) Logarithmic transform
of original GPR data.
Fig. 12. Filter bank of the GPR shot gather data with logarithmic transform.
Fig. 13. GPR shot gather data after harmonic noise removal. (a) Result of applying the harmonic noise removing method without the aid of
we employed in this study are equipped with fiber optic ca-bles to minimize the interference of the EM noise, harmonic noise affected traces are still visible in the data – chiefly at the first half of the survey line which is near a building (Fig. 10a). Because the minimum allowable separation dis-tance for 200 MHz antennas is 0.5 m and our spatial sample interval is 5 cm, the traces near the location of the transmit-ting antenna (the central region of the shot gather) display unusual high amplitude. This is due to the signal saturation when two antennas are in close proximity to each other. After logarithmic transform, the resolution of the data is improved in general (Fig. 10b). We then decomposed both sets of data using the EEMD technique to establish dyadic filter banks (Figs. 11 and 12). By applying the same selecting principles noted previously, we eliminated components of low S/N ratio and reconstructed the data using the signal components. Re-sults are shown in Fig. 13a and b in which the data processed by logarithmic transform (Fig. 13b) demonstrate much bet-ter resolution; particularly the signal saturation around the center of the shot gather is greatly reduced in addition to the removal of harmonic noise.
5 Conclusions
This study demonstrates a nonlinear and potentially valuable technique in harmonic noise removal. To verify this promis-ing method, we have examined the validation of the proposed processing procedure through the synthetic model study fol-lowed by the real data investigations. The results show the robustness of this method. While it is successfully applied to the OBS and GPR reflection data, based on our studies in other fields of geophysics, we believe that the application of this method is not limited to reflection data.
The EMD method has been empirically tested widely in various applications other than geophysical research, giving better results than most of the traditional analysis methods. More importantly, the decomposed components are nonlin-ear and reveal true physical meanings. With the aid of log-arithmic transform, the EEMD method is significantly im-proved in resolving signal and noise, and is more reliable in processing data with serious attenuation. However, the pro-posed method is only empirical, and a theoretical foundation
Ocean University for kindly providing the original OBS data and graduate student Pei-Hsin Chen of the Department of Earth Sciences, National Taiwan Normal University for her assistance in collecting the important information of field data. Special thanks go to Luciano Telesca (the editor), Xavier Garcia and one anonymous reviewer for their interest in this work and constructive comments. Finally, we thank G. F. Margrave for sharing the MATLAB func-tion source code of a minimum phase wavelet for impulsive sources.
Edited by: L. Telesca
Reviewed by: X. Garcia and another anonymous referee
References
Bagaini, C.: Acquisition and processing of simultaneous vibroseis data, Geophysical prospecting, 58(1), 81–99, 2010.
Battista, B. M., Knapp, C., McGee, T., and Goebel, V.: Application of the empirical mode decomposition and Hilbert-Huang trans-form to seismic reflection data, Geophysics, 72(2), H29–H37, 2007.
Butler, K. E. and Russell, R. D.: Subtraction of powerline harmon-ics from geophysical records, Geophysharmon-ics, 58(6), 898–903, 1993. Butler, K. E. and Russell, R. D.: Cancellation of multiple harmonic noise series in geophysical records, Geophysics, 68(3), 1083– 1090, 2003.
Feldman, M.: Analytical basics of the EMD: Two harmonics de-composition, Mech. Syst. Signal Pr., 23(7), 2059–2071, 2009. Flandrin, P., Rilling, G., and Gonc¸alv´es, P.: Empirical mode
decom-position as a filter bank, IEEE Signal Proc. Lett., 11(2), 112–114, 2004.
Gloerson, P. and Huang, N. E.: Comparison of interannual intrin-sic modes in hemispheric sea ice covers and others geophyintrin-sical parameters, IEEE T. Geosci. Remote Sens., 41(5), 1062–1074, 2003.
Guitton, A.: Multiple attenuation in complex geology with a pattern-based approach, Geophysics, 70(4), V97–V107, 2005. Guitton, A. and Symes, W.: Robust inversion of seismic data using
the Huber norm, Geophysics, 68(4), 1310–1319, 2003.
Haines, S., Guitton, A., and Biondi, B.: Seismoelectric data pro-cessing for surface surveys of shallow targets, Geophysics, 72(2), G1–G8, 2007.
Huang, N. E. and Wu, Z.: A review on Hilbert–Huang transform: the method and its applications on geophysical studies, Rev. Geo-phys., 46, RG 2006, doi:10.1029/2007RG000228, 2008. Huang, N. E., Shen, Z., Long, S. R., Wu, M. C., Shih, H.-H., Zheng,
decomposition and the Hilbert spectrum for nonlinear and non-stationary time series analysis, P. R. Soc. London A, 454, 903– 995, 1998.
Irving, J. D. and Knight, R. J.: Removal of wavelet dispersion from ground-penetrating radar data, Geophysics, 68(3), 960– 970, 2003.
Jackson, L. P. and Mound, J. E.: Geomagnetic variation on decadal time scales: What can we learn from Empirical Mode Decomposition?, Geophys. Res. Lett., 37, L14307, doi:10.1029/2010GL043455, 2010.
Jeffryes, P.: A method of seismic surveying with overlapping shot times, US Patent 7,050,356, 2002.
Jeng, Y., Li, Y.-W., Chen, C.-S., and Chien, H.-Y.: Adap-tive filtering of random noise in near-surface seismic and ground-penetrating radar data, J. Appl. Geophys., 68, 36–46, doi:10.1016/j.jappgeo.2008.08.013, 2009.
Jeng, Y., Lin, M.-J., Chen, C.-S., and Wang, Y.-H.: Noise reduc-tion and data recovery for a very low frequency electromagnetic survey using the nonlinear decomposition method, Geophysics, 72(5), F223–F235, 2007.
Lee, T. and Ouarda, T. B. M. J.: Long term prediction of precipitation and hydrologic extremes with nonstation-ary oscillation processes, J. Geophys. Res., 115, D13107, doi:10.1029/2009JD012801, 2010.
Lin, M.-J. and Jeng, Y.: Application of the VLF-EM method with EEMD to the study of a mud volcano in southern Taiwan, Geomorphology, 119(1–2), 97–110, doi:10.1016/j.geomorph.2010.02.021, 2010.
Meunier, J. and Bianchi, T.: Harmonic noise reduction opens the way for array size reduction in vibroseis operations, 72nd Annual International Meeting, SEG, Expanded Abstr., 70–73, 2002. Nyman, D. C. and Gaiser, J. E.: Adaptive rejection of highline
con-tamination: 53rd Annual International Meeting, SEG, Expanded Abstr., 321–323, 1983.
Peel, M. C. and McMahon, T. A.: Recent frequency component changes in interannual climate variability, Geophys. Res. Lett., 33, L16810, doi:10.1029/2006GL025670, 2006.
Saucier, A., Marchant, M., and Chouteau, M.: A fast and accu-rate frequency estimation method for canceling harmonic noise in geophysical records, Geophysics, 71(1), V7–V18, 2006. Tsai, H.-R.: The velocity structures of gas hydrate from wide-angle
seismic tomography in the offshore SW Taiwan, M.S. thesis, In-stitute of Applied Geosciences, National Taiwan Ocean Univer-sity, Taiwan, ROC, 96 pp., 2007.
Tsolis, G. S. and Xenos, T. D.: Seismo-ionospheric coupling correlation analysis of earthquakes in Greece, using empirical mode decomposition, Nonlin. Processes Geophys., 16, 123–130, doi:10.5194/npg-16-123-2009, 2009.