metals
Article
Production of Surface Layer with Gradient
Microstructure and Microhardess on Copper by High
Pressure Surface Rolling
Juying Li1, Qingsong Mei2,*, Yana Li1and Beihai Wang1
1 School of Mechanical Engineering, Wuhan Polytechnic University, Wuhan 430023, China;
[email protected] (J.L.); [email protected] (Y.L.); [email protected] (B.W.)
2 School of Power and Mechanical Engineering, Wuhan University, Wuhan 430072, China
* Correspondence: [email protected]; Tel.:+86-276-877-2252
Received: 18 November 2019; Accepted: 27 December 2019; Published: 2 January 2020
Abstract: Pure copper was subjected to high-pressure surface rolling (HPSR) to obtain a surface gradient layer. Effects of HPSR parameters on the surface microstructure and microhardness of Cu were investigated by using optical microscopy, transmission electronic microscopy, X-ray diffraction, and the microhardness test. The HPSR surface layer has a gradient microstructure consisting of increasingly refined grains with decreasing depth from the treated surface (DFS). The thicknesses of the refined surface layer can be up to ~1.8 mm, and the grain size of the topmost surface is down to ~88 nm, depending on the HPSR parameters including pressure, time, and temperature. Microhardness of HPSR samples increases with decreasing DFS, with a maximum of ~2.4 times that of the undeformed matrix. The present results indicated that HPSR could be an effective method for the production of a mm-thick surface layer on Cu with gradient microstructure and property.
Keywords: high-pressure surface rolling; copper; grain refinement; microhardness
1. Introduction
It has been well-known that refining the grains of metals to the submicron or nanoscale can lead to superior properties compared with the coarse-grained counterparts [1,2]. Among the available methods for producing bulk ultrafine or nano-grained metals, severe plastic deformation (SPD) has been widely used [2,3]. By using the SPD-based methods the level of grain refinement is dependent on that of the plastic strain that can be imposed on the metals, which is limited by the deformability of the bulk materials. Alternatively, the production of a surface refined layer was applied to improve the surface properties of metallic materials without changing the characteristics of the matrix [4,5]. Various surface SPD techniques, such as surface mechanical attrition treatment (SMAT) [4,5], surface mechanical grinding treatment (SMGT) [6,7], and high energy shot-peening [8], have been developed to generate a surface gradient layer in metallic materials. The surface gradient layer produced by these methods can be typically characterized by increasingly refined grains (down to the nano or submicron level) with decreasing depth from the surface, leading to significant enhancement in the hardness [4], wear resistance [9], and other surface-related properties [6]. Moreover, it has been found that the gradient nano-micron structure exhibits a better combination of strength and ductility than that of the uniform structure [10]. Also, it has been demonstrated that material parameter such as stacking fault energy has a significant effect on the grain refinement due to the different deformation mechanisms (dislocation slip and deformation twinning) that may occur [11].
Production of the surface refined layer on the copper surface has been obtained using different methods in previous studies [7,11,12]. The microstructure changes of the surface refined layer typically
Metals2020,10, 73 2 of 7
include the thickness of the refined layer, grain size and orientation, grain boundary structure, dislocation density, etc. Usually, the thickness of the gradient surface layer produced on metals is around a few hundred micrometers in most cases [7,11]. Here producing gradient microstructure with thickness in the mm scale is highly desired for further enhancement of surface properties. It can also facilitate the investigation of the microstructure-property relationship of materials with gradient nano-micron structure in the bulk size level. This study aims at the fabrication of a thicker surface layer with gradient microstructure and properties on copper. We demonstrated the ability of high-pressure surface rolling (HPSR) for producing mm-thick surface gradient microstructure on Cu. Th microstructure and hardness of samples processed by different HPSR parameters were comparatively investigated.
2. Materials and Methods
The raw material used in this study is a copper plate (99.97% in mass fraction) with dimensions of Ø50 mm×10 mm (Chinalco Luoyang Copper Co., Ltd., Luoyang, China). Before processing, the samples were annealed at 600◦C for 2 h in Ar atmosphere, polished on silicon carbide abrasive paper grade 800#, and cleaned with acetone in an ultrasonic oscillator.
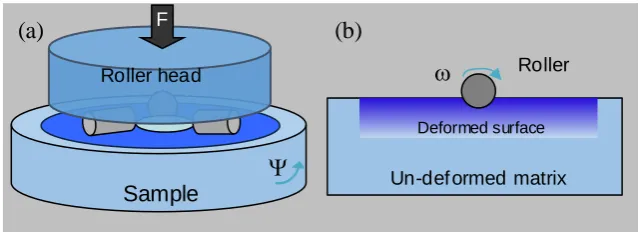
A HPSR equipment was used to deform the Cu samples. As shown in Figure1, HPSR was performed by rotation of six-cylinder rollers (GCr15, Ø8 mm×10 mm, HV≈710) fixed on a roller head under different loads (F) on the sample surface. The repeated rolling of the rollers on the sample surface generates highly localized and gradient plastic strain in the surface layer. More details of the HPSR can be found in [13]. Samples were treated for the different duration at room temperature (RT) and immersed in liquid nitrogen (LN). During HPSR, no obvious increase in temperature on the sample surface was detected. HPSR only induced small changes in the thickness of the sample due to the localized deformation on the surface. The detailed processing parameters of samples are listed in Table1.
Metals 2020, 10, x FOR PEER REVIEW 2 of 8
Production of the surface refined layer on the copper surface has been obtained using different methods in previous studies [7,11,12]. The microstructure changes of the surface refined layer typically include the thickness of the refined layer, grain size and orientation, grain boundary structure, dislocation density, etc. Usually, the thickness of the gradient surface layer produced on metals is around a few hundred micrometers in most cases [7,11]. Here producing gradient microstructure with thickness in the mm scale is highly desired for further enhancement of surface properties. It can also facilitate the investigation of the microstructure-property relationship of materials with gradient nano-micron structure in the bulk size level. This study aims at the fabrication of a thicker surface layer with gradient microstructure and properties on copper. We demonstrated the ability of high-pressure surface rolling (HPSR) for producing mm-thick surface gradient microstructure on Cu. Th microstructure and hardness of samples processed by different HPSR parameters were comparatively investigated.
2. Materials and Methods
The raw material used in this study is a copper plate (99.97% in mass fraction) with dimensions of Ø 50 mm × 10 mm (Chinalco Luoyang Copper Co., Ltd., Luoyang, China). Before processing, the samples were annealed at 600 °C for 2 h in Ar atmosphere, polished on silicon carbide abrasive paper grade 800#, and cleaned with acetone in an ultrasonic oscillator.
A HPSR equipment was used to deform the Cu samples. As shown in Figure 1, HPSR was performed by rotation of six-cylinder rollers (GCr15, Ø 8 mm × 10 mm, HV ≈ 710) fixed on a roller head under different loads (F) on the sample surface. The repeated rolling of the rollers on the sample surface generates highly localized and gradient plastic strain in the surface layer. More details of the HPSR can be found in [13]. Samples were treated for the different duration at room temperature (RT) and immersed in liquid nitrogen (LN). During HPSR, no obvious increase in temperature on the sample surface was detected. HPSR only induced small changes in the thickness of the sample due to the localized deformation on the surface. The detailed processing parameters of samples are listed in Table 1.
Roller
Un-def ormed matrix
Sample
Deformed surface
F
Roller head
(a)
(b)
Figure 1. A schematic illustration of the high-pressure surface rolling. (a) is an overall view and (b) is a cross-sectional view.
Table 1. HPSR parameters for samples. t0 and tf represent the initial and final thicknesses of the
samples, respectively.
Sample Pressure Duration Temperature t0 tf
A 20 KN 20 min RT 10.0 mm 9.5 mm
B 20 KN 35 min RT 10.0 mm 9.4 mm
C 32 KN 35 min RT 10.0 mm 9.1 mm
D 20 KN 35 min LN 10.0 mm 8.8 mm
X-ray diffraction (XRD) measurements were performed with the Cu-Ka radiation in a Bruker D8 Advance X-ray diffractometer (Bruker AXS, Karlsruhe, Germany). A step size of 0.02° and a scanning rate of 1°/min were used in the 2θ range from 40° to 100° in a discontinuous mode. The
Figure 1.A schematic illustration of the high-pressure surface rolling. (a) is an overall view and (b) is a cross-sectional view.
Table 1. HPSR parameters for samples. t0andtf represent the initial and final thicknesses of the
samples, respectively.
Sample Pressure Duration Temperature t0 tf
A 20 KN 20 min RT 10.0 mm 9.5 mm
B 20 KN 35 min RT 10.0 mm 9.4 mm
C 32 KN 35 min RT 10.0 mm 9.1 mm
D 20 KN 35 min LN 10.0 mm 8.8 mm
Metals2020,10, 73 3 of 7
and polishing and chemical etching in a solution of Cr2O3(20 g)+HCl (1.7 mL)+Na2S2O3(2 g)+H2O (100 mL). Transmission electronic microscopy (TEM) observations were performed on a JEM-2010HT microscope (JEOL Ltd., Tokyo, Japan) operated at an accelerating voltage of 200 kV. Cross-section samples for TEM observations were prepared first by electroplating Ni on the treated surface and then processed by mechanically thinning, punching 3 mm disks, and then subjected to the twin-jet method in an electrolyte of H3PO4:C2H6O:H2O=1:1:2 by volume. Microhardness along with depth from the treated surface was measured by an HXS-1000A (Shangguang Microscope Co., Ltd., Shanghai, China) microhardness tester (load 50 gf, load time 5 s).
3. Results and Discussion
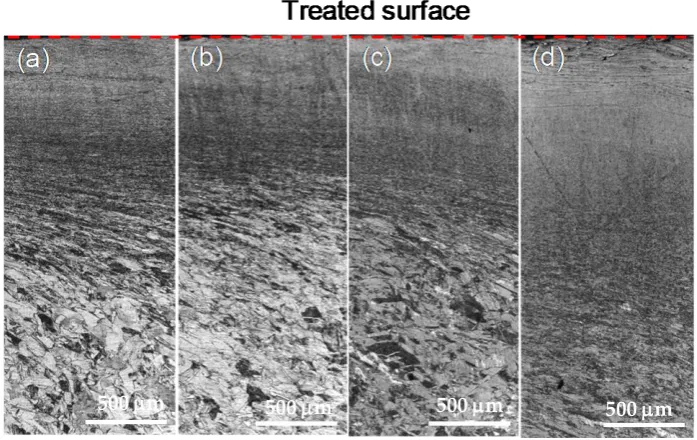
Figure2shows the cross-sectional optical microscopy micrographs of HPSR samples. OM provides an observation of the overall microstructure of the deformed layer. As shown in Figure2, an obvious deformed layer with gradient refined grains can be seen in the HPSR samples. In the region close to the surface, grains are too refined to be distinguished by OM. In the region near the matrix, elongated grains are clearly visible. It has been shown that the microstructure of surface rolled Cu varied from equiaxed refined grains to elongated grains with increasing DFS [14]. While distinct grain structures were formed along with the depth from the surface, there is no sharp boundary between the refined layer and the matrix.
cross-section microstructure of the treated samples was investigated by optical microscopy (OM, OLYMPUS-GX71, OLYMPUS Co., Tokyo, Japan). Samples for OM observations were prepared by mechanical grinding and polishing and chemical etching in a solution of Cr2O3 (20 g) + HCl (1.7 mL)
+ Na2S2O3 (2 g) + H2O (100 mL). Transmission electronic microscopy (TEM) observations were
performed on a JEM-2010HT microscope (JEOL Ltd., Tokyo, Japan) operated at an accelerating voltage of 200 kV. Cross-section samples for TEM observations were prepared first by electroplating Ni on the treated surface and then processed by mechanically thinning, punching 3 mm disks, and then subjected to the twin-jet method in an electrolyte of H3PO4:C2H6O:H2O = 1:1:2 by volume.
Microhardness along with depth from the treated surface was measured by an HXS-1000A (Shangguang Microscope Co., Ltd., Shanghai, China) microhardness tester (load 50 gf, load time 5 s).
3. Results and Discussion
Figure 2 shows the cross-sectional optical microscopy micrographs of HPSR samples. OM provides an observation of the overall microstructure of the deformed layer. As shown in Figure 2, an obvious deformed layer with gradient refined grains can be seen in the HPSR samples. In the region close to the surface, grains are too refined to be distinguished by OM. In the region near the matrix, elongated grains are clearly visible. It has been shown that the microstructure of surface rolled Cu varied from equiaxed refined grains to elongated grains with increasing DFS [14]. While distinct grain structures were formed along with the depth from the surface, there is no sharp boundary between the refined layer and the matrix.
Figure 2. Cross-sectional optical microscopy images of high-pressure surface rolling samples. (a)
Sample A, (b) Sample B, (c) Sample C, and (d) Sample D.
As shown in Figure 2, the refined layer of the present HPSR samples has a thickness between 1094–1760 μm, depending on the HPSR parameters. Compared with those produced by other techniques, such as surface mechanical attrition treatment (SMAT) of ~800 μm[11], and surface mechanical grinding treatment (SMGT) of ~200 μm [7], the refined layer produced by the present HPSR technique is much thicker, which can be attributed to the large pressure applied to the sample during surface rolling.
The thicknesses of the refined layer of the HPSR samples (measured with an average of ten regions in the sample) are shown in Figure 3. Comparing samples A and B with the same pressure and temperature, it is indicated that the increase of HPSR duration can lead to an increase of the thicknesses of the refiner layer. This is because as rolling time increases, the degree of plastic strain
500 m 500 m 500 m 500 m
Figure 2.Cross-sectional optical microscopy images of high-pressure surface rolling samples. (a) Sample A, (b) Sample B, (c) Sample C, and (d) Sample D.
As shown in Figure2, the refined layer of the present HPSR samples has a thickness between 1094–1760 µm, depending on the HPSR parameters. Compared with those produced by other techniques, such as surface mechanical attrition treatment (SMAT) of ~800µm [11], and surface mechanical grinding treatment (SMGT) of ~200µm [7], the refined layer produced by the present HPSR technique is much thicker, which can be attributed to the large pressure applied to the sample during surface rolling.
Metals2020,10, 73 4 of 7
the refiner layer increase with an increase of the HPSR pressure. The reasons are that an increase of the pressure can lead to an increase in the plastic strain on the surface. Obviously, an increase in the HPSR time or the pressure leads to the increase of the amount of deformation and hence the thicknesses of the refiner layer. In comparison with sample B, sample D has a thicker refined layer, indicating the significant effect of HPSR temperature. By HPSR at a lower temperature, dislocation annihilation or dynamic recrystallization can be suppressed; thus, a deeper refined layer can be obtained. It is noted that the error bars in Figure3represent the range of the thickness of the refined layer, which is mainly due to the unevenness of the deformed layer as a result of the heterogeneity of the plastic deformation by HPSR from a microstructural point of view. It is also noted that a strict relationship between the thickness of the refined layer and the HPSR parameters is beyond the scope of this study, and the exact value of the mean thickness may depend on the statistical method of the data. In our case, it is clearly showed that the thickness of the refined layer depends on the HPSR parameters. This relation makes it possible to tailor the thickness of the refined layer on a relatively large scale by using HPSR.
Metals 2020, 10, x FOR PEER REVIEW 4 of 8
imposed on the sample increases, the deeper it can be transferred to the subsurface. Thereby a thicker refined layer was formed. For samples B and C having the same HPSR duration and temperature, the thicknesses of the refiner layer increase with an increase of the HPSR pressure. The reasons are that an increase of the pressure can lead to an increase in the plastic strain on the surface. Obviously, an increase in the HPSR time or the pressure leads to the increase of the amount of deformation and hence the thicknesses of the refiner layer. In comparison with sample B, sample D has a thicker refined layer, indicating the significant effect of HPSR temperature. By HPSR at a lower temperature, dislocation annihilation or dynamic recrystallization can be suppressed; thus, a deeper refined layer can be obtained. It is noted that the error bars in Figure 3 represent the range of the thickness of the refined layer, which is mainly due to the unevenness of the deformed layer as a result of the heterogeneity of the plastic deformation by HPSR from a microstructural point of view. It is also noted that a strict relationship between the thickness of the refined layer and the HPSR parameters is beyond the scope of this study, and the exact value of the mean thickness may depend on the statistical method of the data. In our case, it is clearly showed that the thickness of the refined layer depends on the HPSR parameters. This relation makes it possible to tailor the thickness of the refined layer on a relatively large scale by using HPSR.
A B C D
0 500 1000 1500 2000 2500
T
h
ic
k
n
e
s
s
(
m
)
Sample
Figure 3. Thickness of the refined layer of the HPSR samples.
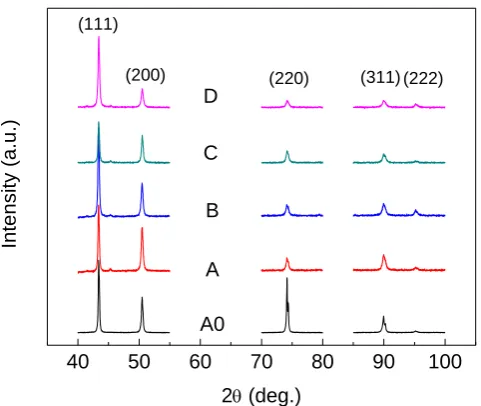
X-ray diffraction patterns of the HPSR samples are shown in Figure 4. An obvious broadening of the diffraction peaks is observed, indicating the significant grain refinement and microstrain in the HPSR samples. The grain size of the HPSR sample can be quantitatively estimated by the Scherrer–Wilson equation [15]. The grain sizes at the topmost surface are 185.5 nm, 458.9 nm, 360.2 nm, and 88.0 nm, for samples A, B, C, and D, respectively.
In the present study, we obtained a refined layer with a minimum grain size of ~88.0 nm on copper by HPSR, which is much larger than that produced by SMAT and SMGT [7,11]. It is probably because that deformation twinning plays an important role in plastic deformation in SMAT and SMGT, which facilitates the refinement of grains.
Figure 5 shows the TEM micrographs of HPSR samples. As shown in Figure 5, equiaxed grains of several hundreds of nanometers were formed in the near-surface after HPSR. Meanwhile, a mixture of elongated and equiaxed grains can be observed in the HPSR samples, as shown in Figure 6a, indicating a co-existence of different mechanisms for strain-induced grain refinement, e.g., dynamic recrystallization and formation of geometrically necessary boundaries. As shown in Figure 6b, it is also noted that much smaller grains were observed in some local regions, which can be attributed to the highly localized plastic strain inside the sample subjected to HPSR.
Figure 3.Thickness of the refined layer of the HPSR samples.
X-ray diffraction patterns of the HPSR samples are shown in Figure4. An obvious broadening of the diffraction peaks is observed, indicating the significant grain refinement and microstrain in the HPSR samples. The grain size of the HPSR sample can be quantitatively estimated by the Scherrer–Wilson equation [15]. The grain sizes at the topmost surface are 185.5 nm, 458.9 nm, 360.2 nm, and 88.0 nm, for samples A, B, C, and D, respectively.
In the present study, we obtained a refined layer with a minimum grain size of ~88.0 nm on copper by HPSR, which is much larger than that produced by SMAT and SMGT [7,11]. It is probably because that deformation twinning plays an important role in plastic deformation in SMAT and SMGT, which facilitates the refinement of grains.
40 50 60 70 80 90 100
In
te
n
s
it
y
(
a
.u
.)
2 (deg.) A
B C D
A0
(111)
(200) (220) (311) (222)
Figure 4. X-ray diffraction patterns of HPSR samples as indicated. Sample A0 represents the annealed Cu.
(a)
(b)
(c)
(d)
500 nm
500 nm 200 nm
100 nm
Figure 5. Transmission electronic microscopy images of HPSR samples taken at ~50 m from the
surface. (a) Sample A, (b) Sample B, (c) Sample C, and (d) Sample D.
Figure 7 shows the microhardness along with the depth from the surface of the HPSR samples. As seen in Figure 7, the surface hardness was significantly enhanced after HPSR. With decreasing DFS, the microhardness increases up to ~2.4 times that of the matrix for sample D. The enhancement of microhardness of the HPSR samples can be attributed to the grain refinement induced by HPSR, as described by the Hall–Petch relation [16]. Also, an increase of the microstrain (dislocation density) in the HPSR samples can contribute to the strengthening of the surface layer.
Figure 4. X-ray diffraction patterns of HPSR samples as indicated. Sample A0 represents the annealed Cu.
40 50 60 70 80 90 100
In
te
n
s
it
y
(
a
.u
.)
2 (deg.) A
B C D
A0
(111)
(200) (220) (311) (222)
Figure 4. X-ray diffraction patterns of HPSR samples as indicated. Sample A0 represents the annealed Cu.
(a)
(b)
(c)
(d)
500 nm
500 nm 200 nm
100 nm
Figure 5. Transmission electronic microscopy images of HPSR samples taken at ~50 m from the
surface. (a) Sample A, (b) Sample B, (c) Sample C, and (d) Sample D.
Figure 7 shows the microhardness along with the depth from the surface of the HPSR samples. As seen in Figure 7, the surface hardness was significantly enhanced after HPSR. With decreasing DFS, the microhardness increases up to ~2.4 times that of the matrix for sample D. The enhancement of microhardness of the HPSR samples can be attributed to the grain refinement induced by HPSR, as described by the Hall–Petch relation [16]. Also, an increase of the microstrain (dislocation density) in the HPSR samples can contribute to the strengthening of the surface layer.
Figure 5. Transmission electronic microscopy images of HPSR samples taken at ~50µm from the surface. (a) Sample A, (b) Sample B, (c) Sample C, and (d) Sample D.
Metals2020,10, 73 6 of 7
Metals 2020, 10, x FOR PEER REVIEW 6 of 8
(a)
(b)
Figure 6. (a) Transmission electronic microscopy image showing the coexistence of elongated and equiaxed grains in the HPSR sample D taken at ~110 μm from the surface. (b) High resolution transmission electronic microscopy image showing the locally formed small grains in the HPSR sample D taken at ~80 μm from the surface.
500 1000 1500 2000 2500
80 100 120 140 160 180 200 Sample A Sample B Sample C Sample D M ic ro h a rd n e s s ( H V )
Depth from surface (m)
Matrix
Figure 7. Microhardness as a function of depth from the surface of the HPSR samples.
The thickness of the hardened layer (the depth from surface at which the microhardness equals that of the matrix) is larger than that of the refined layer as determined by microstructure. This is due to the fact that while dislocation strengthening contributes to the strengthening (hardening) of the sample, dislocations cannot be clearly distinguished by the OM images. A comparison of different methods for surface strengthening by surface refinement is shown in Table 2. It is seen from Table 2 that while remarkable surface strengthening can be achieved through surface grain refinement by using different methods, the present HPSR method provides a way for the formation of a mm-thick layer with gradient-refined grains.
Table 2. Comparison of the surface refined layer on Cu generated by different methods.
Method Thickness of Refined Layer (μm)
Min. Grain Size (nm)
Max. Hardness
(GPa) Ref.
HPSR ~1760 88 1.9 This study
SMAT ~800 10 1.3 [11]
SMGT ~200 22 2.1 [7]
Figure 6. (a) Transmission electronic microscopy image showing the coexistence of elongated and equiaxed grains in the HPSR sample D taken at ~110µm from the surface. (b) High resolution transmission electronic microscopy image showing the locally formed small grains in the HPSR sample D taken at ~80µm from the surface.
Metals 2020, 10, x FOR PEER REVIEW 6 of 8
(a)
(b)
Figure 6. (a) Transmission electronic microscopy image showing the coexistence of elongated and equiaxed grains in the HPSR sample D taken at ~110 μm from the surface. (b) High resolution transmission electronic microscopy image showing the locally formed small grains in the HPSR sample D taken at ~80 μm from the surface.
500 1000 1500 2000 2500
80 100 120 140 160 180 200 Sample A Sample B Sample C Sample D M ic ro h a rd n e s s ( H V )
Depth from surface (m) Matrix
Figure 7. Microhardness as a function of depth from the surface of the HPSR samples.
The thickness of the hardened layer (the depth from surface at which the microhardness equals that of the matrix) is larger than that of the refined layer as determined by microstructure. This is due to the fact that while dislocation strengthening contributes to the strengthening (hardening) of the sample, dislocations cannot be clearly distinguished by the OM images. A comparison of different methods for surface strengthening by surface refinement is shown in Table 2. It is seen from Table 2 that while remarkable surface strengthening can be achieved through surface grain refinement by using different methods, the present HPSR method provides a way for the formation of a mm-thick layer with gradient-refined grains.
Table 2. Comparison of the surface refined layer on Cu generated by different methods.
Method Thickness of
Refined Layer (μm)
Min. Grain Size (nm)
Max. Hardness
(GPa) Ref.
HPSR ~1760 88 1.9 This study
SMAT ~800 10 1.3 [11]
SMGT ~200 22 2.1 [7]
Figure 7.Microhardness as a function of depth from the surface of the HPSR samples.
The thickness of the hardened layer (the depth from surface at which the microhardness equals that of the matrix) is larger than that of the refined layer as determined by microstructure. This is due to the fact that while dislocation strengthening contributes to the strengthening (hardening) of the sample, dislocations cannot be clearly distinguished by the OM images. A comparison of different methods for surface strengthening by surface refinement is shown in Table2. It is seen from Table2
that while remarkable surface strengthening can be achieved through surface grain refinement by using different methods, the present HPSR method provides a way for the formation of a mm-thick layer with gradient-refined grains.
Table 2.Comparison of the surface refined layer on Cu generated by different methods.
Method Thickness of Refined Layer (µm)
Min. Grain Size (nm)
Max. Hardness
(GPa) Ref.
HPSR ~1760 88 1.9 This study
SMAT ~800 10 1.3 [11]
SMGT ~200 22 2.1 [7]
4. Conclusions
microhardness increases with decreasing DFS for HPSR samples, up to ~2.4 times that of the matrix, which is due to the grain size strengthening. The present study provided a technique for generating a mm-thick layer with gradient-refined microstructure and enhanced hardness in metals.
Author Contributions:Conceptualization—J.L. and Q.M.; Analysis—J.L. and Q.M.; Writing—original draft—J.L. and Q.M.; Writing—review & editing—J.L., Q.M., Y.L. and B.W. All authors have read and agreed to the published version of the manuscript.
Funding: This work was funded by the National Natural Science Foundation of China (grant 51371128) and the Research Funds for the Top-Class Universities of Hubei Province (grant 03080107) and the APC was funded by 03080107.
Conflicts of Interest:The authors declare no conflict of interest.
References
1. Gleiter, H. Nanocrystalline materials.Prog. Mater. Sci.1989,33, 223–315. [CrossRef]
2. Valiev, R. Nanostructuring of metals by severe plastic deformation for advanced properties.Nat. Mat.2004,
3, 511–516. [CrossRef] [PubMed]
3. Valiev, R.Z.; Langdon, T.G. Principles of equal-channel angular pressing as a processing tool for grain refinement.Prog. Mater. Sci.2006,51, 881–981. [CrossRef]
4. Lu, K.; Lu, J. Surface nanocrystallization (SNC) of metallic materials-presentation of the concept behind a new approach.Mater. Sci. Technol.1999,15, 193–197.
5. Lu, K.; Lu, J. Nanostructured surface layer on metallic materials induced by surface mechanical attrition treatment.Mater. Sci. Eng.2004,38, 375–377. [CrossRef]
6. Liu, X.C.; Zhang, H.W.; Lu, K. Strain-Induced Ultrahard and Ultrastable Nanolaminated Structure in Nickel.
Science2013,342, 337–340. [CrossRef] [PubMed]
7. Li, W.L.; Tao, N.R.; Lu, K. Fabrication of a gradient nano-micro-structured surface layer on bulk copper by means of a surface mechanical grinding treatment.Scripta Mater.2008,59, 546–549. [CrossRef]
8. Zhang, X.; Hansen, N.; Gao, Y.; Huang, X. Hall-Petch and dislocation strengthening in graded nanostructured steel.Acta Mater.2012,60, 5933–5943. [CrossRef]
9. Wang, Z.B.; Tao, N.R.; Li, S.; Wang, W.; Liu, G.; Lu, J.; Lu, K. Effect of surface nanocrystallization on friction and wear properties in low carbon steel.Mater. Sci. Eng.2003,352, 144–149. [CrossRef]
10. Fang, T.H.; Li, W.L.; Tao, N.R.; Lu, K. Revealing Extraordinary Intrinsic Tensile Plasticity in Gradient Nano-Grained Copper.Science2011,331, 1587–1590. [CrossRef] [PubMed]
11. Wang, K.; Tao, N.R.; Liu, G.; Lu, J.; Lu, K. Plastic strain-induced grain refinement at the nanometer scale in copper.Acta Mater.2006,54, 5281–5291. [CrossRef]
12. Zhang, Y.S.; Zhang, P.X.; Niu, H.Z.; Chen, C.; Wang, G.; Xiao, D.H.; Chen, X.H.; Yua, Z.T.; Yuan, S.B.; Bai, X.F. Surface nanocrystallization of Cu and Ta by sliding friction.Mater. Sci. Eng. A2014,607, 351–355. [CrossRef] 13. Liu, M.; Li, J.Y.; Ma, Y.; Yuan, T.Y.; Mei, Q.S. Surface nanocrystallization and property of Ti6Al4V alloy
induced by high pressure surface rolling.Sur. Coat. Tech.2016,289, 94–100. [CrossRef]
14. Mei, Q.S.; Tsuchiya, K.; Gao, H. Different stages in the continuous microstructural evolution of copper deformed to ultrahigh plastic strains.Scr. Mater.2012,67, 1003–1006. [CrossRef]
15. Klug, H.P.; Alexander, L.E.X-ray Diffraction Procedures for Polycrystalline and Amorphous Materials; Wiley: Hoboken, NJ, USA, 1974.
16. Hansen, N. Hall-Petch relation and boundary strengthening.Scripta Mater.2014,51, 801–806. [CrossRef]