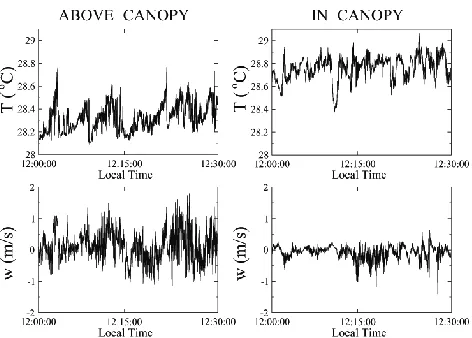
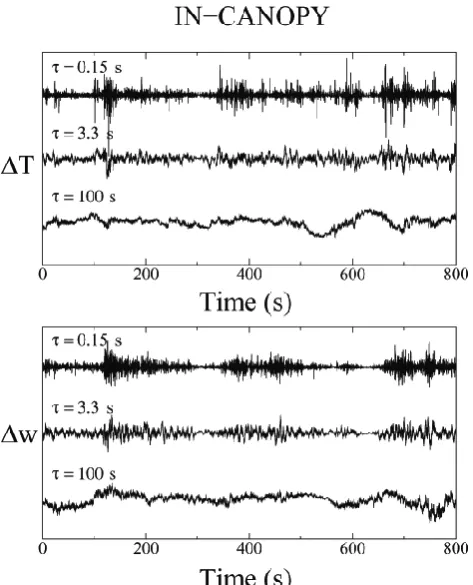
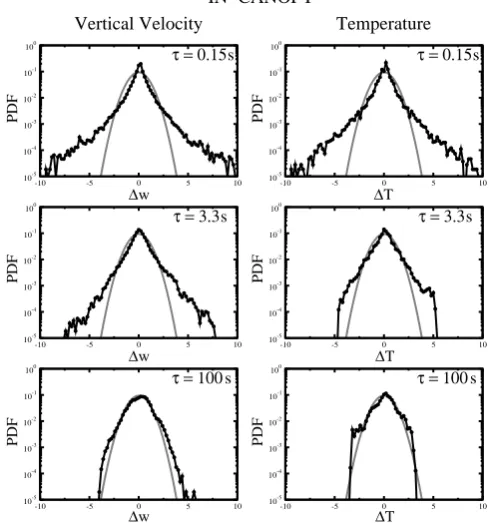
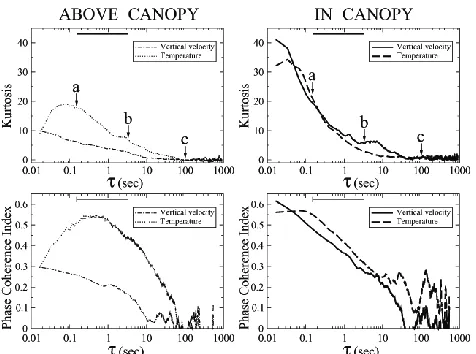
Analysis of phase coherence in fully developed atmospheric turbulence: Amazon forest canopy
7
0
0
Full text
Figure
Related documents
