www.ocean-sci.net/12/1091/2016/ doi:10.5194/os-12-1091-2016
© Author(s) 2016. CC Attribution 3.0 License.
Effect of gas-transfer velocity parameterization choice on air–sea
CO
2
fluxes in the North Atlantic Ocean and the European Arctic
Iwona Wrobel and Jacek Piskozub
Institute of Oceanology, Polish Academy of Sciences, Sopot, Poland Correspondence to:Iwona Wróbel (iwrobel@iopan.gda.pl)
Received: 22 September 2015 – Published in Ocean Sci. Discuss.: 3 November 2015
Revised: 2 September 2016 – Accepted: 14 September 2016 – Published: 30 September 2016
Abstract. The oceanic sink of carbon dioxide (CO2)is an important part of the global carbon budget. Understanding uncertainties in the calculation of this net flux into the ocean is crucial for climate research. One of the sources of the un-certainty within this calculation is the parameterization cho-sen for the CO2gas-transfer velocity. We used a recently de-veloped software toolbox, called the FluxEngine (Shutler et al., 2016), to estimate the monthly air–sea CO2 fluxes for the extratropical North Atlantic Ocean, including the Euro-pean Arctic, and for the global ocean using several published quadratic and cubic wind speed parameterizations of the gas-transfer velocity. The aim of the study is to constrain the uncertainty caused by the choice of parameterization in the North Atlantic Ocean. This region is a large oceanic sink of CO2, and it is also a region characterized by strong winds, especially in winter but with good in situ data coverage. We show that the uncertainty in the parameterization is smaller in the North Atlantic Ocean and the Arctic than in the global ocean. It is as little as 5 % in the North Atlantic and 4 % in the European Arctic, in comparison to 9 % for the global ocean when restricted to parameterizations with quadratic wind de-pendence. This uncertainty becomes 46, 44, and 65 %, re-spectively, when all parameterizations are considered. We suggest that this smaller uncertainty (5 and 4 %) is caused by a combination of higher than global average wind speeds in the North Atlantic (> 7 ms−1)and lack of any seasonal changes in the direction of the flux direction within most of the region. We also compare the impact of using two different in situpCO2 data sets (Takahashi et al. (2009) and Surface Ocean CO2Atlas (SOCAT) v1.5 and v2.0, for the flux calcu-lation. The annual fluxes using the two data sets differ by 8 % in the North Atlantic and 19 % in the European Arctic. The seasonal fluxes in the Arctic computed from the two data sets
disagree with each other possibly due to insufficient spatial and temporal data coverage, especially in winter.
1 Introduction
The region of extratropical North Atlantic Ocean, including the European Arctic, is a region responsible for the forma-tion of deep ocean waters (see Talley, 2013, for a recent review). This process, part of the global overturning circu-lation, makes the area a large sink of atmospheric carbon dioxide (CO2)(Takahashi et al., 2002, 2009; Landschützer et al., 2014; Le Quéré et al., 2015; Orr et al., 2001). There-fore, there is a widespread interest in tracking the changes in the North Atlantic net CO2fluxes, especially as models ap-pear to predict a decrease in the sink volume later this century (Halloran et al., 2015).
Figure 1.Seasonal and annual mean air–sea fluxes of CO2(mg C m−2day−1)in the North Atlantic, using Nightingale et al. (2000).k pa-rameterization and Takahashi et al. (2009) climatology:(a)annual,(b)DJF (winter),(c)MAM (spring),(d)JJA (summer), and(e)SON (autumn). The gaps (white areas) are due to missing data, land, and ice masks.
Table 1.Annual air–sea CO2fluxes (in Pg) using differentkparameterizations. The values in parentheses are fluxes normalized to Nightin-gale et al. (2000; as in Fig. 7).
Global Arctic North Atlantic Southern Ocean
Figure 2.Some relevant surface ocean currents in the North Atlantic Ocean and the European Arctic against the background of the annual mean air–sea CO2fluxes (mg C m−2day−1)as in Fig. 1. The North Atlantic Drift continues as the Norwegian–Atlantic Current in the Nordic Seas.
To study the rate of the ocean CO2sink and especially its long-term trend, one needs to first constrain the uncertainty in the flux calculation. The global interannual variability in air–sea CO2fluxes can be about 60 % due to differences in
pCO2and 35 % by gas-transfer velocitykparameterization (Couldrey et al., 2016). Sources of uncertainty include sam-pling coverage, the method of data interpolation, data quality of the fugacity of CO2(fCO2), the method used for normal-ization of fugacity data to a reference year in a world of ever increasing atmospheric CO2, the measurement uncertainty in all the parameters used to calculate the fluxes (partial pres-sure in water and air, bulk and skin water temperatures, air temperatures, wind speed, etc.), and some which are not usu-ally included in the calculations but most probably influence the flux values (sea state parameters, air bubble void frac-tion, surfactant effects, etc.) as well as the choice of the gas-transfer velocity k parameterization formula (Landschützer et al., 2014). It has also been identified that the choice of the wind data product provides an additional source of un-certainty in gas-transfer velocity, even by 10–40 %, and the choice of the wind speed parameterization may cause vari-ability in k by as much as about 50 % (Gregg et al., 2014;
Couldrey et al., 2016). In this work we have analysed solely the effects of the choice between various published empir-ical wind-driven gas-transfer parameterizations. The North Atlantic is one of the regions of the world ocean best cov-ered by CO2fugacity measurements (Watson et al., 2011), the coverage of the Arctic seas is much poorer, especially in winter (Schuster et al., 2013).
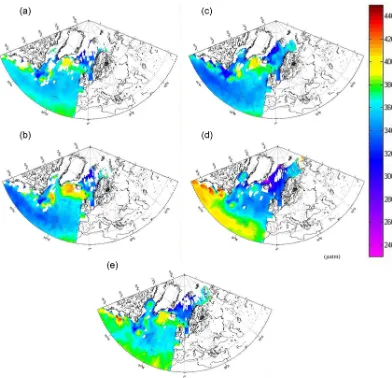
Figure 3.Seasonal and annualpCO2values (µatm) in surface waters of the North Atlantic, estimated using the Takahashi et al. (2009) climatology:(a)annual,(b)DJF (winter),(c)MAM (spring),(d)JJA (summer), and(e)SON (autumn). The gaps (white areas) are due to missing data, land and ice masks.
the effect of stronger winds on the net flux calculations to be investigated by using published gas-transfer velocity formu-las.
2 Methods
2.1 Data sets
We calculated net air–sea CO2 fluxes using a set of soft-ware processing tools called the “FluxEngine” (Shutler et al., 2016), which was created as part of European Space Agency funded OceanFlux Greenhouse Gases (GHGs) project (http: //www.oceanflux-ghg.org). The tools were developed to pro-vide the community with a verified and consistent toolbox and to encourage the use of satellite Earth observation (EO) data for studying air–sea fluxes. The toolbox source code can be downloaded or alternatively there is a version that can be
com-ponents and structure of the net air–sea gas flux calculation and choose the transfer velocity parameterization.
For the calculations, we used pCO2 and salinity values from Takahashi et al. (2009) climatology, which was based on more than 3 million measurements of surface waterpCO2 in open-ocean environments during non-El Niño conditions. For some calculations, we used, as an alternative, Surface Ocean CO2 Atlas (SOCAT) v1.5 and v2.0 (Sabine et al., 2013; Pfeil et al., 2013; Bakker et al., 2014)pCO2, and as-sociated SST data. SOCAT is a community-driven data set containing 6.3 and 10.1 million surface water CO2fugacity values for v1.5 and v2.0, respectively, with a global cover-age. The SOCAT databases have been re-analysed and then converted to climatologies using the methodology described in Goddijn-Murphy et al. (2015). All the climatologies were calculated for year 2010 with the FluxEngine toolset. The SSTskin (defined within Group for High Resolution SST (GHRSST) as temperature of the surface measured by an infrared radiometer operating at the depth of ∼10–20 µm) values were taken from the Advance Along Track Scanning Radiometer (ESA/ARC/(A)ATSR) Global Monthly Sea Sur-face data set (Merchant et al., 2012) in the case of both data sets, and have been preprocessed in the same way for use with the FluxEngine (Shutler et al., 2016).
We used EO wind speed and sea roughness (σ0 – al-timeter backscatter signal in Ku-band from GlobWave L2P products) data obtained from the European Space Agency (ESA). The GlobWave satellite products give a “uniform” set of along track satellite wave data from all available Al-timeters (spanning multiple space agencies) and from ESA Synthetic Aperture Radar (SAR) data and are publicity avail-able at the Ifremer/CERSAT cloud (http://globwave.ifremer. fr/products/data-access). Wave data are collected from six al-timeter missions (Topex/POSEIDON, Jason-1/22, CryoSAT, GEOSAT, and GEOSAT Follow On) and from ESA SAR missions, namely ERS-1/2 and ENVISAT. All data come in netCDF-3 format.
All analyses were performed using global data con-tained in the FluxEngine software. From the gridded product (1◦×1◦) we extracted data from the extratropical North At-lantic Ocean (north of 30◦N), and its subset, the European Arctic (north of 64◦N). For comparison, we also calculated fluxes in the Southern Ocean (south of 40◦S). Hereafter, we follow the convention of that sources of CO2(upward ocean-to-atmosphere gas fluxes) are positive and sinks (downward atmospheto-ocean gas fluxes) are negative. We give all re-sults of net CO2 fluxes in the SI unit of Pg (Pg is 1015g, which is numerically identical to Gt).
2.2 kparameterizations
The flux of CO2 at the interface of air and the sea is con-trolled by wind speed, sea state, SST, and other factors. We estimate the net air–sea flux of CO2 (F, mg C m−2day−1) as the product of gas-transfer velocity (k, ms−1) and the
dif-ference in CO2 concentration (gm−3) in the sea water and its interface with the air (Land et al., 2013). The concentra-tion of CO2 in sea water is the product of its solubility (α, gm−3µatm−1)and its fugacity (fCO2, µatm). Solubility is, in turn, a function of salinity and temperature. HenceF is defined as
F =k(αWfCO2W−αSfCO2A), (1) where the subscripts denote values in water (W) and the air– sea interface (S) and in the air (A). We can exchange fugacity with the partial pressure (their values differ by < 0.5 % over the temperature range considered; McGillis et al., 2001). So Eq. (1) now becomes
F =k(αWpCO2W−αSpCO2A). (2) One can also ignore the differences between the two solu-bilites, and just use the waterside solubilityαW. Equation (2) will then become
F =kαW(pCO2W−pCO2A). (3) This formulation is often referred to as the “bulk parameter-ization”.
In this study we chose to analyse the air–sea gas fluxes using five different gas-transfer parameterizations (k). All of them are wind speed parameterizations, but differ in the for-mula used:
k=√(660.0/Scskin)·(0.212U102 +0.318U10) (4) (Nightingale et al., 2000),
k=√(660.0/Scskin)·0.254U102 (5) (Ho et al., 2006),
k=√(660.0/Scskin)·0.0283U103 (6) (Wanninkhof and McGillis, 1999),
k=√(660.0/Scskin)·0.251U102 (7) (Wanninkhof, 2014),
k=√(660.0/Scskin)·(3.3+0.026U103) (8) (McGillis et al., 2001),
where Scskin stands for the Schmidt numbers at the skin surface, a function of SST ([=(kinematic viscosity of wa-ter)/(diffusion coefficient of CO2 in water)]), 660.0 is the Schmidt number corresponding to values of CO2 at 20◦C in seawater, andU10 is the wind speed 10 m above the sea surface.
sepa-Figure 4.Wind speed distributionU10(ms−1)in the North Atlantic used to determine the relationship between gas-transfer velocity and air–sea CO2fluxes:(a)annual,(b)DJF (winter),(c)MAM (spring),(d)JJA (summer), and(e)SON (autumn). The gaps (white areas) are due to missing data, land, and ice masks.
rate evaluation of the effect of the two processes on air– sea gas fluxes and it is an algorithm that has yet to be cali-brated. We used two versions of this parameterization: wind-driven direct transfer (using the U10 wind fields) and radar backscatter-driven direct transfer (using mean wave square slope) as described in Goddijn-Murphy et al. (2012).
3 Results
Using the FluxEngine software, we have produced global gridded monthly net CO2air–sea fluxes and from these we have extracted the values for the two study regions, the ex-tratropical North Atlantic Ocean and separately for its sub-set – the European Arctic seas. Figure 1 shows maps of the monthly mean air–sea CO2 fluxes for the North Atlantic, calculated with Nightingale et al. (2000; hereafter called
N2000)k parameterization and the Takahashi et al. (2009) climatology for the whole year and for each season. The area, as a whole, is a sink of CO2but some regions close to North Atlantic Drift and East Greenland Current (Fig. 2) are net sources. At the seasonal maps one can see more variability caused by physical process (with temperature changes caus-ing maximum oceanic pCO2 in summer) or biological ac-tivity (with phytoplankton blooms causing summer values to be lowest in the annual cycle). For example, the areas close to the North Atlantic Drift and East Greenland Current are sinks of CO2in the summer (likely due to the growth of phy-toplankton) while the southern most areas of the region be-come CO2sources in summer and autumn (which is likely to be due to the effect of sea-water temperature changes). Much of this variability is caused by changes in the surface water
Figure 5.Difference maps for the air–sea CO2fluxes (mg C m−2day−1) in the North Atlantic, between a cubed and a squared parameter-ization (Wanninkhof and McGillis, 1999 and Wanninkhof, 2014):(a)annual,(b)DJF (winter),(c)MAM (spring),(d)JJA (summer) and (e)SON (autumn). The gaps (white areas) are due to missing data, land, and ice masks.
season (and variability in atmospheric CO2partial pressure, not shown). However, the flux is proportional to the product of 1pCO2andk. In most parameterizationskis a function of wind speed (Eqs. 4–8). The mean wind speedU10for the whole year and each season are shown in Fig. 4. The wind speeds in the North Atlantic are higher than the mean value in the world ocean (which is 7 m s−1; Couldrey et al., 2016), with mean values higher than 10 m s−1in many regions of the study area in all seasons except for the summer (with the highest values in winter). This is important because the air–sea flux depends not only on average wind speed but also on its distribution (see Discussion below). This effect is espe-cially visible between formulas with different powers ofU10.
Figure 5 shows the difference in the air–sea CO2fluxes calcu-lated using two example parameterizations: one proportional toU103 (Eq. 6) and one toU102 (Eq. 7), namely Wanninkhof and McGillis (1999; hereafter called WMcG1999) and Wan-ninkhof (2014; hereafter called W2014). It can be seen that the “cubic” function results in higher absolute air–sea flux values when compared to the “quadratic” function in the re-gions of high winds, and lower absolute air–sea flux values in weaker winds.
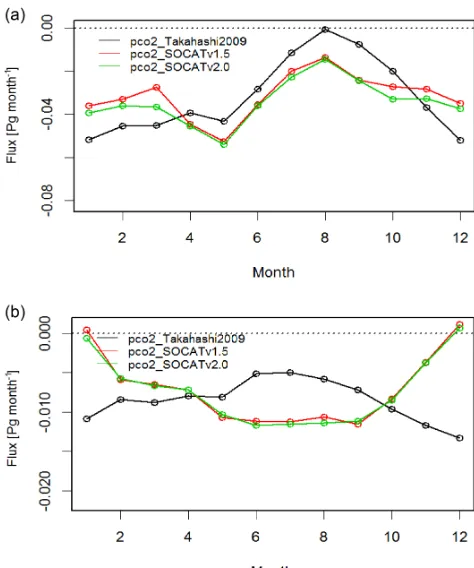
Figure 6.Monthly values of CO2air–sea fluxes (Pg month−1)for the five parameterizations (Eqs. 4–8);(a)the North Atlantic,(b)the European Arctic.
the North Atlantic. The results using cubic parameterizations (Eqs. 6 and 8) are higher in absolute values, by up to 30 % for WMcG1999 and 55 % for McGillis et al. (2001; hereafter called McG2001), in comparison to the “quadratic” of N2000 (Eq. 4). The other two “quadratic” parameterizations W2014 and Ho et al. (2006; hereafter called H2006; Eqs. 5 and 7) resulted in fluxes within 5 % of N2000. In addition to the five parameterizations, Fig. 7 presents results for both of the OceanFlux GHG Evolution formulas (using wind and radar backscatter data). The mean and standard deviations of the parameterization ensemble are shown as grey vertical lines. The standard deviation in global fluxes is similar to previous estimates (Sweeney et al., 2007; Landschützer et al., 2014) but they cannot be directly compared due to different param-eterization choices and methodologies. Annual net fluxes for the North Atlantic, Southern and global oceans, as well as for the European Arctic, are shown in Table 1. The results show that the annual North Atlantic net air–sea CO2sink, depend-ing on the formula used, varies from −0.38 for N2000 to −0.56 Pg C for McG2001. In the case of global net air–sea CO2sink the values are−1.30 and−2.15 Pg C, respectively. Table 1 as well as Fig. 7 shows the same data “normalized” to the N2000 data (divided by value), which allows us to vi-sualize the relative differences (in Table 1 values in
parenthe-ses). In the case of the North Atlantic, using the “quadratic” W2014 and H2006 parameterizations results in net air–sea fluxes that are 4 and 5 % higher in absolute values, respec-tively, than the equivalent N2000 result, while the “cubic” WMcG1999 and McG2000 result in values that are 28 and 44 % higher, respectively, than the N2000 results for this re-gions. The respective values for the Arctic are 3 % for W2014 and 4 % for H2006, as well as 28 % for WMcG1999 and 44 % for McG2001 than N2000. In the case of global net air–sea CO2 fluxes the equivalent values are 8 % (W2014) and 9 % (H2006) higher than the N2000 result for the quadratic func-tions as well as 33 % (WMcG1999) and 65 % (McG2001) for cubic ones. The OceanFlux GHG parameterization for the backscatter and wind-driven versions, results in net air–sea CO2fluxes higher for North Atlantic Ocean than the N2000, that are 38 and 47 %, respectively, and in the global case the values, for those two versions, were 44 and 52 % higher, re-spectively, than N2000 values. The spread of the Arctic val-ues was lower than that of the Atlantic valval-ues (see Table 1). On the other hand, the values for the Southern Ocean were slightly higher than for the North Atlantic but lower than the global values, with the exception of the OceanFlux GHG pa-rameterizations.
All the above results were obtained with the Takahashi et al. (2009)pCO2climatology and for comparison, we have also calculated the air–sea CO2fluxes using the re-analysed SOCAT v1.5 and v2.0 data (which were converted to clima-tologies using methodology described in Goddijn-Murphy et al., 2015). Figure 8 shows the results using the N2000
k parameterization for all three of the data sets (Takahashi et al., 2009 and both SOCAT versions). In the case of the North Atlantic Ocean study area, although the monthly val-ues show large differences (using both SOCAT data sets re-sults in a larger sink in summer and smaller in winter com-pare to Takahashi et al., 2009), the annual values are simi-lar:−0.38 Pg C for both Takahashi et al. (2009) and SOCAT v1.5 and−0.41 Pg C for SOCAT v2.0. In the case of the Eu-ropean Arctic, the situation is very different, with Takahashi et al. (2009) and SOCAT data set-derived climatologies re-sulting in inverse seasonal variability but with annual net air–sea CO2fluxes results that are similar:−0.102 Pg C for Takahashi et al. (2009),−0.085 Pg C for SOCAT v1.5, and −0.088 Pg C for SOCAT v2.0.
4 Discussion
Figure 7. Annual air–sea fluxes of CO2for the five (Eqs. 4–8) parameterizations as well as for backscatter (default) and wind-driven OceanFlux GHG parameterizations normalized to flux values of Nightingale et al. (2000)kparameterization (see text):(a)globally,(b)the North Atlantic,(c)the European Arctic, and(d)the Southern Ocean. Average values for all parameterization and standard deviations are marked as vertical grey lines.
the experimental uncertainty (Nightingale, 2015). The three parameterizations were derived using different methods and data from different regions, namely passive tracers and dual-trace experiments in the North Sea in the case of Nightin-gale et al. (2000), dual tracers in the Southern Ocean in the case of Ho et al. (2006), and global ocean14C inventories in the case of Wanninkhof (2014). The differences between the quadratic and cubic parameterization are large, and instead of the quadratic functions that are supported by several lines of evidence (see Garbe et al., 2014 for discussion), the cubic function are not completely refuted by the available observa-tion. Therefore, it is important to notice that a choice of one of the available cubic functions may lead to net air–sea CO2 fluxes that are considerably larger in absolute values, by up to 33 % in the North Atlantic Ocean and more than 50 % in the global ocean.
The above results imply smaller relative differences be-tween the parameterizations in the North Atlantic Ocean than in the global ocean. This is interesting because the North At-lantic is the region of strong winds and over most of its area there are no seasonal changes in the air–sea flux direction
func-Figure 8. Comparison of monthly air–sea CO2 fluxes calculated with differentpCO2data sets (Takahashi et al., 2009; SOCAT v1.5 and v2.0) using the same k parameterization (Nightingale et al., 2000);(a)the North Atlantic,(b)the European Arctic.
tions of wind speedU,F1(U )quadratic andF2(U )cubic:
F1(U )=aU2, (9)
F2(U )=bU3. (10) The difference between the two functions1F is equal to
1F =F2−F1=bU3−aU2
=bU2(U−ab−1)=bU2(U−Ux), (11)
whereUx=ab−1. The difference is positive for wind speeds
greater than Ux and negative for winds less than Ux.Ux is
the value of wind speed for which the two functions inter-sect. In the case of Eqs. (6) and (7), where a=0.251 and
b=0.0283, they imply thatUx=8.87 m s−1. In fact all of
the functions presented in Fig. 9 produce very similar values forUx, all of which are close to 9 m s−1. This value is very
close to average wind speed in the North Atlantic (Fig. 4). This is one of the reasons for the small relative difference in net air–sea fluxes. The spread of flux values for the Southern Ocean seems to support this conclusion, being larger than that in the North Atlantic. The Southern Ocean has on av-erage stronger winds than the North Atlantic (including also the Arctic seas), which seems to have the smallest spread of flux values for different parameterizations. The other reason
Figure 9.Differentk660 parameterizations as a function of wind speed.
of smaller relative differences between the parameterizations in the North Atlantic than in the global ocean is the lack of seasonal variation in the sign of the air–sea flux. In the case of seasonal changes in the air–sea flux direction (caused by sea-sonal changes in water temperature or primary productivity), with winds stronger thanUxin some seasons and weaker in
others (usually strong winds in winter and weak in summer), the fluxes partly cancel each other. The difference between cubic and quadratic parameterizations adds to each other due to simultaneous changes in the sign of both fluxes itself and theU−Ux term. This effect of seasonal variation has been
suggested to us based on available observations (A. Watson, University of Exeter, personal communication, 2015) but we are unaware of any paper investigating it or even describing it explicitly.
In addition to the five parameterizations described above, we calculated the air–sea fluxes using the OceanFlux GHG Evolution combined formula, which is based on knowledge that air–sea exchange is enhanced by air-entraining wave breaking and bubble-mediated transfer, especially for the less soluble gases than CO2. Goddijn-Murphy et al. (2016) as-sume a linear wind relationship for dimethyl sulphide (DMS) and an additional bubble-mediated term for less soluble gases, parameterized with whitecap coverage. The resulting air–sea fluxes are higher in absolute terms, than all of the quadratic functions considered in this study, and are closer in value to cubic parameterization. This may mean that the bubble-mediated term of Fangohr and Woolf (2007) is over-estimating the bubble component, implying the need for a dedicated calibration effort. This question will be the subject of further studies in the OceanFlux GHG Evolution project.
should be noted that a significant part of the data from Taka-hashi et al. (2009) are included in SOCAT; therefore, the dif-ferences in the European Arctic may be due to the sparse data coverage and possible interpolation artefacts (Goddijn-Murphy et al., 2015) or to processing of the data through the FluxEngine. A recent paper (Couldrey et al., 2016) using even more high latitude data than were available in the SO-CAT v1.5 and v2.0, which we used, shows a similar seasonal pattern to SOCAT. Still, this discrepancy makes us treat the net air–sea CO2fluxes results from the Arctic with much less confidence than the values for the whole North Atlantic. It is impossible to decide in this study which data set is more ac-curate as only new data can settle this. However, new data, not included in the SOCAT versions we used, have been available due to the recent analysis by Yasunaka et al. (2016). The observedpCO2data (Fig. 4 in Yasunaka et al., 2016), especially since 2005, have clearly shown an annual cycle compatible with the SOCAT seasonal flux variability.
5 Conclusions
In this paper we have studied the effect of the choice of gas-transfer velocity parameterization on the net CO2air–sea gas fluxes in the North Atlantic and the European Arctic us-ing the recently developed FluxEngine software. The results show that the uncertainty caused by the choice of thek for-mula is smaller in the North Atlantic and in the Arctic than it is globally. The difference in the annual net air–sea CO2 fluxes caused by the choice of the parameterization is 5 % in the North Atlantic and 4 % in the European Arctic, compared to 9 % globally for the studied functions with quadratic wind dependence. It is up to 46 % different for the North Atlantic, 36 % for the Arctic and 65 % globally when comparing cu-bic and quadratic functions. In both cases the uncertainty in the North Atlantic and the Arctic regions are smaller than the global case. We explain the smaller North Atlantic variabil-ity to be a combination of, first, higher than global average wind speeds in the North Atlantic, close to 9 m s−1, which is the wind speed at which mostkparameterization have sim-ilar values, and, second, the all-season CO2sink conditions in most North Atlantic areas. We repeated the analysis using Takahashi et al. (2009) and SOCAT pCO2-derived clima-tology and find that although the seasonal variability in the North Atlantic is different the annual net air–sea CO2fluxes are within 8 % in the North Atlantic and 19 % in the Euro-pean Arctic. The seasonal flux calculated from the twopCO2 data sets in the Arctic have inverse seasonal variations, indi-cating possible under sampling (aliasing) of thepCO2in this polar region and therefore highlighting the need to collect more polarpCO2observations in all months and seasons.
6 Data availability
Several relevant data sets have been collected from various sources for the OceanFlux project. They have been processed in order to provide consistent and homogeneous compos-ite files, on the same grid and temporal resolution, as well as multi-year climatologies. All these input and processed data sets are available in the OceanFlux FTP repository at ftp://eftp.ifremer.fr. Some of these data sets are at present re-stricted to project partners for reasons related to the original provider distribution policy. Therefore the access to the FTP site is protected: any user interested in the data sets should send a request to the CERSAT help desk (fpaf@infremer.fr) in order to get a login and password.
Acknowledgements. The publication has been financed from the funds of the Leading National Research Centre (KNOW) received by the Centre for Polar Studies for the period 2014–2018; OceanFlux Greenhouse Gases Evolution, a project funded by the European Space Agency, ESRIN contract no. 4000112091/14/I-LG; and GAME “Growing of Marine Arctic Ecosystem”, funded by Narodowe Centrum Nauki grant DEC-2012/04/A/NZ8/00661. We would also like to thank Jamie Shutler for important advice on the FluxEngine and for correcting the manuscript for English language. The authors are very grateful to those who have pro-duced and made freely available the LDEO Flux Climatology base, FluxEngine software funded by European Space Agency, Surface Ocean CO2 Atlas (SOCAT), GlobWave Project funded by European Space Agency, as well as Centre de Recherché et d’Exploitation Satellitaire (CERSAT) at IFREMER.
Edited by: M. Hoppema
Reviewed by: three anonymous referees
References
Couldrey, M. P., Oliver, K. I. C., Yool, A., Halloran, P. R., and Achterberg, E. P.: On which timescale do gas transfer veloc-ities control North Atlantic CO2flux variability?, Global Bio-geochem. Cy., 30, 787–802, doi:10.1002/2015GB005267, 2016. Fangohr, S. and Woolf, D. K.: Application of new parameteri-zations of gas transfer velocity and their impact on regional and global marine CO2budgets, J. Marine Syst., 66, 195–203, doi:10.1016/j.jmarsys.2006.01.012, 2007.
Garbe, C. S., Rutgersson, A., Boutin, J., de Leeuw, G., Delille, B., Fairall, C. W., Gruber, N., Hare, J., Ho, D. T., Johnson, M. T., Nightingale, P. D., Pettersson, H., Piskozub, J., Sahlée, E., Tsai, W., Ward, B., Woolf, D. K., and Zappa, C. J.: Transfer across the air-sea Interface, in: Ocean-atmosphere interactions of gases and particles, edited by: Liss, P. S. and Johnson, M. T., Earth Sys. Sci., Springer, Berlin, Heidelberg, 55–111, 2014.
Goddijn-Murphy, L., Woolf, D. K., and Callaghan, A. H.: Pa-rameterizations and algorithms for oceanic whitecap coverage, J. Phys. Oceanogr., 41, 742–756, doi:10.1175/2010JPO4533.1, 2011.
Goddijn-Murphy, L. M., Woolf, D. K., and Marandino, C.: Space-based retrievals of air-sea gas transfer velocities using altimeters: Calibration for dimethyl sulfide, J. Geophys. Res., 117, C08028, doi:10.1029/2011JC007535, 2012.
Goddijn-Murphy, L. M., Woolf, D. K., Land, P. E., Shutler, J. D., and Donlon, C.: The OceanFlux Greenhouse Gases methodol-ogy for deriving a sea surface climatolmethodol-ogy of CO2 fugacity in support of air-sea gas flux studies, Ocean Sci., 11, 519–541, doi:10.5194/os-11-519-2015, 2015.
Goddijn-Murphy, L., Woolf, D. K., Callaghan, A. H., Nightingale, P. D., and Shutler, J. D.: A reconciliation of empirical and mech-anistic models of the air-sea gas transfer velocity, J. Geophys. Res.-Oceans, 121, 818–835, doi:10.1002/2015JC011096, 2016. Dávila, M., Santana-Casiano, J. M., and
González-Dávila, E. F.: Interannual variability of the upper ocean carbon cycle in the northeast Atlantic Ocean, Geophys. Res. Lett., 34, L07608, doi:10.1029/2006GL028145, 2007.
Gregg, W. W., Casey, N. W., and Rosseaux, C. S.: Sensi-tivity of simulated global ocean carbon flux estimates to forcing by reanalysis products, Ocean Model., 80, 24–35, doi:10.1016/j.ocemod.2014.05.002, 2014.
Gruber, N.: Carbon cycle: Fickle trends in the ocean, Nature, 458, 155–156, doi:10.1038/458155a, 2009.
Halloran, P. R., Booth, B. B. B., Jones, C. D., Lambert, F. H., Mc-Neall, D. J., Totterdell, I. J., and Völker, C.: The mechanisms of North Atlantic CO2 uptake in a large Earth System Model ensemble, Biogeosciences, 12, 4497–4508, doi:10.5194/bg-12-4497-2015, 2015.
Ho, D. T., Law, C. S., Smith, M. J., Schlosser, P., Harvey, M., and Hill, P.: Measurements of air-sea gas exchange at high wind speeds in the Southern Ocean: Implications for global parameterizations, Geophys. Res. Lett., 33, 16611, doi:10.1029/2006GL026817, 2006.
Landschützer, P., Gruber, N., Bakker, D. C. E., Schuster, U., Nakaoka, S., Payne, M. R., Sasse, T. P., and Zeng, J.: A neu-ral network-based estimate of the seasonal to inter-annual vari-ability of the Atlantic Ocean carbon sink, Biogeosciences, 10, 7793–7815, doi:10.5194/bg-10-7793-2013, 2013.
Landschützer, P., Gruber, N., Bakker, D. C. E., and Schuster, U.: Recent variability of the global ocean carbon sink, Global Bio-geochem. Cy., 28, 927–949, doi:10.1002/2014GB004853, 2014. Le Quéré, C., Rödenbeck, C., Buitenhuis, E. T., Conway, T. J., Langenfelds, R., Gomez, A., Labuschagne, C., Ramonet, M., Nakazawa, T., Metzl, N., Gillett, N., and Heimann, M.: Satu-ration of the Southern Ocean CO2sink due to recent climate change, Science 316, 1735–1738, doi:10.1126/science.1136188, 2007.
Le Quéré, C., Moriarty, R., Andrew, R. M., Peters, G. P., Ciais, P., Friedlingstein, P., Jones, S. D., Sitch, S., Tans, P., Arneth, A., Boden, T. A., Bopp, L., Bozec, Y., Canadell, J. G., Chini, L. P., Chevallier, F., Cosca, C. E., Harris, I., Hoppema, M., Houghton, R. A., House, J. I., Jain, A. K., Johannessen, T., Kato, E., Keel-ing, R. F., Kitidis, V., Klein Goldewijk, K., Koven, C., Landa, C. S., Landschützer, P., Lenton, A., Lima, I. D., Marland, G., Mathis, J. T., Metzl, N., Nojiri, Y., Olsen, A., Ono, T., Peng, S., Peters, W., Pfeil, B., Poulter, B., Raupach, M. R., Regnier, P., Rö-denbeck, C., Saito, S., Salisbury, J. E., Schuster, U., Schwinger, J., Séférian, R., Segschneider, J., Steinhoff, T., Stocker, B. D., Sutton, A. J., Takahashi, T., Tilbrook, B., van der Werf, G. R., Viovy, N., Wang, Y.-P., Wanninkhof, R., Wiltshire, A., and Zeng, N.: Global carbon budget 2014, Earth Syst. Sci. Data, 7, 47–85, doi:10.5194/essd-7-47-2015, 2015.
Lefèvre, N., Watson, A. J., Olsen, A., Rios, A. F., Perez, F. F., and Johannessen, T.: A decrease in the sink for atmospheric CO2 in the North Atlantic, Geophys. Res. Lett., 31, L07306, doi:10.1029/2003GL018957, 2004.
McGillis, W. R. and Edson, J. B., Hare, J. E., Fairall, C. W.: Direct covariance air-sea CO2 fluxes, J. Geophys. Res., 106, 16729– 16745, 2001.
Merchant, C. M., Embury, O., Rayner, N. A., Berry, D. I., Cor-lett, G. K., Lean, K., Veal, K. L., Kent, E. C., Llewellyn-Jones, D. T., Remedios, J. J., and Saunders, R.: A 20 year in-dependent record of sea surface temperature for climate from Along-Track Scanning Radiometers, J. Geophys. Res., 117, C12, doi:10.1029/2012JC008400, 2012.
Nightingale, P. D., Malin, G., Law, C. S., Watson, A. J., Liss, P. S., Liddicoat, M. I., Boutin, J., and Upstill-Goddard, R. C.: In situ evaluation of air-sea gas exchange parameterizations using novel conservative and volatile tracers, Global Biogeochem. Cy., 14, 373–387, 2000.
Nightingale, P. D.: Relationship between wind speed and gas ex-change over the ocean: which parameterisation should I use? Re-port from Discussion Session at SOLAS Open Science confer-ence in Kiel, available at: http://goo.gl/TrMQkg (last access: 12 August 2016), 2015.
Orr, J. C., Maier-Reimer, E., Mikolajewicz, U., Monfray, P., Sarmiento, J. L., Toggweiler, J. R., Taylor, N. K., Palmer, J., Gru-ber, N., Sabine, C. L., Le Quéré, C., Key, R. M., and Boutin, J.: Estimates of anthropogenic carbon uptake from four three-dimensional global ocean models, Global Biogeochem. Cy., 15, 43–60, doi:10.1029/2000GB001273, 2001.
Pfeil, B., Olsen, A., Bakker, D. C. E., Hankin, S., Koyuk, H., Kozyr, A., Malczyk, J., Manke, A., Metzl, N., Sabine, C. L., Akl, J., Alin, S. R., Bates, N., Bellerby, R. G. J., Borges, A., Boutin, J., Brown, P. J., Cai, W.-J., Chavez, F. P., Chen, A., Cosca, C., Fassbender, A. J., Feely, R. A., González-Dávila, M., Goyet, C., Hales, B., Hardman-Mountford, N., Heinze, C., Hood, M., Hoppema, M., Hunt, C. W., Hydes, D., Ishii, M., Johannessen, T., Jones, S. D., Key, R. M., Körtzinger, A., Landschützer, P., Lauvset, S. K., Lefèvre, N., Lenton, A., Lourantou, A., Merlivat, L., Midorikawa, T., Mintrop, L., Miyazaki, C., Murata, A., Naka-date, A., Nakano, Y., Nakaoka, S., Nojiri, Y., Omar, A. M., Padin, X. A., Park, G.-H., Paterson, K., Perez, F. F., Pierrot, D., Poisson, A., Ríos, A. F., Santana-Casiano, J. M., Salisbury, J., Sarma, V. V. S. S., Schlitzer, R., Schneider, B., Schuster, U., Sieger, R., Skjel-van, I., Steinhoff, T., Suzuki, T., Takahashi, T., Tedesco, K., Tel-szewski, M., Thomas, H., Tilbrook, B., Tjiputra, J., Vandemark, D., Veness, T., Wanninkhof, R., Watson, A. J., Weiss, R., Wong, C. S., and Yoshikawa-Inoue, H.: A uniform, quality controlled Surface Ocean CO2 Atlas (SOCAT), Earth Syst. Sci. Data, 5, 125–143, doi:10.5194/essd-5-125-2013, 2013.
Sabine, C. L., Hankin, S., Koyuk, H., Bakker, D. C. E., Pfeil, B., Olsen, A., Metzl, N., Kozyr, A., Fassbender, A., Manke, A., Malczyk, J., Akl, J., Alin, S. R., Bellerby, R. G. J., Borges, A., Boutin, J., Brown, P. J., Cai, W.-J., Chavez, F. P., Chen, A., Cosca, C., Feely, R. A., González-Dávila, M., Goyet, C., Hardman-Mountford, N., Heinze, C., Hoppema, M., Hunt, C. W., Hydes, D., Ishii, M., Johannessen, T., Key, R. M., Körtzinger, A., Landschützer, P., Lauvset, S. K., Lefèvre, N., Lenton, A., Lourantou, A., Merlivat, L., Midorikawa, T., Mintrop, L., Miyazaki, C., Murata, A., Nakadate, A., Nakano, Y., Nakaoka, S., Nojiri, Y., Omar, A. M., Padin, X. A., Park, G.-H., Pater-son, K., Perez, F. F., Pierrot, D., PoisPater-son, A., Ríos, A. F., Sal-isbury, J., Santana-Casiano, J. M., Sarma, V. V. S. S., Schlitzer, R., Schneider, B., Schuster, U., Sieger, R., Skjelvan, I., Stein-hoff, T., Suzuki, T., Takahashi, T., Tedesco, K., Telszewski, M., Thomas, H., Tilbrook, B., Vandemark, D., Veness, T., Watson, A. J., Weiss, R., Wong, C. S., and Yoshikawa-Inoue, H.: Surface Ocean CO2Atlas (SOCAT) gridded data products, Earth Syst. Sci. Data, 5, 145–153, doi:10.5194/essd-5-145-2013, 2013. Schuster, U. and Watson, A. J.: A variable and decreasing sink for
atmospheric CO2in the North Atlantic, J. Geophys. Res., 112, C11006, doi:10.1029/2006JC003941, 2007.
Schuster, U., McKinley, G. A., Bates, N., Chevallier, F., Doney, S. C., Fay, A. R., González-Dávila, M., Gruber, N., Jones, S., Krijnen, J., Landschützer, P., Lefèvre, N., Manizza, M., Mathis, J., Metzl, N., Olsen, A., Rios, A. F., Rödenbeck, C., Santana-Casiano, J. M., Takahashi, T., Wanninkhof, R., and Watson, A. J.: An assessment of the Atlantic and Arctic sea-air CO2fluxes, 1990–2009, Biogeosciences, 10, 607–627, doi:10.5194/bg-10-607-2013, 2013.
Shutler, J. D., Piolle, J-F., Land, P. E., Woolf, D. K., Goddijn-Murphy, L., Paul, F., Girard-Ardhuin, F., Chapron, B., and Don-lon, C. J.: FluxEngine: a flexible processing system for calcu-lating air-sea carbon dioxide gas fluxes and climatologies, J. At-mos. Ocean. Technol., 33, 741–756, doi:10.1175/JTECH-D-14-00204.1, 2016.
Sweeney, C., Gloor, E., Jacobson, A. R., Key, R. M., McKinley, G., Sarmiento, J. L., and Wanninkhof, R.: Constraining global air-sea gas exchange for CO2with recent bomb 14C measurements,
Global Biogeochem. Cy., 21, doi:10.1029/2006GB002784, 2007.
Takahashi, T., Sutherland, S. C., Sweeney, C., Poisson, A., Metzl, N., Tilbrook, B., Bates, N., Wanninkhof, R., Feely, R. A., Sabine, C., Olafsson, J., and Nojiri, Y.: Global sea-air CO2flux based on climatological surface oceanpCO2, and seasonal biological and temperature effects, Deep-Sea Res. Pt. II, 49, 1601–1622, 2002. Takahashi, T., Sutherland, S. C., Wanninkhof, R., Sweeney, C., Feely, R. A., Chipman, D. W., Hales, B., Friederich, G., Chavez, F., Sabine, C., Watson, A., Bakker, D. C. E., Schuster, U., Metzl, N., Yoshikawa-Inoue, H., Ishii, M., Midorikawa, T., Nojiri, Y., Körtzinger, A., Steinhoff, T., Hoppema, M., Olafsson, J., Arnar-son, T. S., Tilbrook, B., Johannessen, T., Olsen, A., Bellerby, R., Wong, C. S., Delille, B., Bates, N. R., and de Baar, H. J. W.: Climatological mean and decadal change in surface oceanpCO2 and net sea-air CO2flux over the global oceans, Deep-Sea Res. Pt. II, 56, 554–577, doi:10.1016/j.dsr2.2008.12.009, 2009. Talley, L. D.: Closure of the global overturning circulation through
the Indian, Pacific, and Southern Oceans: schematics and trans-ports, Oceanography, 26, 80–97, doi:10.5670/oceanog.2013.07, 2013.
Thomas, H., Friederike Prowe, A. E., Lima, I. D., Doney, S. C., Wanninkhof, R., Greatbatch, R. J., Schuster, U., and Corbière, A.: Changes in the North Atlantic Oscillation influence CO2 up-take in the North Atlantic over the past 2 decades, Global Bio-geochem. Cy., 22, GB4027, doi:10.1029/2007GB003167, 2008. Wanninkhof, R.: Relationship between wind speed and gas ex-change over the ocean revisited, Limnol. Oceanogr.-Meth., 12, 351–362, doi:10.4319/lom.2014.12.351, 2014.
Wanninkhof, R. and McGillis, W. R.: A cubic relationship between air-sea CO2exchange and wind speed, Geophys. Res. Lett., 26, 1889–1892, 1999.
Wanninkhof, R., Park, G.-H., Takahashi, T., Sweeney, C., Feely, R., Nojiri, Y., Gruber, N., Doney, S. C., McKinley, G. A., Lenton, A., Le Quéré, C., Heinze, C., Schwinger, J., Graven, H., and Khatiwala, S.: Global ocean carbon uptake: magnitude, variabil-ity and trends, Biogeosciences, 10, 1983–2000, doi:10.5194/bg-10-1983-2013, 2013.
Watson, A. J., Schuster, U., Bakker, D. C. E., Bates, N. R., Corbière, A., González-Dávila, M., Friedrich, T., Hauck, J., Heinze, C., Johannessen, T., Körtzinger, A., Metzl, N., Olafs-son, J., Olsen, A., Oschlies, A., Padin, X. A., Pfeil, B., Santana-Casiano, J. M., Steinhoff, T., Telszewski, M., Rios, A. F., Wal-lace, D. W., and Wanninkhof, R.: Tracking the variable North Atlantic sink for atmospheric CO2, Science, 326, 1391–1393, doi:10.1126/science.1177394, 2009.
Watson, A. J., Metzl, N., and Schuster, U.: Monitoring and inter-preting the ocean uptake of atmospheric CO2, Philos. T. R. Soc. A, 369, 1997–2008, doi:10.1098/rsta.2011.0060, 2011. Woolf, D. K.: Parameterization of gas transfer velocities and
sea-state dependent wave breaking, Tellus B, 57, 87–94, 2005. Yasunaka, S., Murata, A., Watanabe, E., Chierici, M., Fransson, A.,