www.atmos-meas-tech.net/9/4977/2016/ doi:10.5194/amt-9-4977-2016
© Author(s) 2016. CC Attribution 3.0 License.
Cloud information content analysis of multi-angular measurements
in the oxygen A-band: application to 3MI and MSPI
Guillaume Merlin1, Jérôme Riedi1, Laurent C. Labonnote1, Céline Cornet1, Anthony B. Davis2, Phillipe Dubuisson1, Marine Desmons1, Nicolas Ferlay1, and Frédéric Parol1
1Laboratoire d’Optique Atmosphérique, Université de Lille 1, Sciences et Technologies, Villeneuve d’Ascq, France 2Jet Propulsion Laboratory, California Institute of Technology, Pasadena, CA, USA
Correspondence to:Jérôme Riedi ([email protected])
Received: 14 September 2015 – Published in Atmos. Meas. Tech. Discuss.: 4 December 2015 Revised: 30 July 2016 – Accepted: 3 August 2016 – Published: 11 October 2016
Abstract. Information content analyses on cloud top al-titude (CTOP) and geometrical thickness (CGT) from multi-angular A-band measurements in the case of mono-layer homogeneous clouds are conducted. In the frame-work of future multi-angular radiometer development, we compared the potential performances of the 3MI (Multi-viewing, Multi-channel and Multi-polarization Imaging) in-strument developed by EUMETSAT, which is an exten-sion of POLDER/PARASOL instrument and MSPI (Mul-tiangle SpectroPolarimetric Imager) developed by NASA’s Jet Propulsion Laboratory. Quantitative information content estimates were realized for thin, moderately opaque and opaque clouds for different surface albedo and viewing ge-ometry configurations. Analyses show that retrieval of CTOP is possible with a high accuracy in most of the cases inves-tigated. Retrieval of CGT is also possible for optically thick clouds above a black surface, at least when CGT >1–2 km and for thin clouds for CGT>2–3 km. However, for inter-mediate optical thicknesses (COT'4), we show that the re-trieval of CGT is not simultaneously possible with CTOP. A comparison between 3MI and MSPI shows a higher informa-tion content for MSPI’s measurements, traceable to a thinner filter inside the oxygen A-band, yielding higher signal-to-noise ratio for absorption estimation. Cases of cloud scenes above bright surfaces are more complex but it is shown that the retrieval of CTOP remains possible in almost all sit-uations while the information content on CGT appears to be insufficient in many cases, particularly for COT<4 and CGT<2–3 km.
1 Introduction
Clouds play an important role in the Earth radiation bud-get by modulating both the incoming and outgoing solar and thermal radiation that in turn directly act on the heating and cooling rates within the atmosphere. In particular, the cloud cover vertical distribution has a significant impact on a large number of meteorological and climatic processes. For exam-ple, Johansson et al. (2015) show that cloud vertical structure has a strong impact on the summer monsoon over the In-dian subcontinent. Furthermore, cloud vertical extent plays a crucial role in the radiative budget of the Earth (Ohring and Adler, 1978) and this effect is still poorly understood, especially for low clouds (L’Ecuyer et al., 2009). By influ-encing the distribution of heating within the atmosphere, it drives the cloud dynamics and evolution of clouds’ macro-and micro-structure. All climate feedbacks linked to clouds are still poorly known (Stocker et al., 2013) and a better un-derstanding of climate evolution has to go through a better description of the macrophysical cloud properties, such as cloud top and bottom altitudes.
In contrast, passive sensors allow for a larger coverage but, so far, the accuracy of retrieved cloud top altitude is lim-ited and the possibility of obtaining cloud geometrical thick-ness has yet to be consolidated (Ferlay et al., 2010; Desmons et al., 2013). Numerous techniques have been developed to retrieve cloud height from passive sensors. The CO2-slicing method uses CO2 differential absorption in the thermal in-frared spectral range (Rossow and Schiffer, 1991; King et al., 1992; Platnick et al., 2003). Ultraviolet radiances can also be used as rotational Raman scattering causes depletion or fill-ing of solar Fraunhofer lines in the UV spectrum, dependfill-ing on the Rayleigh scattering above the cloud (Joiner and Bhar-tia, 1995; de Beek et al., 2001). Similarly, the polarization of reflected light, at visible shorter wavelength, due to Rayleigh scattering carries information on cloud top height (Goloub et al., 1994; Knibbe et al., 2000). Finally, cloud top height can also be retrieved accurately thanks to geometrical meth-ods applied to stereo observations (Moroney et al., 2002; Seiz et al., 2007; Wu et al., 2009).
Information on cloud top location from passive instru-ments can also be obtained through the exploitation of dioxy-gen differential absorption of solar radiation in the A-band, as first suggested by Yamamoto and Wark (1961). Indeed, molecular oxygen is a well-mixed atmospheric gas and, con-sequently, the amount of absorption is linked to the pho-ton geometrical path length in the atmosphere, which is limited at a first order by the cloud top altitude. However, clouds are not solid (surface-like) reflectors. The additional absorption of radiation occurring along the path inside the cloud leads to significant biases and uncertainties in the re-trieved cloud-top pressure, as shown by Preusker and Lind-strot (2009). Some studies have shown, however, that this multiple-scattering effect can be used to obtain information on photon path lengths within the clouds, which in turn could provide information on cloud geometrical thickness (e.g. Davis et al. (2009); Asano et al. (1995); Kuji and Naka-jima (2002) and references therein). Depending on the in-strument characteristics in terms of spectral resolution and coverage and multi-angular capabilities, different methods have been proposed or applied. Rozanov and Kokhanovsky (2004) developed a retrieval technique exploiting hyperspec-tral A-band measurements from SCIAMACHY, thanks to a semi-analytical algorithm using asymptotic theory. Previ-ous information content analyses (Heidinger and Stephens, 2000; Schuessler et al., 2014) have explored the information content of high-resolution spectral measurements in the A-band (Heidinger and Stephens, 2000) and were applied to different sensors such as GOME and GOME-2 (Schuessler et al., 2014; Loyola et al., 2007). Our present study focuses on the O2 A-band information content arising from angle observations. Turning to narrowband bispectral multi-angular measurements in the A-band, Ferlay et al. (2010) suggested using the correlation between the angular stan-dard deviation of the cloud oxygen pressure and the cloud geometrical thickness. The feasibility of this technique was
later on confirmed by Desmons et al. (2013), who com-pared POLDER3/PARASOL retrievals of cloud geometri-cal thickness to information derived from collocated active sensors (CALIOP/CLOUDSAT). At the same time, a simi-lar approach proposed using the differential absorption oc-curring between single-view measurements in the O2A- and B-bands (Yang et al., 2013).
Our work aims to develop a comprehensive analysis of the information provided by multi-angle and bispectral mea-surements in the O2 A-band to derive the vertical location and extent of clouds (cloud top altitude and cloud geometri-cal thickness). Building on previous analyses by Ferlay et al. (2010) and Desmons et al. (2013), our present analysis aims to understand the feasibility of retrieving those parameters for all types of clouds (liquid/ice, thin/thick) and for a range of surface albedo values. But our study remains limited to ho-mogeneous single-layer clouds without aerosols. This inves-tigation is motivated by the need to develop physics-based al-gorithms that will be applied globally to measurements from a new generation of multi-angle sensors.
Several studies have demonstrated the great interest of combining multi-spectral, multi-angular and polarized mea-surements in the visible, near and shortwave infrared to bet-ter constrain retrievals of cloud microphysical (Bréon and Doutriaux-Boucher, 2005; Zhang et al., 2009; Riedi et al., 2010) and macrophysical (Ferlay et al., 2010; Desmons et al., 2013) properties. In this context, several missions that will fly a new generation of polarimetric multi-angular sensors that are currently being formulated. Here, we focus on the Multi-viewing, Multi-channel, Multi-polarization Imaging mission (3MI) on the EUMETSAT Polar System-Second genera-tion (EPS-SG) and the Multiangle SpectroPolarimetric Im-ager (MSPI) proposed, among others, for NASA’s Aerosol-Cloud-Ecosystem (ACE) mission.
2 Observation assumptions and simulations
The 3MI and MSPI sensors both combine multi-viewing, multi-wavelength measurements with polarization. Particu-larities of the two instrument characteristics are presented hereafter focusing primarily on their differences with respect to A-band measurements.
2.1 3MI characteristics
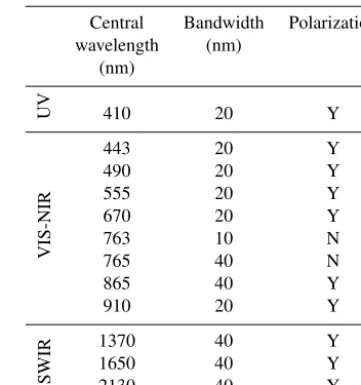
The Multi-viewing, Multi-Channel, Multi-Polarization Imaging mission (3MI) is planned as part of the future generation of EUMETSAT polar satellites, EPS-SG. 3MI has been designed to observe Earth reflectance in a wide spectral range (410–2130 nm) under up to 14 different viewing directions with polarimetric capabilities in 9 out of a total of 12 spectral channels. The 3MI concept largely leverages three previous Polarization and Directionality of the Earth’s Reflectances (POLDER) missions and some scientific limitations have been overcome by enhancing the instrument capabilities along all three dimensions. Specifically, the total spectral range has been extended to cover shorter (visible 410 nm) and longer (shortwave infrared) wavelengths (Table 1), the spatial resolution has been increased to 4 km×4 km at nadir and the swath of the instrument will provide complete daily coverage of the Earth from an EPS orbit.
Regarding the A-band sampling, in addition to the absorb-ing channel centred on the A-band at 763 nm (in band), 3MI is anticipated to provide measurements in a broader 40 nm-wide channel at 765 nm (broad-band) extending on both sides of the A-band similarly to what has been used for POLDER. As will be illustrated later on and following previous studies by Ramon et al. (2003), a narrow spectral channel at 754 nm (out-band) outside the A-band could provide higher infor-mation content when paired with the 763 nm channel. How-ever, the broader 765 nm channel appears more appropriate for 3MI in terms of instrument design and stability over the mission, particularly due to the need for vicarious calibra-tion of the 3MI. It remains that a 754 nm channel will also be available from the METImage instrument on EPS-SGm, pro-viding an opportunity for synergistic use with 3MI. There-fore, in addition to the anticipated 3MI baseline configura-tion (763/765 nm), we also studied the information provided by a potentially available 763/754 nm pair of measurements. These pairs of measurements are usually used in the form of ratios between the absorbing band in the A-band and a non-absorbing band with approximatively the same scattering properties. We will employ then the narrowband/broadband A-band ratio (Eq. 1) for the 763+765 nm configuration and in/out A-band ratio (Eq. 2) for the 763+754 nm configura-tion.
Rthin/broad=I763/I765 (1)
Rin/out=I763/I754 (2)
Table 1.Future 3MI spectral bands.
Central Bandwidth Polarization wavelength (nm)
(nm)
UV 410 20 Y
VIS-NIR
443 20 Y
490 20 Y
555 20 Y
670 20 Y
763 10 N
765 40 N
865 40 Y
910 20 Y
SWIR
1370 40 Y
1650 40 Y
2130 40 Y
2.2 MSPI characteristics
The Multiangle SpectroPolarimetric Imager, or MSPI, is a candidate for the multi-directional, multi-wavelength, high-accuracy polarization imager identified by the National Re-search Council’s Earth Sciences Decadal Survey as one com-ponent of the national Aerosol-Cloud-Ecosystem, or ACE, mission. NASA would fly the ACE spacecraft late in the next decade to characterize the role of aerosols in climate forcing, especially their impact on precipitation and cloud formation. MSPI is conceptually similar to JPL’s Multiangle Imaging SpectroRadiometer, or MISR, carried on NASA’s EOS Terra spacecraft, but with some important additions. The new cam-era design extends the spectral range to the ultraviolet and shortwave infrared (from 446–866 to 355–2130 nm), increas-ing the image swath (from 360 to 680 km) to achieve more rapid global coverage (from 4 to 9 days), and adds high-accuracy polarimetry in selected spectral bands. Like MISR, a suite of MSPI cameras would view Earth at a variety of angles with an intrinsic pixel size of a few hundred metres, which for certain channels would be averaged up to about 1 km.
2.3 Simulation assumptions
The use of observations in an absorption band, in essence, relies on the interpretation of average photon optical path length cumulated within the atmosphere, and especially above the cloud, when trying to retrieve cloud top pressure or altitude (denoted in the following as CTOP). This path length is estimated through differential absorption occurring between two channels in and around the O2A-band, provid-ing an estimate of the atmospheric transmission above cloud. Historically, the ratio of measurements in two nearby channels was used to estimate this atmospheric O2A-band transmission and two approaches have been used from past sensors to establish this ratio. The first one uses a ratio be-tween a radiance in the A-band and a radiance completely outside so that it is not affected at all by absorption but is close enough to consider other atmospheric and surface properties as constant. This configuration has been used successfully for instance with Medium Resolution Imag-ing Spectrometer (MERIS), although an accurate spectral calibration was identified as critical (Ramon et al., 2003). The other one uses a broader band covering the A-band (thin band/broadband) entirely, which again provides simi-lar atmospheric and surface properties in both channels. It presents the advantage of being less sensitive to calibration issues at the expenses of a lower signal to noise (because the broadband signal is partly affected by absorption; therefore it provides less contrast with respect to the absorption chan-nel). This configuration has been used for the three previous POLDER missions and proved to be a robust solution when instrument calibration relies solely on vicarious techniques.
Although the use of the 654 nm channel was initially envi-sioned for 3MI, the option consisting of the former POLDER 765 nm broad channel remains under consideration depend-ing on industrial feasibility and spectral stability that can be achieved for the proposed 754 nm channel. Therefore, in the present study we consider and compare both configurations. Similarly, the exact 3MI Instrument Spectral Response Func-tions (ISRFs) are not known yet, so we model the filters as perfect rectangular gates assuming thin and broad band-widths as currently specified for 3MI in the mission require-ment docurequire-ment. The in-band channel for MSPI is currently foreseen to be thinner than for 3MI with a spectral width of 6 nm and a central wavelength of 762 nm. For both 3MI and MSPI the exact location of the out-band channel is not fully determined yet, so we simply used a spectral location that is completely free of O2absorption.
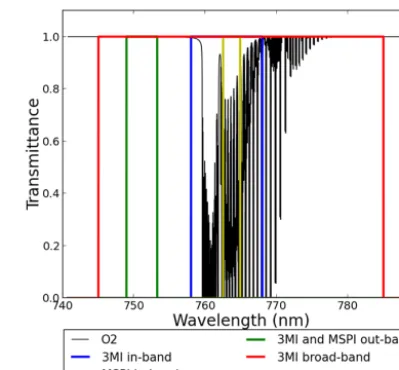
Based on candidate channels illustrated in Fig. 1, three possible configurations (in-band/out-band for MSPI and in-band/out-band or in-band/broad-band for 3MI) will be con-sidered in the following analysis to evaluate which one pro-vides the most information with respect to cloud top alti-tude (CTOP) and cloud geometrical thickness (CGT) param-eters.
Figure 1.3MI’s filter models. The O2transmittance is indicated by the black line. The green line represents the out-band filter (748.95– 753.25 nm), the red the broad-band (745–785 nm), the blue 3MI’s in- or thin band (758–768 nm), and the yellow line MSPI’s in-band (762.5–764.9 nm).
In this study, top-of-atmosphere (TOA) radiances are simulated using a radiative transfer code that accounts for gaseous absorption using a k-distribution technique (Kratz, 1995). Multiple-scattering effects are treated from the adding–doubling method (de Haan et al., 1987). In this approach, the radiative transfer equation is treated assum-ing a vertically inhomogeneous atmosphere (McClatchey model), stratified into plane and homogeneous layers and we only considered homogeneous single-layer clouds with-out aerosols. The O2absorption is accounted for in and out-side the cloud, including an interpolation of the O2 concen-tration when cloud base or cloud top altitude are between atmospheric levels.
Figure 2.Angular sampling from the choice of MSPI’s and 3MI’s view angles.
2.4 Angular configurations
To limit the number of angular configurations, we chose to use three different realistic angular samplings (AS) described in Fig. 2 and precomputed for 3MI based on EP-SG antic-ipated orbit. We made this choice to obtain representative observational configurations. Indeed, with a solar zenith an-gle of 30◦, for example, AS 3 corresponds to measurements in the backward scattering directions, AS 1 in the forward-scattering direction and AS 2 between them representative of along track sampling. The latter is also most representative of MSPI observation conditions due to its narrower swath compared to 3MI.
3 Sensitivity study of the A-band
We first present, in this part, a qualitative sensitivity study of TOA simulated radiances to cloud geometrical thick-ness (CGT) and cloud top altitude (CTOP). As 3MI and MSPI configurations are not fundamentally different, here
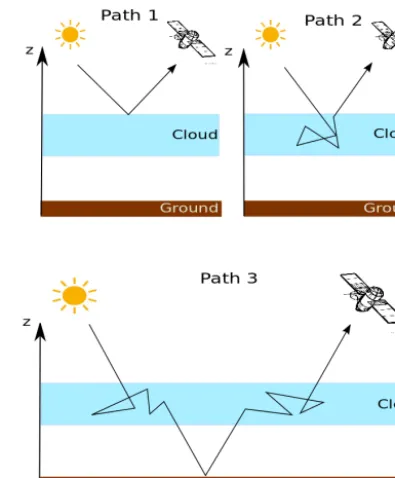
Figure 3. Basic pathways for a reflected photon through the atmosphere–surface system to reach the sensors. Molecular reflec-tion which is weak is not represented.
we only use the 3MI’s thin-in/thin-out configuration to illus-trate the main mechanisms, by which information on CTOP and CGT can be retrieved.
In addition to CGT and CTOP, the cloud optical thick-ness (COT) is also a key parameter. Indeed, previous studies shown that the A-band transmission is sensitive to it and pro-vide limited information on CTOP for optically thin clouds (Desmons et al., 2013; Ferlay et al., 2010; Yang et al., 2013; Schuessler et al., 2014). Therefore, we will illustrate our dis-cussion using three different cases of thin, moderately thin and thick clouds with optical thicknesses of 1, 4 and 16 re-spectively. The purpose of this first qualitative approach is to point out the main physical mechanisms that govern the O2A-band TOA signals. Following this, a quantitative study will be developed and presented in the next section.
3.1 Cloud top altitude and geometrical thickness sensitivity
The A-band observation sensitivity to CTOP and CGT de-rives from the absorption by dioxygen occurring respectively above and inside the cloud. Knowing the vertical distribution of dioxygen in the atmosphere, the evaluation of absorption gives an indication of the photon geometrical path above and inside the cloud and, consequently, of CTOP and CGT.
Path 1 represents photon reaching back from a scattering by the top layer of the cloud, path 2 from scattering inside the cloud and path 3 represents photons which have been re-flected by the surface and have gone back through the cloud. When clouds are optically thick, as little radiation crosses the entire cloud, path 3 can be neglected. This explains why previous studies have usually been limited to thick clouds (Rozanov and Kokhanovsky, 2004; Davis et al., 2009; Ferlay et al., 2010; Yang et al., 2013).
In a first step, we considered the surface to be black, which is a good approximation of measurements performed over the ocean. In this case, contribution from path 3 is null. To illus-trate the sensitivity of measurements to relevant parameters in a simple way, we represent the bands ratio for several top altitudes (CTOP) in Fig. 4 for three values of COT (1, 4, 16) varying against the air mass factor. They are defined as fol-lows:
mair= 1 cosθv
+ 1
cosθs
(3)
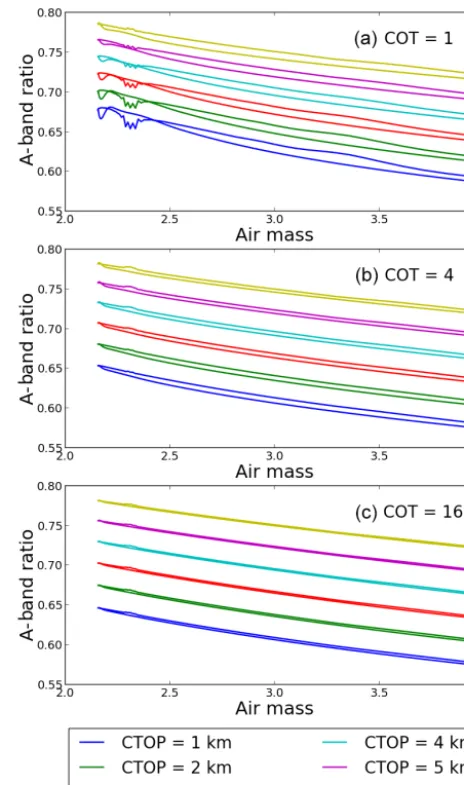
Figure 4 shows O2A-band ratio in the solar plane with a solar zenith angle of 30◦. The cloud geometrical thickness is fixed at 0.5 km; the cloud droplet size distribution is chosen to be log normal with an effective radius of 12 microns and an effective variance of 0.02. The different coloured curves represents different values of CTOP (from 1 to 6 km). For each air mass we obtain two values of the ratio: the upper part corresponds to the backward scattering direction and the lower part to the forward-scattering direction.
The two branches of the curves correspond to the forward-and backward-scattering halves of the principal plane. The latter shows a distinctive angular feature in the near-backward-scattering direction that is traceable to the phase function, which diminishes as COT increases. Evidently, the A-band ratio decreases generally as the air mass factor; hence the absorption increases. A variation of CTOP leads to a vari-ation of path 1 directly (Fig. 3). By increasing CTOP, the photon path length above the cloud is decreased. The ab-sorption of the in-band is thus reduced whereas the one of the out-band is not affected by absorption. Consequently, the ratio increases with CTOP, as can be seen in Fig. 4. We note that ratio change due to CTOP variation is almost the same for any angle so no angular signature of CTOP changes. In-deed, for optically thick clouds, the band ratio decreases lin-early with the air mass, which is the expected behavior when the cloud is assumed to be a solid reflector.
Figure 5 is the same as Fig. 4 but with a fixed cloud top altitude (6 km) and for varying geometrical thickness CGT (from 1 to 5 km). It corresponds to a variation of path 2 as the CTOP is constant and the surface black. The ratio decreases as CGT increases. Indeed, for a fixed CTOP and constant COT, an increase of CGT leads to a decrease of the extinc-tion within the cloud. It yields a deeper penetraextinc-tion and an enhanced mean free path of the photon and therefore an
in-Figure 4. Effect of cloud top altitude variation CTOP on the band ratio. CGT=0.5 km, SZA=30◦, VAA=0◦,(a)COT=1,(b)COT=4,(c)COT=16.
crease of absorption in the affected channel and a decrease of the ratio.
si-Figure 5.Effect of cloud geometrical thickness variation CGT on the band ratio. SZA=30◦, VAA=0◦, CTOP=6 km,(a)COT=1,
(b)COT=4,(c)COT=16.
multaneous retrieval of both CTOP and CGT. One way to address these issues could be in the information gained by the angular dependance of the reflectance ratio on CGT and CTOP, as already noted by Ferlay et al. (2010) for optically thick clouds. The average value of O2 A-band ratio is di-rectly linked to the mean photon path length which to a first order is determined by the cloud top altitude, hence the shift of the curves in Figs. 4 and 5 for the different CTOP values. In order to summarize the angular measurement variations, following Ferlay et al. (2010), who shows that the standard deviation of the oxygen pressure is linearly linked with the geometrical thickness, we use the standard deviation of the O2A-band ratio. Note that this metric does not retain all the information contained in the angular variation of the signal, but provides a useful qualitative link to previous studies by Ferlay et al. (2010). Physically, as will be discussed later on,
the angular variation of the signal is linked to varying photon penetration within the cloud which depends on cloud extinc-tion (or CGT as we consider COT as fixed and the cloud as homogeneous), air mass factor and details of the cloud par-ticle phase function (through primarily their asymmetry fac-tor). To first order, the larger photon penetration will result in a larger dependence on air mass factor, hence a larger stan-dard deviation of angular measurements.
For optically thick clouds (COT=16, Fig. 5c), the differ-ence between forward and backward scattering is lowered and is practically null for small geometrical depth as this cor-responds to the solid reflector situation already described in Fig. 4c.
For the other case with COT=4 (Fig. 5b), we notice op-tically thin cloud characteristics for large CGT (differences between forward and backward scattering) and thick clouds characteristics for low CGT. As will be discussed later, this actually reflects the transition from single-to-multiple-scattering regimes as the extinction within the cloud in-creases.
To illustrate the angular A-band ratio dependance on CTOP and CGT, Fig. 6 presents isolines of CTOP and CGT values in a two-dimensional space with average band ratio valueR, here along the ordinate axis, and the angular stan-dard deviation (σR) along the abscissa axis. Values are
ob-tained for the AS 1 (cf. Fig. 2) for 3MI’s 14 view angles using same cloud parameters as for Figs. 4 and 5. In practice, we represent here a solution space from which one could attempt to retrieve CTOP and CGT knowingRandσR. Figure 6a, b, c
show the solution space for COT of 1, 4 and 16 respectively. In Fig. 6a (COT=1), we notice that the curves of constant CTOP (red curves) and CGT (black curves) are well sepa-rated. The curves of constant CGT are almost vertical, which means that CTOP is primarily sensitive toRand less depen-dent onσR. Indeed, as explained before, CTOP variations
imply a change of molecular absorption above the cloud, which acts principally on the A-band ratio average (Fig. 4). Conversely, constant CTOP curves are almost horizontal tra-ducing the fact that CGT is mostly sensitive toσRonly. The
modification of CGT for constant optical thickness produces a change of extinction inside the cloud and of the penetra-tion depth, which causes a stronger angular dependence as the photon path length in the cloud depends on the view di-rection (Fig. 5). Even though the solution space is not orthog-onal, this figure shows howRandσRcould be used to infer
both CTOP and CGT. For optically thick clouds (Fig. 6c), the ratio is again sensitive to both parameters but it is im-portant to note that, contrary to small COT, increasing CGT here leads to smallerσR. We can relate this observation to
Fig. 5c, in which the slope of A-band ratio decreases with CGT, thereby reducing its angular standard deviation. On the contrary, for optically thin clouds and in Fig. 5a, the slope increases when CGT increases (at least for low air mass). This inverse sensitivity ofσRimplies that, between the cases
Figure 6.Look-up tables for different cloud top height CTOP and cloud optical thickness CGT, simultaneously of average and angular standard deviation of the 3MI’s A-band ratio. In red, CTOP values and in black, CGT values:(a)COT=1,(b)COT=4,(c)COT=16.
sensitive to the standard deviation. At this intermediate opti-cal depth, almost no radiation crosses the cloud completely, as it would for COT=1, but the signal is neither saturated by multiple scattering as is the case for COT=4. Conse-quently, the A-band ratio varies with both COT and CGT in almost the same way at every angle leading to no varia-tion of the standard deviavaria-tion. That is confirmed by Fig. 6b (COT=4) where both parameters are sensitive primarily to
R and the solution space collapses along theσR axis. This
correlation between the sensitivities make it impossible to infer both parameters from the reduced set ofRandσR
met-rics. This second qualitative analysis again illustrates how multi-angle A-band ratio measurements above a black sur-face can potentially convey information on both CTOP and CGT for optically thick clouds, as was already noticed by Ferlay et al. (2010), but also for thin clouds. Between these two cases, however, the reduced set of metrics based on A-band differential absorption measurement does not seem to allow simultaneous retrieval of CTOP and CGT.
3.2 Addition of a Lambertian surface
A black surface is a good approximation of the ocean out of the sun glint area. However, for retrievals over land sur-faces, we need to extend our model and analysis to include more realistic surface reflectance. To focus on the physical understanding of mechanisms contributing to the band ratio signal, we choose to simulate the surface by using a simple Lambertian model with two very different albedo values: 0.2 (corresponding approximatively to sand) and 0.8 (fresh snow or ice), thus activating path 3 in Fig. 3.
Figure 7 is the same as Fig. 4 with a surface albedo of 0.2. For COT=16, the cloud opacity is such that the im-pact of the surface is negligible. For COT=1 and 4, differ-ences are notable. The ratios are weaker. Because of surface brightness, the probability of longer path length increases, further attenuating radiation in absorbing channels. Indeed, the non-absorbing spectral bands present higher reflectance thanks to the reflection, which can be multiple, between the surface and the cloud. Such reflection for the absorbing band also occurs but the increased absorption limits their contribu-tion to observed TOA reflectance. By adding a bright surface, the out-band radiance increases more than the in-band one, thereby the A-band ratio is reduced. This effect is more im-portant for high cloud top altitudes and low air mass. Indeed, the higher the cloud, the more the photon pathway between the surface and the cloud increases. The difference between in- and out-band, therefore, increases and the band ratio de-creases. For COT=1 and low air mass, it logically appears that the sensitivity to CTOP is extremely low as the cloud does not significantly modify the photon pathway.
Figure 7.Same as Fig. 4 with a surface albedo of 0.2.(a)COT=1,
(b)COT=4,(c)COT=16.
Figure 9 is the same as Figs. 4 and 7 and Fig. 10 as Figs. 5 and 8 with a surface albedo of 0.8. With a brighter surface, the effect of the surface is obviously more apparent. For COT=1, the cloud altitude and thickness have almost no impact on the A-band ratio because the radiance coming from the cloud represents a negligible part of the signal. For COT=16, the cloud signal is higher; consequently, the ratio is modified depending on CTOP and CGT.
To summarize, a Lambertian surface decreases A-band sensitivities on both CTOP and CGT for the smallest COT, the COT limit depending on the surface albedo.
4 Theoretical information content study
In order to go further with the sensitivity studies on the O2 A-band, we performed an information content study based on a Bayesian optimal estimation approach. It also provides
Figure 8.Same as Fig. 5 with a surface albedo of 0.2.(a)COT=1,
(b)COT=4,(c)COT=16.
an elegant framework to compute the information content of the observing system as well as to perform an error analysis on the resulting retrieval. The formulation of the problem in this study has been developed by Rodgers (1998) and used in previous studies by several authors (Sourdeval et al., 2013, 2014; King and Vaughan, 2012; Cooper et al., 2006).
4.1 Information content theory
Details on how the information content is calculated can be found in the aforementioned studies and, for the sake of com-pleteness, the main theoretical elements are reported in Ap-pendix A. In this section, we simply describe and specify the different parameters used in the Rodgers information content formulation.
Figure 9. Same as Figs. 4 and 7 with a surface albedo of 0.8.(a)COT=1,(b)COT=4,(c)COT=16.
for the different view angles described in Fig. 2. As for non-retrieved parameters, we considered only COT, the effective radius of the cloud particles and the surface albedo. Preusker and Lindstrot (2009) showed that those parameters are in-deed the geophysical quantities that most influence the mea-sured A-band ratio.
The only information we have a priori is that cloud top al-titude CTOP cannot be very high and cloud thickness CGT cannot exceed CTOP. Consequently, we considered an a pri-ori standard deviation of 5 km for both CGT and CTOP for both liquid and ice clouds. The a priori variance–covariance matrixSa is assumed diagonal and elements are those
vari-ances (Sa,ii=52,i=1,2). This represents our knowledge
of the state vector before the measurements and retrievals are performed. Those a priori (co)variance values do not have a strong impact on the information content as they are chosen to be very large compared to the a posteriori variances (Sx).
Figure 10. Same as Figs. 5 and 8 with a surface albedo of 0.8.(a)COT=1,(b)COT=4,(c)COT=16.
Measurement noise is assumed to be 1 % of the ratio for both MSPI and 3MI. Indeed, the ratio method leads to a smaller noise, which is typically considered to be of the order of 2–3 % for the radiances themselves. The uncertainty used for the band ratio is smaller than the uncertainty for individ-ual channels because the calibration of the two channels can be performed directly by relating their ratio to the apparent surface pressure, which is considered to provide higher ac-curacy than what can be achieved for absolute calibration of single-channel measurements (Fougnie, 2016). We use this measurement noise estimate to compute a diagonal variance– covariance matrix as
Sy,ii=
0.01× Radin,i
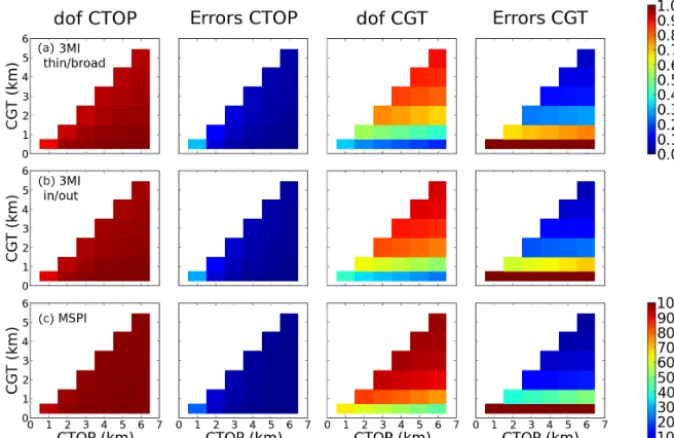
Figure 11.3MI/MSPI information content comparison. Partial DOFs and a posteriori errors of the A-band of(a)3MI with the configuration using thin band on broadband,(b)3MI with the in-band on out-band method and(c)MSPI, using the in-band on out-band method with a different filter and 9 view angles instead of 14 for 3MI. COT=16,reff=12 µm,veff=0.02, SZA=30◦, orbit/AS 1.
for the ith angular measurement, where subscript “out” means either the continuum channel (MSPI or 3MI) or 3MI’s broadband channel.
We introduce also a variance–covariance matrix for the forward model, linked to the non-retrieved parameters. Those parameters are fixed and assumed known but only to within a known uncertainty. We considered 10 % relative errors on COT and the effective particle radius and an absolute error of 0.05 on the surface albedo.
4.2 Intercomparison of 3MI and MSPI – measurement information content
We use the formalism in Appendix A to study the informa-tion content of the three different O2A-band measurement configurations described in Sect. 2.3 and perform an inter-comparison for a reference case. The reference case is a ho-mogeneous liquid cloud with an optical thickness of 16, with droplets following a log-normal distribution with an effec-tive radius of 12 µm and an effeceffec-tive variance of 0.02. The surface is assumed black, SZA is fixed at 30◦, and we use the angular sampling configuration AS 1 (cf. Fig. 2). We describe and compare the A-band information content provided by the three instrumental configurations by analysing the partial de-grees of freedom and the a posteriori errors (square roots of the diagonal elements of the a posteriori variance–covariance matrixSy, as described in Appendix A).
Figure 11 presents an example of the information content of the A-band observations obtained from the three instru-mental configurations. In this figure, we have plotted the
de-grees of freedom (DOFs) and the a posteriori errors in the state space: CGT on the vertical axis for six values rang-ing from 0.5 to 5 km and CTOP on the horizontal axis for six values ranging from 1 to 6 km. We note that, logically, the higher the information content, the lower the a posteri-ori errors. We also notice some general similarities between the three configurations. The A-band information on CTOP increases when it increases and CGT decreases. It is the re-verse for the information content on CGT that increases with a decrease of CTOP and an increase of CGT. Indeed, when the information on the more sensitive parameter (CTOP) de-creases, a part of the lost information is reported to the other parameter (CGT). For the cases with small CGT, there is low information content, showing us that the retrieval of this pa-rameter is not reliable (i.e. DOF<0.5).
Comparison of Fig. 11a, b and c (the three rows) shows that information content of 3MI (thin band/broadband) is lower than 3MI (in-band/out-band) that is in turn lower than MSPI. The in/out-band configuration is thus more effective than the thin band/broadband one. Even if MSPI has fewer view angles than 3MI, it provides higher information. We can therefore conclude that MSPI’s spectral channel definitions are more suitable than those of 3MI for the current applica-tion.
Figure 12.Relation between the DOFs and the a posteriori errors on CTOP (left) and on CGT (right).
In the following, we will therefore only consider the DOFs. Moreover, respective performances and differences between those spectral configurations are fairly invariant for the cases studied. For analysis of multi-angle observation, we therefore only present and discuss results for 3MI thin/broad configu-ration. This provides a baseline evaluation of the (minimum) available information from multi-angle O2A-band measure-ments, knowing this could be improved through adjustment of the spectral channel definition (position and bandwidth).
At this stage, it should be noted though that the impact of spectral configuration in terms of information content re-mains smaller than the additional information provided by multi-angular measurements when compared to single-view observations. To illustrate this, we have studied the infor-mation available from mono-angular vs. multi-angular A-band ratio measurements which are illustrated by Fig. 13. Unlike other examples, we choose here to use MSPI’s A-band ratio for this comparison to illustrate what can actually be achieved from single-view measurements in a favourable case where spectral configuration is optimized. Here the mono-view scenario is nadir-looking (0◦ zenith angle) and the multi-view assumption is the same as the case illustrated by Fig. 11. Figure 13a shows the information content on CTOP and CGT from mono-angular measurement. In this case, the information on CTOP is high but the A-band ratio does not bring information on CGT. As expected, retriev-ing two parameters with only one measurement is simply not possible, and this is clearly reflected by the result. But the retrieval of CTOP appears indeed possible without any knowledge of CGT, as already noticed by Preusker and Lind-strot (2009). Even so, the information on CTOP is lower than MSPI’s multi-angular measurements (Fig. 11).
In a second step, we evaluated whether information could be obtained for CGT if a priori knowledge is used for CTOP. For this purpose, we decreased the a priori variance on CTOP to 0.5 km, corresponding approximately to the accuracy of a retrieval using the CO2-slicing method (Platnick et al., 2003). By doing this, we determine the information content brought by the A-band ratio on CGT, knowing CTOP with such ac-curacy. Figure 13b represents this information content for mono-angular measurement and Fig. 13c for MSPI’s multi-angular measurements. The results clearly illustrate that in-formation content of mono-angular A-band ratio on CGT is
Figure 13.Comparison between mono- and multi-angular A-band ratio with MSPI’s configuration:(a) mono-angular A-band ratio DOF (VZA=0◦, nadir), (b) same as (a) with a reduced a pri-ori standard deviation on CTOP (0.5 km) and(c)same as(b)for multi-angular measurements (orbit/AS 1). COT=16,reff=12 µm, veff=0.02, SZA=30◦.
comparable (though still smaller) to what is available from MSPI, pending the fact that sufficient a priori knowledge is available on CTOP. We also notice that the A-band ratio brings some limited additional information to CTOP for low CGT and high CTOP. It means that A-band ratio is able to reduce the a priori volume even if this one is already small. Again, and as already discussed by Preusker and Lindstrot (2009), these results simply illustrate that mono-angular A-band measurements can be used to retrieve CTOP without knowledge of CGT. When a priori knowledge on CTOP is provided, CGT could potentially be retrieved from single-view observation.
Figure 14.Information content of 3MI A-band for different COTs:
(a)COT=1,(b)COT=4,(c)COT=16. Partial DOFs for CTOP (left) and CGT (right).
4.3 Cloud optical thickness variation
The effect of the optical thickness on measurement sensibil-ities were examined previously. Here, we study it in terms of information content in order to take into account the measurement noise and uncertainty in non-retrieved parame-ters (COT and effective radius, the surface being considered black in this case).
Figure 14 shows information content of 3MI A-band ra-tio for the reference case as well as for several other opti-cal thicknesses (same ones as in Sect. 3). The information content is, for optically thick (COT=16) or thin (COT=1) clouds, pretty close and significantly higher than for the in-termediate optical thickness (COT=4). This confirms the finding in Fig. 6, where the LUT representation shows that retrieval of both CGT and CTOP is not feasible for inter-mediate COT because they are both sensitive to the mean of A-band ratio. The joint retrieval should, however, be possi-ble for optically thin and thick clouds; the propossi-blem is to de-termine the limit between those cases as it could depend on cloud microphysics and/or illumination and viewing geome-try.
4.4 Impact of cloud microphysics
To evaluate whether cloud microphysics could have an im-pact on available information content, we studied DOFs for different assumptions on the droplet effective radius, and no significant effects on the information content on CGT and CTOP were noticed (not shown). This is not surprising since the asymmetry factorgis the relevant optical parameter that
Figure 15.Information content of 3MI A-band with a COT of 16 for different asymmetry factors:(a)g=0.5,(b)g=0.7,(c)g=0.9. Partial DOFs for CTOP (left) and CGT (right).
links cloud microphysics to photon penetration within the cloud (Davis et al., 2009) and, for liquid droplets at least, it does not vary much at the A-band wavelength for the range of potential droplet sizes.
Figure 16. Information content of 3MI A-band for ice clouds (IHM model) for different COTs: (a) COT=1, (b) COT=4,
(c)COT=16. Partial DOFs for CTOP (left) and CGT (right).
three COT presented in this figure even if it decreases a lit-tle when COT decreases. As for liquid clouds (Fig. 14), the DOFs on CTOP increase with CTOP and decrease with CGT. Concerning CGT, the information on CGT is very high for COT=16 and for CGT larger than 2 km. It is consistent with liquid clouds results but, for ice cloud, the DOF decreases with COT and there is no more information on CGT for COT=1. The retrieval of CTOP seems then to be possible for all COT for ice clouds. For CGT, it is not possible for low COT (=1) and for CGT smaller than 2 km.
Therefore the results of the information content presented in this paper can be confidently extended to different types of clouds such as ice clouds (at least for high optical thick-nesses).
4.5 Variations in solar and viewing geometry
The viewing geometry resulting from angular sampling (AS) could be another important parameter. To restrict the number of angular configurations, we chose three different AS pre-computed for 3MI orbits, as described in Fig. 2. We made the choice to obtain representative observational configurations. Indeed, with a SZA of 30◦, AS/orbit 3 corresponds to mea-surements in the backward-scattering direction, AS/orbit 1 in the forward scattering direction and AS 2 between them. Figure 17 shows the results of information content for these geometries applied to the reference case. The information content provided by these three configurations is very sim-ilar. We only notice slightly less information for AS/orbit 2 and 3 that might be due to a smaller contribution of the
mul-Figure 17.Information content of 3MI A-band with a COT of 16 for different orbits, hence the following angular samplings:(a)AS 1,
(b)AS 2,(c)AS 3. Partial DOFs for CTOP (left) and CGT (right).
tiple scattering, hence reduced penetration of sunlight and photon path length into the cloud mass.
To gauge the effect of the SZA, we performed the same study but for two alternate settings, 0 and 60◦, with the an-gular configuration in AS 1; see Fig. 18. As previously, the outcomes of cases SZA=30 and 60◦ are quite close, and SZA=0◦gives a little less information. This configuration corresponds to the closest configuration of the backward-scattering directions (see AS 3 in Fig. 17). This confirms that the information is somewhat weaker in the backward-scattering direction.
4.6 Addition of a Lambertian surface with varying albedo
Figure 18. Information content of 3MI A-band with a COT of 16 for different illumination angles:(a)SZA=0◦,(b)SZA=30◦,
(c)SZA=60◦. Partial DOFs for CTOP (left) and CGT (right).
the forward model errors, information on CGT will become very low and the retrieval of CGT impossible for low values of COT. Figure 20 presents the information content for the same cases but with a surface albedo of 0.8, representative of fresh snow or ice. As before, information for COT=1 be-comes too low. However, in comparison with Fig. 19, and contrary to what we expected looking at Fig. 9, the high information content for optically thick clouds (COT=16, Fig. 20c) is not dramatically affected by such bright sur-faces. For COT=4, the information on CGT interestingly increases compared to a black surface where both CGT and CTOP were sensitive to the average ratio, but not the stan-dard deviation (cf. Fig. 6). We attribute this increase in sensi-tivity to cloud properties to the fact that clouds of intermedi-ate optical depth are highly transmissive in diffuse light, and much of this transmitted light is retransmitted by the cloud after surface reflection, accumulating more path length in the dioxygen.
For bright surfaces, Figs. 9 and 10 show that CTOP is rather sensitive to the angular standard deviation and CGT rather to the mean of the A-band ratio. We have thus inde-pendent information on CTOP and CGT. For optically thin clouds (COT=1), for some cases of CTOP and CGT, the in-formation is higher and for some others it is lower than less bright surfaces. This case is very non-linear due to multiple reflections between surface and cloud. The A-band ratio will depend strongly on surface albedo, COT and absorption be-low the cloud which depends on the cloud base altitude. We can also notice that information on CGT is not sufficient in most cases, contrary to CTOP.
Figure 19.Same as Fig. 14 with an albedo of 0.2.
Figure 20.Same as Figs. 14 and 19 with an albedo of 0.8. There is an interesting increase in information content for the moderately opaque (COT=4) clouds when they are relatively thick, e.g. CGT ≥max{2,CTOP-2}km.
radiation is sufficient to impact the total signal, informa-tion only on cloud top altitude can be retrieved even above a bright surface. However, this finding should be mitigated by the fact that we assume that the cloud optical thickness is known within 10 % accuracy, which might be difficult to achieve over very bright surfaces. This is also the case for CGT along with CTOP for optically thick clouds. For opti-cally thin clouds, on the other hand, retrieving CGT seems to remain challenging using the anticipated 3MI spectral con-figuration.
5 Conclusions
The main goal of the present work has been to study the O2A-band in terms of information content for multi-angular two-channel measurements provided by different future in-struments, specifically 3MI and MSPI. Although earlier stud-ies already revealed the sensitivity of the A-band to the cloud top altitude and geometrical thickness, they did not always account for measurement noise and errors due to uncertain-ties in the non-retrieved parameters and were limited to thick clouds above black surfaces. In this study, we consider opti-cally thick clouds as well as optiopti-cally intermediate and thin clouds. In addition, we look at the information content above Lambertian surfaces with moderate and high albedo. The main results are as follows.
1. MSPI’s configuration seems to be more appropriate and the use of an external non-absorbing band seems more efficient than a broad spectral channel covering the A-band and some neighbouring continuum wavelengths. 2. Information on CTOP is high in almost all studied cases
and this parameter seems to be retrievable using an op-timal estimation scheme.
3. The retrieval of CGT seems to pose problems in some cases. Over a black surface, information could be too low for CGT smaller than 1–2 km. Over a brighter sur-face, this information is decreased for most of cases, but not for optically thick clouds.
Interestingly, sensitivity to CGT increases for relatively thick
(CGT&max{2,CTOP-2}km) clouds of intermediate optical
thickness (COT≈4) when they occur over the brightest sur-faces, due to the extra path length cumulated in the cloud after surface reflection.
This study shows the possibility of retrieving cloud top and cloud geometrical thickness. However, in order to develop an operational algorithm, precautions should be taken in case of heterogeneous cloud or when aerosols lay above clouds
as both will modify the photon path length, hence modify-ing the absorption of the radiation. This study is restricted to homogeneous plane-parallel clouds, but cloud inhomogene-ity and three-dimensional effects are known to modify sig-nificantly the multi-angular measurement but also the pho-ton path length. We have shown that the angular distribu-tion of observed O2A-band absorption carries information on cloud geometrical thickness. Though the absolute values of radiances are known to be directly impacted by three-dimensional effects, it remains to be established to what ex-tent this modifies the relative angular distribution of observed O2 A-band absorption as derived from two-band ratios. In this respect, future studies will investigate cases of heteroge-neous cloud covers in order to estimate the effects of cloud inhomogeneity on the information content evaluated here as well as the implications on the retrieval of both cloud top height and geometrical thickness.
This study aimed to determine the capabilities of multi-angle A-band measurements, but other spectral regions could be useful to retrieve CTOP and CGT. For instance, polarized radiances in the deep blue are sensitive to CTOP (Goloub et al., 1994). It shall be noted that other planned or already launched missions carrying sensors that provide measure-ments in the O2 A- and B-bands could still benefit from our analysis. As an example, we can take the Japanese Sec-ond Generation Global Imager of the Global Change Obser-vation Mission – Climate (SGLI/GCOM-C) and the Earth Polychromatic Imaging Camera on the DSCOVR spacecraft (EPIC/DSCOVR) that observes the sunlit Earth from the La-grange “L1” point. Additionally, but outside the of scope of the present study, A-band measurements at high spectral res-olution from OCO-2 or GOSAT, even at a single-view angle, could also be used to retrieve similar cloud information with the additional limitation of coarse spatial resolution leading to larger uncertainties in the forward model.
6 Data availability
Appendix A: The optimal estimation approach to information content analysis
In the Rodgers (2000) formalism for the optimal estimation of model parameters from observations, measurements are represented by the “data” m-vector y (in this study con-taining the multi-angle suite of A-band ratios, e.g. m=9 and 15 for MSPI and 3MI) and the retrieved parameters are contained in the “state” n-vector x (here containing CTOP and CGT, i.e.n=2). The corresponding information content theory uses Gaussian probability functions (PDFs) to relate, through Bayes’ theorem, the measurement space and the state space. Since the PDFs are assumed to follow multi-variate Gaussian distributions, they are defined by their means and variance–covariance matrices:
– Safor the PDF of the a priori state vector representing
our “knowledge” of the state vector before any measure-ments are made;
– Sxfor the PDF of the a posteriori state vector
represent-ing our ”knowledge” of the state vector accountrepresent-ing for the measurements;
– S represents the variance–covariance matrix of the
measurement and the forward model errors.
We first need to define the forward model variance– covariance matrix, particularly the errors, due to the non-retrieved parameters we use in the forward model. Sb will
be the variance–covariance matrix of those non-retrieved pa-rameters (assumed diagonal). The variance–covariance ma-trix associated to the model errorsSf is therefore computed
as
Sf =KbSbKTb, (A1)
withKbbeing the Jacobian of the non-retrieved parameters,
which represents the sensitivity of the forward model to those non-retrieved parameters, and superscript “T” meaning trans-pose.
We can then compute the variance–covariance matrixS
of the measurements and forward model errors,SyandSf:
S=Sy+Sf. (A2)
The a posteriori variance–covariance matrixSx, with the
di-agonal elements representing the uncertainties on the best re-trieval, is expressed as
Sx=
S−1a +KTS−1 K−1. (A3)
The termKrepresents the kernel (or Jacobian) matrix, which describes the sensitivity of the forward model to each param-eter to be retrieved. A posteriori retrieval errors for the ith parameter are
σi = p
Sx,ii. (A4)
The notion of information content was introduced by Shannon (1948). They developed this theory by establishing an analogy between the information carried by a signal and the entropy of its PDF. Later, Rodgers (2000) applied this idea to his formalism. He defined the information contentHs
as the difference between the a priori and a posteriori en-tropies of the respective Gaussian PDFs defined by the ma-tricesSaandSx:
Hs=
1 2log2
kSxS−1a k
. (A5)
Hs thus quantifies the reduction of the number of possible
states from the a priori state space to the best-estimate a pos-teriori state space. Rodgers describes another way of quan-tifying this volume reduction, by using the averaging kernel matrix:
A=∂xˆ
∂x, (A6)
withxˆ representing the best estimate of the state vector and x the true state vector.Ais therefore the sensitivity of the retrieval to the true state. It is a simple function of the a priori and a posteriori volumes:
A=In−SxS−1a , (A7)
where In is the n×n identity matrix. From
Eqs. (A5) and (A7), we can express the information contentHs as follows:
Hs=
1
2log2(kIn−Ak) . (A8)
We can also express the total number of degrees of free-domds as a function of the averaging kernel matrix. The
de-gree of freedom is a measure of the number of independent pieces of information contained in the observing system. It is expressed as
ds=Tr(A). (A9)
Note that its maximum value is equal to the dimensionnof the state vector. We can also get the partial degree of freedom of theith parameter attached to each element of the state vector ofx:
ds,i=Aii. (A10)
It represents the information brought by the measurements for the parameterxi(i=1, . . ., n).
This partial degree of freedom is a very practical tool for quantifying information content. Indeed,ds,i lies between 0
and 1, with a low value representing a low information and conversely when it approaches unity. Partial degree of free-dom is therefore what we use throughout our study, with the a posteriori variance–covariance matrixSx in Eq. (A3), to
Acknowledgements. The authors are grateful for financial support from CNES as well as NASA’s SMD/ESD (several programmes managed by H. Maring, K. Jucks and R. Eckman). They also thank Dave Diner, Jay Herman and Yuequi Yang for fruitful discussions. Guillaume Merlin is supported by a PhD grad from CNES and Région Nord-Pas de Calais.
Edited by: B. Kahn
Reviewed by: three anonymous referees
References
Asano, S., Shiobara, M., and Uchiyama, A.: Estimation of cloud physical parameters from airborne solar spectral reflectance mea-surements for stratocumulus clouds, J. Atmos. Sci., 52, 3556– 3576, 1995.
Bréon, F.-M. and Doutriaux-Boucher, M.: A comparison of cloud droplet radii measured from space, IEEE T. Geosci. Remote, 43, 1796–1805, doi:10.1109/TGRS.2005.852838, 2005.
Cooper, S. J., L’Ecuyer, T. S., Gabriel, P., Baran, A. J., and Stephens, G. L.: Objective assessment of the information content of visi-ble and infrared radiance measurements for cloud microphysical property retrievals over the global oceans. Part II: Ice clouds, J. Appl. Meteorol. Clim., 45, 42–62, doi:10.1175/JAM2327.1, 2006.
Davis, A., Polonsky, I., and Marshak, A.: Space-time Green func-tions for diffusive radiation transport, in: application to active and passive cloud probing, in: Light Scattering Reviews, edited by: Kokhanovsky, A., vol. 4, 169–292, Springer-Praxis, Heidel-berg, Germany, 2009.
Davis, A. B. and Marshak, A.: Solar radiation transport in the cloudy atmosphere: a 3D perspective on observations and cli-mate impacts, Rep. Prog. Phys., 73, 26801, doi:10.1088/0034-4885/73/2/026801, 2010.
de Beek, R., Vountas, M., Rozanov, V. V., Richter, a., and Burrows, J. P.: The ring effect in the cloudy atmosphere, Geophys. Res. Lett., 28, 721–724, doi:10.1029/2000GL012240, 2001. de Haan, J., Bosma, P., and Hovenier, J.: The adding method for
multiple scattering calculations of polarized light, Astron. Astro-phys., 183, 371–391, 1987.
Desmons, M., Ferlay, N., Parol, F., Mcharek, L., and Vanbauce, C.: Improved information about the vertical location and extent of monolayer clouds from POLDER3 measurements in the oxygen A-band, Atmos. Meas. Tech., 6, 2221–2238, doi:10.5194/amt-6-2221-2013, 2013.
Di Girolamo, L., Liang, L., and Platnick, S.: A global view of one-dimensional solar radiative transfer through oceanic water clouds, Geophys. Res. Lett., 37, 1–5, doi:10.1029/2010GL044094, 2010.
Diner, D. J., Davis, A., Hancock, B., Geier, S., Rheingans, B., Jo-vanovic, V., Bull, M., Rider, D. M., Chipman, R. A., Mahler, A.-B., and McClain, S. C.: First results from a dual photoelastic-modulator-based polarimetric camera, Appl. Optics, 49, 2929– 2946, 2010.
Diner, D. J., Xu, F., Garay, M. J., Martonchik, J. V., Rheingans, B. E., Geier, S., Davis, A., Hancock, B. R., Jovanovic, V. M., Bull, M. A., Capraro, K., Chipman, R. A., and McClain, S. C.: The Airborne Multiangle SpectroPolarimetric Imager (AirMSPI): a
new tool for aerosol and cloud remote sensing, Atmos. Meas. Tech., 6, 2007–2025, doi:10.5194/amt-6-2007-2013, 2013. Ferlay, N., Thieuleux, F., Cornet, C., Davis, A. B.,
Dubuis-son, P., Ducos, F., Parol, F., Riédi, J., and Vanbauce, C.: Toward New Inferences about Cloud Structures from Mul-tidirectional Measurements in the Oxygen A Band: Middle-of-Cloud Pressure and Cloud Geometrical Thickness from POLDER-3/PARASOL, J. Appl. Meteorol. Clim., 49, 2492– 2507, doi:10.1175/2010JAMC2550.1, 2010.
Fougnie, B.: Improvement of the PARASOL Radiometric In-Flight Calibration Based on Synergy Between Various Methods Using Natural Targets, IEEE T. Geosci. Remote, 54, 2140–2152, 2016. Goloub, P., Deuze, J. L., Herman, M., and Fouquart, Y.: Anal-ysis of the POLDER polarization measurements performed over cloud covers, IEEE T. Geosci. Remote, 32, 78–88, doi:10.1109/36.285191, 1994.
Heidinger, A. K. and Stephens, G. L.: Molecular Line Absorption in a Scattering Atmosphere. Part II: Application to Remote Sensing in the O2 A band, J. Atmos. Sci., 57, 1615–1634, doi:10.1175/1520-0469(2000)057<1615:MLAIAS>2.0.CO;2, 2000.
Heidinger, A. K. and Stephens, G. L.: Molecular Line Ab-sorption in a Scattering Atmosphere. Part III: Pathlength Characteristics and Effects of Spatially Heterogeneous Clouds, J. Atmos. Sci., 59, 1641–1654, doi:10.1175/1520-0469(2002)059<1641:MLAIAS>2.0.CO;2, 2002.
ICARE Data and Services Center: Atmospheric Radiative Trans-fer Database for Earth Climate Observation (ARTDECO) tool, available at: http://www.icare.univ-lille1.fr/projects/artdeco, last access: 10 October 2016.
Johansson, E., Devasthale, A., L’Ecuyer, T., Ekman, A. M. L., and Tjernström, M.: The vertical structure of cloud radiative heating over the Indian subcontinent during summer monsoon, Atmos. Chem. Phys., 15, 11557–11570, doi:10.5194/acp-15-11557-2015, 2015.
Joiner, J. and Bhartia, P. K.: The determination of cloud pres-sures from rotational Raman scattering in satellite backscatter ultraviolet measurements, J. Geophys. Res., 100, 23019–23026, doi:10.1029/95JD02675, 1995.
King, M. D., Kaufman, Y. J., Menzel, W. P., and Tanre, D.: Remote sensing of cloud, aerosol, and water vapor properties from the Moderate Resolution Imaging Spectrometer (MODIS), IEEE T. Geosci. Remote, 30, 2–27, 1992.
King, N. J. and Vaughan, G.: Using passive remote sensing to re-trieve the vertical variation of cloud droplet size in marine stra-tocumulus: An assessment of information content and the poten-tial for improved retrievals from hyperspectral measurements, J. Geophys. Res., 117, D15206, doi:10.1029/2012JD017896, 2012. Knibbe, W. J. J., De Haan, J. F., Hovenier, J. W., Stam, D. M., Koele-meijer, R. B. A., and Stammes, P.: Deriving terrestrial cloud top pressure from photopolarimetry of reflected light, J. Quant. Spec-trosc. Ra., 64, 173–199, doi:10.1016/S0022-4073(98)00135-6, 2000.
Kratz, D. P.: The correlatedk-distribution technique as applied to the AVHRR channels, J. Quant. Spectrosc. Ra., 53, 501–517, doi:10.1016/0022-4073(95)90050-0, 1995.
Labonnote, L. C., Brogniez, G., Buriez, J. C., Doutriaux Boucher, M., Gayet, J. F., and Macke, A.: Polarized light scattering by inhomogeneous hexagonal monocrystals: Validation with ADEOS-POLDER measurements, J. Geophys. Res.-Atmos., 106, 12139–12153, doi:10.1029/2000JD900642, 2001.
L’Ecuyer, T. S., Wood, N. B., Haladay, T., Stephens, G. L., and Stackhouse, P. W.: Impact of clouds on atmospheric heating based on the R04 CloudSat fluxes and heating rates data set, J. Geophys. Res.-Atmos., 114, 1–15, doi:10.1029/2008JD009951, 2009.
Liang, L. and Girolamo, L. D.: A global analysis on the view-angle dependence of plane-parallel oceanic liquid wa-ter cloud optical thickness using data synergy from MISR and MODIS, J. Geophys. Res.-Atmos., 118, 2389–2403, doi:10.1029/2012JD018201, 2013.
Loeb, N. and Coakley Jr, J.: Inference of marine stratus cloud optical depths from satellite measurements: Does 1D theory apply?, J. Climate, 11, 215–233, doi:10.1175/1520-0442(1998)011<0215:IOMSCO>2.0.CO;2, 1998.
Loyola, D. G., Thomas, W., Livschitz, Y., Ruppert, T., Albert, P., and Hollmann, R.: Cloud properties derived from GOME/ERS-2 backscatter data for trace gas retrieval, IEEE T. Geosci. Remote, 45, 2747–2758, doi:10.1109/TGRS.2007.901043, 2007. Mace, G. G., Zhang, Q., Vaughan, M., Marchand, R., Stephens, G.,
Trepte, C., and Winker, D.: A description of hydrometeor layer occurrence statistics derived from the first year of merged Cloud-sat and CALIPSO data, Journal of Geophysical Research, 114, D00A26, doi:10.1029/2007JD009755, 2009.
Moroney, C., Davies, R., and Muller, J.-P.: Operational retrieval of cloud-top heights using MISR data, IEEE T. Geosci. Remote, 40, 1532–1540, doi:10.1109/TGRS.2002.801150, 2002.
Ohring, G. and Adler, S.: Some experiments with zonally averaged climate model, J. Atmos. Sci., 35, 186–205, 1978.
Platnick, S., King, M. D., Ackerman, S., Menzel, W. P., Baum, B., Riedi, J. C., and Frey, R.: The MODIS cloud products: Algo-rithms and examples from Terra, IEEE T. Geosci. Remote, 41, 459–473, doi:10.1109/TGRS.2002.808301, 2003.
Preusker, R. and Lindstrot, R.: Remote sensing of cloud-top pres-sure using moderately resolved meapres-surements within the oxygen A band – A sensitivity study, J. Appl. Meteorol. Clim., 48, 1562– 1574, doi:10.1175/2009JAMC2074.1, 2009.
Ramon, D., Richard, S., and Dubuisson, P.: MERIS in-flight spec-tral calibration in O2absorption using surface pressure retrieval, Proceeding of SPIE, 4891, 505–514, 2003.
Riedi, J., Marchant, B., Platnick, S., Baum, B. A., Thieuleux, F., Oudard, C., Parol, F., Nicolas, J.-M., and Dubuisson, P.: Cloud thermodynamic phase inferred from merged POLDER and MODIS data, Atmos. Chem. Phys., 10, 11851–11865, doi:10.5194/acp-10-11851-2010, 2010.
Rodgers, C. D.: Information content and optimisation of high spec-tral resolution remote measurements, Adv. Space Res., 21, 361– 367, 1998.
Rodgers, C. D.: Inverse Methods for Atmospheric Sounding: The-ory and Practice, World Scientific, Singapore, 2000.
Rossow, W. B. and Schiffer, R. A.: ISCCP Cloud Data Prod-ucts, B. Am. Meteorol. Soc., 72, 2–20, doi:10.1175/1520-0477(1991)072<0002:ICDP>2.0.CO;2, 1991.
Rozanov, V. V. and Kokhanovsky, A. A.: Semianalytical cloud re-trieval algorithm as applied to the cloud top altitude and the cloud
geometrical thickness determination from top-of-atmosphere re-flectance measurements in the oxygen A band, J. Geophys. Res.-Atmos., 109, D05202, doi:10.1029/2003JD004104, 2004. Schuessler, O., Loyola, D., Doicu, A., and Spurr, R.:
Informa-tion content in the oxygen-band for the retrieval of macrophysi-cal cloud parameters, IEEE T. Geosci. Remote, 52, 3246–3255, 2014.
Seiz, G., Tjemkes, S., and Watts, P.: Multiview Cloud-Top Height and Wind Retrieval with Photogrammetric Methods: Application to Meteosat-8 HRV Observations, J. Appl. Meteorol. Clim., 46, 1182–1195, doi:10.1175/JAM2532.1, 2007.
Shannon, C. E.: A mathematical theory of communication, Bell Syst. Tech. J., 27, 379–423, 1948.
Sourdeval, O., -Labonnote, L. C., Brogniez, G., Jourdan, O., Pelon, J., and Garnier, A.: A variational approach for retrieving ice cloud properties from infrared measurements: application in the context of two IIR validation campaigns, Atmos. Chem. Phys., 13, 8229–8244, doi:10.5194/acp-13-8229-2013, 2013.
Sourdeval, O., C.-Labonnote, L., Baran, A. J., and Brogniez, G.: A methodology for simultaneous retrieval of ice and liquid water cloud properties. Part I: Information content and case study, Q. J. Roy. Meteor. Soc., 141, 870–882, doi:10.1002/qj.2405, 2014. Stocker, T., Qin, D., Plattner, G.-K., Tignor, M., Allen, S.,
Boschung, J., Nauels, A., Xia, Y., Bex, V., and Midgley, P.: IPCC 2013: Climate Change 2013: The Physical Science Basis. Con-tribution of Working Group I to the Fifth Assessment Report of the Intergovernmantal Panel on climate Change, Tech. rep., Cambridge University Press, Cambridge, UK and New York, NY, USA, 2013.
Várnai, T. and Marshak, A.: View angle dependence of cloud opti-cal thicknesses retrieved by Moderate Resolution Imaging Spec-troradiometer (MODIS), J. Geophys. Res.-Atmos., 112, D06203, doi:10.1029/2005JD006912, 2007.
Winker, D. M. and Trepte, C. R.: Laminar cirrus observed near the tropical tropopause by LITE, Geophys. Res. Lett., 25, 3351– 3354, doi:10.1029/98GL01292, 1998.
Winker, D. M., Hunt, W. H., and McGill, M. J.: Initial perfor-mance assessment of CALIOP, Geophys. Res. Lett., 34, L19803, doi:10.1029/2007GL030135, 2007.
Wu, D. L., Ackerman, S. a., Davies, R., Diner, D. J., Garay, M. J., Kahn, B. H., Maddux, B. C., Moroney, C. M., Stephens, G. L., Veefkind, J. P., and Vaughan, M. A.: Vertical distributions and re-lationships of cloud occurrence frequency as observed by MISR, AIRS, MODIS, OMI, CALIPSO, and CloudSat, Geophys. Res. Lett., 36, L09821, doi:10.1029/2009GL037464, 2009.
Yamamoto, G. and Wark, D. Q.: Discussion of the letter by R. A. Hanel, “Determination of cloud altitude from a satellite”, J. Geo-phys. Res., 66, 3596, doi:10.1029/JZ066i010p03596, 1961. Yang, Y., Marshak, A., Mao, J., Lyapustin, A., and Herman,
J.: A method of retrieving cloud top height and cloud ge-ometrical thickness with oxygen A and B bands for the Deep Space Climate Observatory (DSCOVR) mission: Radia-tive transfer simulations, J. Quant. Spectrosc. Ra., 122, 141–149, doi:10.1016/j.jqsrt.2012.09.017, 2013.