www.atmos-meas-tech.net/9/2909/2016/ doi:10.5194/amt-9-2909-2016
© Author(s) 2016. CC Attribution 3.0 License.
Evaluation of NO
+
reagent ion chemistry for online measurements
of atmospheric volatile organic compounds
Abigail R. Koss1,2,3, Carsten Warneke1,2, Bin Yuan1,2, Matthew M. Coggon1,2, Patrick R. Veres1,2, and Joost A. de
Gouw1,2,3
1NOAA Earth System Research Laboratory (ESRL), Chemical Sciences Division, Boulder, CO, USA
2Cooperative Institute for Research in Environmental Sciences, University of Colorado at Boulder, Boulder, CO, USA 3Department of Chemistry and Biochemistry, University of Colorado at Boulder, CO, USA
Correspondence to:Abigail R. Koss (abigail.koss@noaa.gov)
Received: 9 March 2016 – Published in Atmos. Meas. Tech. Discuss.: 7 April 2016 Revised: 18 June 2016 – Accepted: 21 June 2016 – Published: 8 July 2016
Abstract. NO+ chemical ionization mass spectrometry (NO+CIMS) can achieve fast (1 Hz and faster) online mea-surement of trace atmospheric volatile organic compounds (VOCs) that cannot be ionized with H3O+ ions (e.g., in a
PTR-MS or H3O+CIMS instrument). Here we describe the
adaptation of a high-resolution time-of-flight H3O+ CIMS
instrument to use NO+ primary ion chemistry. We evalu-ate the NO+technique with respect to compound specificity, sensitivity, and VOC species measured compared to H3O+.
The evaluation is established by a series of experiments in-cluding laboratory investigation using a gas-chromatography (GC) interface, in situ measurement of urban air using a GC interface, and direct in situ measurement of urban air. The main findings are that (1) NO+ is useful for isomeri-cally resolved measurements of carbonyl species; (2) NO+ can achieve sensitive detection of small (C4–C8) branched
alkanes but is not unambiguous for most; and (3) compound-specific measurement of some alkanes, especially isopen-tane, methylpenisopen-tane, and high-mass (C12–C15) n-alkanes, is
possible with NO+. We also demonstrate fast in situ
chemi-cally specific measurements of C12to C15alkanes in ambient
air.
1 Introduction
Volatile organic compounds (VOCs) are central to the for-mation of ozone and secondary organic aerosol and can have direct human health effects. Attempting to understand the behavior of these species in the troposphere presents
sev-eral measurement challenges (Glasius and Goldstein, 2016). First, VOCs are highly chemically diverse. Second, many en-vironmentally important species require measurement preci-sion of better than 100 parts per trillion (ppt). Finally, nu-merous applications, such as eddy flux analyses or sampling from a mobile platform, require fast in situ measurements, with 1 min or faster time resolution.
H3O+ chemical ionization mass spectrometry (H3O+
CIMS), more commonly known as proton-transfer-reaction mass spectrometry (PTR-MS), is a well-established approach to measuring VOCs (de Gouw and Warneke, 2007; Jordan et al., 2009b). In H3O+ CIMS, air is mixed with hydronium
(H3O+) ions in a drift tube region. VOCs are ionized by
transfer of the proton from H3O+to the VOC. These
instru-ments are capable of VOC measureinstru-ments that are fast, sensi-tive, and chemically detailed (Jordan et al., 2009b; Graus et al., 2010; Sulzer et al., 2014; Yuan et al., 2016).
Despite these advantages, H3O+CIMS has several
limita-tions related to the reagent ion chemistry. For one, this tech-nique generally cannot distinguish between isomers. For in-stance, this is a significant limitation when measuring alde-hyde and ketone carbonyl isomers, which display very dif-ferent behavior in the atmosphere. Separation of propanal and acetone with PTR-MS has been explored using collision-induced dissociation with an ion-trap mass analyzer, but this technique negatively affects the instrument time resolution and sensitivity (Warneke et al., 2005). Additionally, some proton transfer reactions are dissociative. Large hydrocar-bons (C8 and larger) fragment into common small masses,
Er-ickson et al., 2014; Gueneron et al., 2015). Alcohols and aldehydes can lose H2O, lowering the sensitivity to the
pro-tonated parent mass; their product ion masses then coincide with those of hydrocarbons, making independent measure-ment difficult (Španˇel et al., 1997; Buhr et al., 2002). Fur-thermore, H3O+ CIMS is not sensitive to small (∼C8and
smaller) saturated alkanes, as their proton affinities are lower than or very close to that of water (Arnold et al., 1998; Guen-eron et al., 2015). This is a serious limitation in studies of urban air or emissions from oil and natural gas extractions, where small alkanes can contribute a large fraction to the to-tal gas phase carbon and chemical reactivity (Katzenstein et al., 2003; Gilman et al., 2013). Gas-chromatography (GC) techniques avoid many of these limitations but have much slower time resolution.
Use of NO+ reagent ion chemistry may address some of the limitations of H3O+. Reaction of NO+ with various
VOCs has been extensively studied using selected-ion flow tube methods (SIFT-MS). SIFT methods use a quadrupole mass filter between the ion source and ion–molecule reac-tor, which provides a very pure reagent ion source but limits the primary ion signal. SIFT studies have identified the ma-jor products of the reaction of NO+with VOCs representa-tive of many different functional groups (Španˇel and Smith, 1996, 1998a, b, 1999; Španˇel et al., 1997; Arnold et al., 1998; Francis et al., 2007a, b). Aldehydes and ketones are easily separable: ketones cluster with NO+, forming mass (m+30) ions, whereas aldehydes react by hydride abstraction, form-ing mass (m−1) ions (wheremis the molecular mass of the species). Rather than losing H2O, as in H3O+ CIMS,
alco-hols react by NO+adduct formation or hydride abstraction. And finally, NO+can be used to detect alkanes: small (> C
4)
branched alkanes and large (> C8) n-alkanes react by hydride
abstraction, forming mass (m−1).
The application of SIFT methods to atmospheric analy-sis has been limited by relatively poor sensitivity (Smith and Španˇel, 2005; Francis et al., 2007b; de Gouw and Warneke, 2007), although better sensitivities have been reported in re-cent years (Prince et al., 2010). The adaptation of an ex-isting CIMS instrument to use the SIFT technique requires extensive instrument modification or the purchase of an ex-ternal SIFT unit (Karl et al., 2012). Several groups have experimented with low-cost adaptation of H3O+CIMS
in-struments to use NO+ chemistry. Knighton et al. (2009) adapted an H3O+CIMS instrument to measure 1,3-butadiene
and demonstrated in situ detection of this species in the at-mosphere. Jordan et al. (2009a) have developed a hollow-cathode ion source capable of switchable reagent ion chem-istry, and they demonstrated laboratory measurement with NO+ of several aromatics, chlorinated aromatics, and car-bonyls, with sensitivities comparable to H3O+ CIMS. The
NO+capability of the Jordan et al. instrument has been used in the laboratory by Inomata et al. (2013) to investigate de-tection of n-tridecane, by Agarwal et al. (2014) to measure picric acid, and by Liu et al. (2013) to investigate the
be-havior of methyl vinyl ketone (MVK) and methacrolein in a reaction chamber.
These studies suggest that an easy, low-cost adaptation of H3O+ CIMS instruments to NO+ chemistry could greatly
enhance our capability to measure VOCs in the atmosphere. However, the number of VOC species investigated to date is small and few field measurements have been reported. The ability of a modified H3O+CIMS instrument to separate
car-bonyl isomers in ambient air, and to measure small alkanes both in the laboratory and in ambient air, has not been eval-uated. Finally, the lack of fragmentation of n-tridecane re-ported in Inomata et al. (2013) is intriguing, but the use of an NO+CIMS instrument to measure similar high-mass alkanes in ambient air has not been demonstrated.
Here we evaluate the adaptation of an H3O+ CIMS
in-strument to use NO+ reagent ion chemistry. We provide specifics on instrument setup and operating parameters. We report the sensitivity and spectral simplicity of NO+CIMS,
relative to H3O+CIMS, for nearly 100 atmospherically
rel-evant VOCs, including a wide range of functional groups, and provide product ion distributions for several represen-tative compounds. We demonstrate, interpret, and evaluate measurements of separate aldehyde and ketone isomers, light alkanes, and several other species in ambient air. Finally, we investigate measurement of high-molecular-mass alkanes us-ing NO+. We extend the laboratory analysis of high-mass alkanes to C12–C15 n-alkanes and demonstrate fast, in situ
measurement of these species in ambient air.
2 Methods
2.1 Instrumentation
Two separate H3O+CIMS instruments (referred to hereafter
as PTR-QMS and H3O+ToF-CIMS) were adapted to NO+
chemistry in this work. Both instruments consist of (1) a hol-low cathode reagent ion source, (2) a drift tube reaction re-gion, (3) an ion transfer stage that transports from the drift tube to the mass analyzer and allows differential pumping, and (4) a mass analyzer. Both instruments have nearly iden-tical hollow cathode ion sources and drift tube reaction re-gions, described in detail in de Gouw and Warneke (2007). The PTR-QMS (Ionicon Analytik) uses ion lenses to transfer ions from the drift tube to a unit-mass-resolution quadrupole mass analyzer (Pfeiffer). This instrument is described further by de Gouw and Warneke (2007). The H3O+ToF-CIMS uses
(Aerodyne Research Inc./Tofwerk AG). A description of the algorithm is given in DeCarlo et al. (2006).
A GC instrument was used both as an interface to the ToF-CIMS and as a separate instrument using an electron-impact quadrupole mass spectrometer. The GC collects VOCs in a liquid nitrogen cryotrap for a 5 min period every 30 min. VOCs are then injected onto parallel Al2O3/KCl PLOT and
semi-polar DB-624 capillary columns to separate C2–C11
hy-drocarbons and heteroatom-containing VOCs. When used as an interface to the ToF-CIMS, the column eluant was di-rected to the inlet of the ToF-CIMS, where it was diluted with 50 sccm of clean air with controlled humidity. When operated as a separate instrument, the column eluant was di-rected to an electron-ionization quadrupole mass spectrome-ter (EIMS) operated in selected-ion mode. The response of this GC-EIMS instrument to various VOCs has been well characterized over a long period of field and laboratory ap-plications, and further operational details have been reported elsewhere (Goldan et al., 2004; Gilman et al., 2010, 2013).
2.2 Adaptation of H3O+to NO+CIMS
Ideally, both H3O+and NO+ reagent ion chemistry can be
utilized with a single instrument. The fewest possible num-ber of hardware parameters were changed to facilitate fast switching and instrument stability.
To achieve generation of NO+ ions, the water reservoir was replaced with ultra-high-purity air. The source gas flow (5 sccm), the hollow cathode parameters, and the drift tube operating pressure (2.4 mbar) were not changed. To optimize the generation of NO+ions relative to H3O+, O+2, and NO+2,
and the generation of the desired VOC+ ion products, the
voltages of the intermediate chamber plates,VIC1andVIC2,
and the drift tube voltageVDTwere adjusted. An instrument
schematic showing the locations ofVIC1,VIC2, andVDTcan
be found in the Supplement (Fig. S1). Optimization was per-formed sampling dry air.
It has been demonstrated that the quadrupole ion guides of the ToF-CIMS can significantly change the measured dis-tribution of reagent and impurity ions (Yuan et al., 2016). The PTR-QMS does not have that issue as strongly (mod-eled and measured cluster distributions are largely similar, as discussed by de Gouw and Warneke, 2007) and therefore we explored the effect ofVIC1,VIC2, andVDTon reagent ion
distribution using the PTR-QMS. As the PTR-QMS and ToF-CIMS have nearly identical ion source and drift tube design, we assume that ion behavior in these regions is the same for the two instruments.
First,VDTwas held constant at 720 V (the original setting
of the PTR-QMS instrument), andVIC1andVIC2were varied
(Fig. 1). The settings ofVIC1 (140 V) andVIC2(80 V) were
selected as a compromise between high NO+ion count rate and low-impurity ion count rates. The major impurity ions are H3O+, O+2, and NO
+
2, and it is desirable to limit the
for-mation of these ions because they react with VOCs,
compli-120x106
100
80
60
40
20
0
m30 (cps)
250 200 150 100 50
25x10-3
20
15
10
5
0
m19/m30 (cps/cps)
250 200 150 100 50 0.10
0.08
0.06
0.04
0.02
0.00
m46/m30 (cps/cps)
250 200 150 100 50
VIC1 (volts)
70x10-3 60
50
40
30
20
10
0
m32/m30 (cps/cps)
250 200 150 100 50
VIC1 (volts) VIC2 (volts)
120 100 80 60 40
NO+ H3O+
NO2+ O2+
Figure 1.Dependence of NO+, H3O+, NO+2, and O
+
2 on
interme-diate chamber voltages. The arrow denotes the selected operating conditions. Experiment conducted in dry air (H3O+is from resid-ual water in the instrument and in commercial ultra-zero air.)
cating the interpretation of spectra. Next, several VOCs with different functional groups were introduced into the instru-ment, separately, and the drift tube electric potential scanned. A drift tube voltage of 350 V (electric field intensity relative to gas number densityE/N=60 Td) was selected as a com-promise between maximizing NO+ion count rate, minimiz-ing H3O+, O+2, and NO+2, maximizing VOC ion count rates,
minimizing alkane fragmentation, and promoting different product ions for carbonyls and aldehydes (Fig. 2). This set-ting results in about 10×106cps (counts per second) of NO+
primary ions, while in typical PTR-MS settings we achieve about 30×106cps of H3O+primary ions.
We note that theE/Nof 60 Td used for the NO+CIMS is much lower than that used in typical PTR-MS settings (circa 120 Td). In air, NO+will react with water to produce H3O+
and HNO2(Fehsenfeld et al., 1971). The electric field in the
drift tube limits the formation of the NO+·(H2O)n
interme-diaries in this reaction, promoting high NO+count rates and VOC sensitivity. In PTR-MS, the drift field is used to pre-vent the formation of analogous H3O+·(H2O)nclusters. The
bond energy of H3O+·(H2O)nclusters is significantly higher
than that of NO+·(H2O)n clusters (Keesee and Castleman,
re-6x10⁴ 4 2 0 Signal, cps 800 600 400 200
Drift tube voltage (V)
120 100 80 60 40 E/N (Td) 1.0 0.5 0.0
Fraction of total signal
(c) DMB 85 71 57 1.0x10⁵ 0.5 0.0 Signal, cps 800 600 400 200
Drift tube voltage (V)
120 100 80 60 40 E/N (Td) 1.0 0.5 0.0
Fraction of total signal
(b) MACR 100 69 89 71 6x10³ 4 2 0 Signal, cps 800 600 400 200
Drift tube voltage (V)
120 100 80 60 40 E/N (Td) 1.0 0.5 0.0
Fraction of total signal
(a) MVK 100 71 89 69 1.0x10⁴ 0.5 0.0 Signal, cps 800 600 400 200
Drift tube voltage (V)
120 100 80 60 40 E/N (Td) 1.0 0.5 0.0
Fraction of total signal
(d) MCH 83 97 104 105 106 107 Signal, cps 120 100 80 60 40 E/N, Td 800 600 400 200
Drift tube voltage (V)
(e) Primary ion
NO+
NO•H2O+ H3O+
O2+
NO2+
Figure 2.VOC and primary product ion dependence on drift tube
voltage. Traces are labeled by the nominal product ionm/zin Th.
(a)Methyl vinyl ketone;(b)methacrolein;(c)2,2-dimethylbutane;
(d)methylcyclohexane;(e)primary ions and clusters. The dashed line indicates the selected operating voltage. Experiment conducted in dry air (H3O+is from residual water in the instrument and in
commercial ultra-zero air.)
duced declustering at these locations, which improved the transmission of VOC·NO+clusters.
3 Results and discussion
3.1 Laboratory experiments
3.1.1 Sensitivity and simplicity of the NO+reagent ion chemistry
VOCs from several calibration cylinders (VOCs listed in Ta-ble S1 in the Supplement) were diluted with high purity air to mixing ratios of approximately 10 ppbv and introduced into the sampling inlet of the GC interface. Eluant from the col-umn was directed into the ToF-CIMS as described above. A relative humidity of 20 % was used for this experiment. This humidity condition is similar to that expected for ambient measurements discussed in Sect. 3.2; this condition was
cho-sen to aid interpretation of ambient air data. Humidity effects are discussed in Sect. 3.1.5. Several species co-elute with an-other compound (m- and p-xylenes; myrcene and camphene; 1-ethyl,3-methylbenzene and 1-ethyl,4-methylbenzene); re-ported sensitivities and product ions are an average of the two co-eluting species.
Each VOC mixture was sampled twice, once with H3O+
and once with NO+ reagent ion chemistry and instrument settings. Based on the results we evaluated the utility of NO+ CIMS relative to H3O+ CIMS using two metrics. The first
metric is sensitivity for individual VOCs. To determine the sensitivity (S), the signals (cps) of all product ions were in-tegrated over the width of the chromatographic peak and sensitivities for the measured VOCs using NO+ chemistry were calculated relative to the sensitivity using H3O+
chem-istry (SNO+/SH3O+). For several VOCs, we also calculated
the relative sensitivity when only the most abundant prod-uct ion (the quantitation ion) is measured (Table 2b). Be-cause only one concentration was sampled, this metric relies on sensitivity being linear with concentration. Linear sen-sitivity is a reasonable assumption for the NO+ and H3O+
ToF-CIMS because separate multiple-point calibrations for select VOCs showed a linear response (Sect. 3.1.4, Fig. S10), H3O+CIMS has demonstrated linear sensitivity over a wide
range of concentration (de Gouw and Warneke, 2007; Sulzer et al., 2014; Yuan et al., 2016), and the NO+CIMS agrees well with an independent technique over a range of atmo-spheric concentrations (Sect. 3.2.2).
The second metric is the simplicity of spectra. In an ideal instrument, each VOC would produce only one product ion, and each ion mass would be produced by only one VOC. However, using NO+ and H
3O+ reagent ions,
fragmenta-tion of product ions does occur. As a metric for the com-plexity of the product ion distribution resulting from partic-ular VOCs, we determined the fraction of the most abun-dant ion to the total signal from this VOC (F) and discuss (FNO+)relative to (FH
3O+). Figure S3 contains a
compari-son ofFNO+ andFH
3O+ and an example product ion
distri-bution. A larger value of this ratio means that NO+reagent ion chemistry creates a simpler product ion distribution for that particular VOC. This metric does not indicate whether a particular product ion is produced by only one VOC. Unique-ness of product ions is discussed in Sect. 3.1.2. The NO+ CIMS product ion distributions of 25 atmospherically rele-vant VOCs are reported in Table 2.
Figure 3 summarizes the comparison between NO+ and H3O+reagent ion chemistry for the two metrics. On the y
axis the spectrum simplicity metric and on thexaxis the sen-sitivity metric are shown.
Branched alkanes and most cyclic alkanes are detected with far greater sensitivity using NO+ chemical ionization than with H3O+chemical ionization. Aromatics and alkenes
2.0
1.5
1.0
0.5
0.0
Relative product ion simplicity (F
NO+
/FH3O+
)
0.1 1 10 100
Relative sensitivity (SNO+/ SH3O+)
Branched alkanes Alkenes n-alkanes Cyclic alkanes Monoterpenes Aromatics Aldehydes Ketones Alcohols Other Less sensitive
more complicated spectra
More sensitive less complicated spectra
Cyclohexane Acetaldehyde i-butane i-pentane Methanol Acetonitrile Propanol n-propylbenzene Ethanol Benzene
Figure 3.Comparison of production ion distribution and sensitivity
of VOCs using NO+and H3O+reagent ion chemistry, at a relative
humidity of 20 %.
exception of methanol. The lower sensitivity to methanol is consistent with slower reaction kinetics reported in the liter-ature (Španˇel and Smith, 1997). Monoterpenes and acetoni-trile are detected substantially less sensitively.
In comparing the simplicity of the product ion distribu-tion between H3O+and NO+chemistry, most branched and
cyclic alkanes, ketones, and monoterpenes have a higher fraction of signal on a single product ion (simpler spectra). We also highlight that many alkyl substituted aromatics frag-ment substantially with H3O+ chemistry but do not with
NO+chemistry. The few exceptions (notably, benzene)
cre-ate more compliccre-ated spectra because an NO+cluster
prod-uct is also present (m+30).
3.1.2 Distribution of product ions
It is somewhat more difficult to predict the ionized VOC products of NO+CIMS compared to H3O+CIMS, because
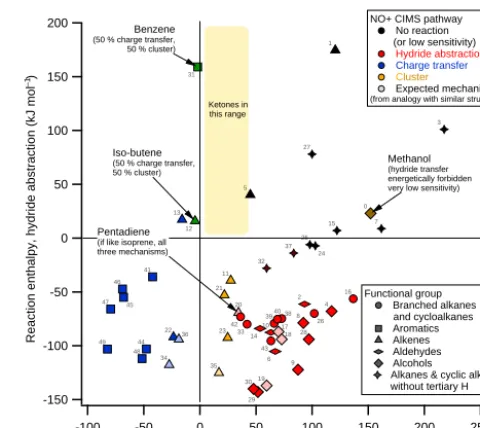
NO+has three common reaction mechanisms: charge trans-fer, hydride abstraction, and cluster formation. Groups of VOCs that have similar charge transfer and hydride abstrac-tion enthalpies tend to react with similar ionizaabstrac-tion mech-anisms (Fig. 4). Figure 4 uses thermodynamic information from Lias et al. (1988), as well as mechanistic informa-tion from this work (see Table S1 for a list of species) and from SIFT studies (Španˇel and Smith, 1996, 1998a, b, 1999; Španˇel et al., 1997; Arnold et al., 1998; Francis et al., 2007a, b). Charge transfer occurs when the reaction enthalpy is fa-vorable, regardless of the hydride transfer enthalpy. When the charge transfer enthalpy is close to zero, then NO+ clus-tering occurs; when charge transfer is not favorable but hy-dride transfer is, then hyhy-dride transfer will occur. In terms
200 150 100 50 0 -50 -100 -150
Reaction enthalpy, hydride abstraction (kJ mol )
250 200 150 100 50 0 -50 -100
Reaction enthalpy, charge transfer (kJ mol ) 0 1 2 3 4 5 7 8 9 10 11 13 15 16 19 21 22 23 25 27 28 30 32 34 35 37 39 41 44 46 47 48 49 6 12 14 29 31 33 42 43 17 18 36 38 24 26 45 20 40 Methanol (hydride transfer energetically forbidden very low sensitivity)
Benzene
(50 % charge transfer, 50 % cluster)
NO+ CIMS pathway No reaction (or low sensitivity)
Hydride abstraction
Charge transfer
Cluster Expected mechanism
(from analogy with similar structure)
Iso-butene
(50 % charge transfer, 50 % cluster)
Pentadiene
(if like isoprene, all three mechanisms) Functional group Branched alkanes and cycloalkanes Aromatics Alkenes Aldehydes Alcohols
Alkanes & cyclic alkanes without tertiary H
Ketones in this range
–1
–1
Figure 4.VOC–NO+reaction mechanism dependence on charge
transfer and hydride transfer reaction enthalpy. VOC identification is indicated by the small numbers and is listed in Table 1. Hydride abstraction enthalpies for ketones are not known but can be assumed to be positive based on structural considerations (lack of tertiary hydrogen). Ion thermodynamic information is available for several species whose reaction mechanism was not experimentally verified in this or previous work; an expected mechanism was determined by analogy with a VOC of similar structure. 17 is 1-butanol, by analogy with 1-propanol; 18 is 2-methylpropanol, by analogy with 1-propanol; 19 is 2-butanol, by analogy with 2-propanol; 20 is 1,4-pentadiene, by analogy with isoprene; 34 is 4-methyl-2-pentene, by analogy with 2-pentene; 35 is 3-methyl-1-pentene, by analogy with 1-hexene; 36 is 2,3,-dimethyl-1-butene, by analogy with isobutene.
of VOC families, this means that carbonyls participate in two mechanisms: ketones cluster with NO+, and aldehydes hydride transfer. Branched alkanes exclusively undergo hy-dride transfer. Aromatics undergo charge transfer and ben-zene also clusters; alcohols undergo hydride transfer, and alkenes charge transfer, cluster, or hydride transfer depend-ing on the size of the molecule and the location of the double bond within the molecule.
Although Fig. 4 provides a general way to predict the pos-sible mechanisms for a particular VOC, it provides no infor-mation about the distribution of the signal between different mechanisms or the degree of fragmentation. The distribution depends strongly on instrumental conditions, which include E/Nsettings in the ion–molecule reaction region (by far the most important effect), fragmentation and clustering in the ion optics, presence of impurity ions such as O+2 from the converted hollow cathode ion source, and relative humidity (Sect. 3.1.5).
Table 1.VOC species in Fig. 4 and their charge transfer and hydride transfer reaction enthalpies.
ID no. Species name Hydride transfer Charge transfer
enthalpy (kJ mol−1) enthalpy (kJ mol−1)
0 methanol 22.98 152.05
1 ethene 174.58 120.59
2 acetaldehyde −61.32 93.20
3 ethane 100.98 217.65
4 ethanol −68.02 117.31
5 propene 40.17 44.96
6 propanal −105.32 67.15
7 propane 8.88 161.69
8 n-propanol −78.72 92.23
9 i-propanol −122.22 87.41
10 methacrolein −87.62 63.29
11 1-butene −39.39 27.59
12 isobutene 15.88 −4.24
13 2-butenes 17.18 −15.82
14 butanal −84.02 53.64
15 n-butane 6.98 122.14
16 isobutane −56.32 136.61
17 1-butanol −87.02 70.04
18 2-methylpropanol −94.02 72.94
19 2-butanol −137.02 59.43
20 1,4-pentadiene −69.32 34.35
21 1-pentene −53.02 21.80
22 2-pentene −92.02 −23.54
23 3-methyl-1-butene −92.52 24.70
24 cyclopentane −7.22 102.84
25 n-pentane −6.02 98.02
26 isopentane −70.02 101.88
27 neo-pentane 77.98 99.95
28 1-pentanol −94.02 97.05
29 3-methyl-2-butanol −143.02 51.71
30 3-pentanol −140.02 47.85
31 benzene 159.08 −1.93
32 cyclohexane −28.02 59.43
33 methylcyclopentane −80.02 42.06
34 4-methyl-2-pentene −117.82 −27.40
35 3-methyl-1-pentene −125.22 16.98
36 2,3,-dimethyl-1-butene −94.02 −18.72
37 n-hexane −13.92 83.55
38 2-methylpentane −74.72 72.94
39 2,3-dimethylbutane −79.22 66.18
40 3-methylpentane −75.42 69.08
41 toluene −36.02 −42.06
42 methylcyclohexane −73.02 36.27
43 1,2-dimethyl-cyclopentane −95.52 63.29
44 ethylbenzene −103.02 −47.66
45 o-xylene −55.02 −67.92
46 m-xylene −47.22 −68.88
47 p-xylene −65.92 −79.50
48 isopropylbenzene −111.92 −51.52
49 3-ethyltoluene −103.12 −82.41
50 acetone 43.03
51 butanone 24.70
52 2-pentanone 11.19
53 3-pentanone 4.44
1.0
0.8
0.6
0.4
0.2
0.0
Fraction of total signal
Benzene Toluene1,2,4-trimethylBenzene Propanal Acetone 1-butene Tridecane
Study E/N H2O O2
+
This work 60 20 % RH 4 % of NO+ SIFT-MS N/A 0 0 U. of Leicester 148–165 residual negligible NIES/NTSEL 67 0 1.5 % of NO+ Japan
itation...
C a b a b a c d c d b e
Ions
Charge transfer NO+ adduct Hydride abstraction Residual H O product3
+
Fragments/other
Figure 5. Comparison of product ion distributions between four
sets of instrumental and environmental conditions. References: (a) Španˇel and Smith (1998b); (b) Blake et al. (2006); (c) Španˇel et al. (1997); (d) Wyche et al. (2005); (e) Yamada et al. (2015).
higher E/N ratio in the drift tube, leading to higher frag-mentation and lower NO+ adduct formation compared to this work (Wyche et al., 2005; Blake et al., 2006). Investi-gation of higher-mass alkanes by Yamada et al. (2015) used similarE/N but achieved lower contaminant O+2, which is a likely explanation for the higher degree of fragmentation of tridecane seen in this work. In SIFT-MS studies, without an electric field, fragmentation is minimized and preselec-tion of NO+primary ions eliminates contaminant H3O+and
O+2 and therefore SIFT product ion distributions are gener-ally simpler. These differences highlight the importance of selection of drift tube operating conditions and instrument characterization.
3.1.3 Alkane fragmentation
Small (C4–C10) branched alkanes cannot be measured by
H3O+ CIMS. With NO+CIMS, these VOCs are detectable
but generally fragment to produce several ionic fragments that are common to different species. These masses (for ex-ample,m/z57 C4H+9)are produced by many different
com-pounds and are likely not useful for chemically resolved at-mospheric measurements. A few masses (e.g.,m/z71 C5H+11
andm/z85 C6H+13)are only produced by a few compounds
and were therefore targeted for further investigation in ambi-ent air measuremambi-ents. Conversely, cyclic alkanes fragmambi-ent very little. Fig. S4 shows the product ion distributions of several representative aliphatic compounds. We note that the major product ions of cyclic alkanes (M-H) are the same with H3O+and with NO+chemistry. However, the mechanism is
different: NO+ionizes by hydride abstraction, while H3O+
ionizes by protonation followed by loss of H2 (Midey et
al., 2003). The H3O+ionization mechanism has a secondary
Figure 6.Large (C12–C15) n-alkane product ion distribution, using
relative humidity of 20 %. The expected largest mass resulting from hydride abstraction (m−1) is highlighted in red. N-octane (C8) is
shown for comparison.
channel consisting of protonation followed by elimination of CH4or CnH2n(Midey et al., 2003). The difference in
ioniza-tion mechanism is a likely explanaioniza-tion for the lower degree of fragmentation observed using NO+chemistry.
Compared to small (C8 and smaller) alkanes, large (C12
and higher) n-alkanes show little fragmentation, with at least 50 % of the total ion signal accounted for by the expected parent mass (m−1; Fig. 6). Additionally, the degree of frag-mentation decreases with increasing carbon chain length. It is quite difficult to measure these compounds with H3O+CIMS
because they fragment extensively and are not detected sen-sitively (Erickson et al., 2014). NO+ CIMS could provide a fast, sensitive, chemically specific measurement of these compounds. It should be mentioned that large n-alkanes (C10
and larger) are not measurable with the GC interface. Do-decane (C12H26), tridecane (C13H28), tetradecane (C14H30),
and pentadecane (C15H32)were sampled directly with the
NO+ToF-CIMS and product ions were identified by corre-lation with the expected major product ion (m−1). The NO+ ToF-CIMS sensitivity to pentadecane was determined using a permeation source (Veres et al., 2010). Contaminant O+2 could potentially reduce the measured parent ion ([M-H]+) through fragmentation; an alkane measurement corrected for O+2 interference would have higher sensitivity and a simpler product ion distribution (e.g., Yamada et al., 2015).
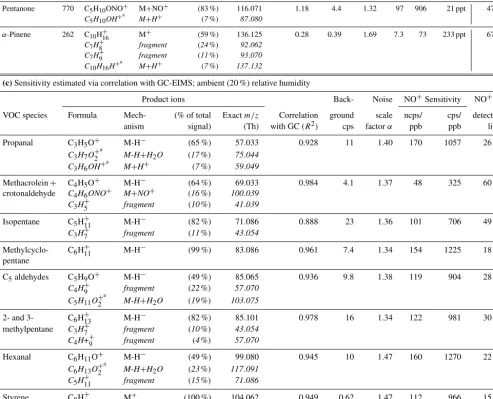
3.1.4 Instrument response factor for select compounds
GC-Table 2.Sensitivities and detection limits of NO+ToF-CIMS for various VOCs. Additional product ions not used to establish sensitivity are listed in italic. The H3O+ToF-CIMS detection limits in the farthest right column are calculated from separate H3O+ToF-CIMS calibrations
as described in Yuan et al. (2016).
(a)Species calibrated directly with NO+CIMS; ambient (20 %) relative humidity
Ion formula (% of total signal)
Back- Noise NO
+sensitivity
NO+1 s H3O+CIMS 1 s
Mech- (% of total Exactm/z ground scale ncps/ cps/ detection detection
VOC species Formula anism signal) (Th) cps factorα ppb ppb limit limit
Methanol CH4ONO+ M+NO+ (12 %) 62.024 0.70 1.23 0.07 0.67 19 ppb 0.397 ppb
CH4OH+a M+H+ (49%) 33.034
CH7O+2a M+H3O+ (39%) 51.044
Acetonitrile C2H3NNO+ M+NO+ (48 %) 71.024 0.49 1.33 3.7 24 540 ppt 45 ppt
C2H3NH+a M+H+ (44%) 42.034
C2H6NO+a M+H3O+ (8%) 60.044
Acetaldehyde C2H3O+ M-H− (60 %) 43.018 33 1.33 29 146 268 ppt 195 ppt
C2H5O+2 M-H+H2O (13%) 61.028
C2H4OH+a M+H+ (11%) 45.034
C2H4ONO+ M+NO+ (9%) 74.024
Acetone C3H6ONO+ M+NO+ (82 %) 88.039 19 1.16 51 376 73 ppt 97 ppt
C3H6OH+a M+H+ (13%) 59.049
Isoprene C5H+8 M
+ (46 %) 68.062 0.76 1.34 44 286 48 ppt 162 ppt
C5H8NO+ M+NO+ (17%) 98.060
C5H+7 M-H− (7%) 67.054
MEK C4H8ONO+ M+NO+ (86 %) 102.055 3.4 1.33 98 767 23 ppt 45 ppt
C4H8OH+a M+H+ (8%) 73.065
Benzeneb C6H+6 M
+ (55 %) 78.046 2.3 1.37 57 391 43 ppt
C6H6NO+ M+NO+ (40 %) 108.044 2.5 1.72 36 292 74 ppt 96 ppt
sum 4.8 1.59 93 683 34 ppt
Toluene C7H+8 M+ (89 %) 92.062 3.5 1.33 110 825 22 ppt 47 ppt
C7H8NO+ M+NO+ (8%) 122.060
o-Xylene C8H+10 M
+ (94 %) 106.078 1.3 1.51 121 972 17 ppt 40 ppt
C8H10NO+ M+NO+ (5%) 136.076
1,2,4- C9H+12 M
+ (100 %) 120.093 0.86 1.75 125 1068 17 ppt 45 ppt
Trimethylbenzene
n-Pentadecanec C15H+31 M-H
− (72 %) 211.242 2.7 1.83 48 512 46 ppt –
C9H+19 fragment (3%) 127.148
C10H+21 fragment (3%) 141.164
C8H+17 fragment (3%) 113.132
EIMS (Table 2). Direct calibrations were performed by mix-ing a known concentration of a VOC from either a perme-ation cell (pentadecane) or a calibrperme-ation gas cylinder (other VOCs) into an ambient humidity (∼20 %) high-purity air dilution stream. Calibration factors estimated from sensi-tivity relative to H3O+CIMS were calculated using H3O+
ToF-CIMS calibration factors and results from laboratory GC-CIMS experiments (Sect. 3.1.1). Calibration factors for H3O+ ToF-CIMS were determined in previous work (Yuan
et al., 2016). These calibration factors were multiplied by the relative peak areas determined in Sect. 3.1.1 to obtain estimated NO+ToF-CIMS calibration factors. (An example
chromatogram and calculation is shown in Fig. S5.) Calibra-tion factors estimated from correlaCalibra-tion with GC-EIMS were calculated from the slope of NO+ToF-CIMS measurements against GC-EIMS measurements in ambient air (discussed in further detail in Sect. 3.2.2).
Table 2.Continued.
(b)Sensitivity estimated via sensitivity relative to H3O+CIMS; 20 % relative humidity
NO+
H3O+
H3O+
Product ions
Relative Back- Noise sensitivity NO+1 s CIMS 1 s
cps/ Mech- (% of total Exactm/z (NO+cps/ ground scale ncps/ cps/ detection detection
VOC species ppb Formula anism signal) (Th) H3O+cps) cps factorα ppb ppb limit limit
Ethanol 119 C2H5O+ M-H− (80 %) 45.033 6.2 149 1.37 127 738 105 ppt 1627 ppt
C2H7O+2 M-H+H2O (15%) 63.044
Methyl- 27 C7H+13 M-H− (98 %) 97.101 17 6.6 1.32 53 448 50 ppt 943 ppt
cyclohexane C6H+11 fragment (2%) 83.086
MVK 539 C4H6ONO+ M+NO+ (100 %) 100.039 0.38 4 1.71 24 202 112 ppt 85 ppt
Pentanone 770 C5H10ONO+ M+NO+ (83 %) 116.071 1.18 4.4 1.32 97 906 21 ppt 47 ppt
C5H10OH+
a
M+H+ (7%) 87.080
α-Pinene 262 C10H+16 M+ (59 %) 136.125 0.28 0.39 1.69 7.3 73 233 ppt 67 ppt
C7H+8 fragment (24%) 92.062
C7H+9 fragment (11%) 93.070
C10H16H+a M+H+ (7%) 137.132
(c)Sensitivity estimated via correlation with GC-EIMS; ambient (20 %) relative humidity
Product ions Back- Noise NO+Sensitivity NO+1 s
VOC species Formula Mech- (% of total Exactm/z Correlation ground scale ncps/ cps/ detection
anism signal) (Th) with GC (R2) cps factorα ppb ppb limit
Propanal C3H5O+ M-H− (65 %) 57.033 0.928 11 1.40 170 1057 26 ppt
C3H7O+2a M-H+H2O (17%) 75.044
C3H6OH+a M+H+ (7%) 59.049
Methacrolein+ C4H5O+ M-H− (64 %) 69.033 0.984 4.1 1.37 48 325 60 ppt
crotonaldehyde C4H6ONO+ M+NO+ (16%) 100.039
C3H+5 fragment (10%) 41.039
Isopentane C5H+11 M-H
− (82 %) 71.086 0.888 23 1.36 101 706 49 ppt
C3H+7 fragment (11%) 43.054
Methylcyclo- C6H+11 M-H− (99 %) 83.086 0.961 7.4 1.34 154 1225 18 ppt
pentane
C5aldehydes C5H9O+ M-H− (49 %) 85.065 0.936 9.8 1.38 119 904 28 ppt
C4H+9 fragment (22%) 57.070
C5H11O+
a
2 M-H+H2O (19%) 103.075
2- and 3- C6H+13 M-H− (82 %) 85.101 0.978 16 1.34 122 981 30 ppt
methylpentane C3H+7 fragment (10%) 43.054
C4H++9 fragment (4%) 57.070
Hexanal C6H11O+ M-H− (49 %) 99.080 0.945 10 1.47 160 1270 22 ppt
C6H13O+2a M-H+H2O (23%) 117.091
C5H+11 fragment (15%) 71.086
Styrene C8H+8 M
+ (100 %) 104.062 0.949 0.62 1.47 112 966 15 ppt
Benzaldehyde C7H5O+ M-H− (100 %) 105.033 0.923 12 1.37 75 621 43 ppt
aProduct from residual H
3O+.bBoth product ions can be unambiguously assigned to benzene. We therefore report also the counting statistics and limit of detection for the sum of the two ions.cFor technical reasons, pentadecane sensitivity was determined in dry air.
correction was applied (Chernushevich et al., 2001):
Icorr=cps×
s
m/zreference
m/z , (1)
where Icorr is the duty-cycle-corrected ion count rate and
m/zreference is an arbitrary reference mass (in this work
m/zreference≡55). The duty-cycle correction accounts for
the ToF and eliminates a mass-dependent sensitivity bias. Then, measurements were normalized to the duty-cycle-corrected NO+(primary ion) measurement, which typically
has count rates on the order of 106above that of VOCs: ncps=106 Icorr
NO+corr. (2)
The normalization removes variability due to fluctuations in the ion source and detector. In calculating limits of detec-tion, we use duty-cycle-uncorrected cps, as this best reflects the fundamental counting statistics of the instrument. In re-porting ambient air measurements, we use ncps. The ncps measurement reduces several significant instrumental biases and better reflects VOC abundances in air.
Limits of detection at 1 Hz measurement frequency were calculated by finding the mixing ratio at which the signal-to-noise ratio (S/N) is equal to 3. The calculation can be expressed by (Bertram et al., 2011; Yuan et al., 2016)
S N =3=
Cf[X]lodt
α×√Cf[X]lodt+2Bt
, (3)
whereCf is the instrument response factor, in cps per ppb; [X]lodis the limit-of-detection mixing ratio of speciesXin ppb;tis the sampling period of 1 s;αis the scaling factor of noise compared to expected Poissonian counting statistics; andBis the background count rate in cps. The scaling fac-torαis generally greater than 1 because high-resolution peak overlap and fitting algorithms create additional noise (Cubi-son and Jimenez, 2015). For compari(Cubi-son, H3O+ToF-CIMS
limits of detection, using the same ToF-CIMS instrument, are included where available.
Aliphatics and aromatics are generally detected quite sen-sitively. Aromatics have sub-100 ppt detection limits and are detected slightly more sensitively with NO+CIMS than with H3O+ CIMS, with NO+ detection limits generally about
30 % lower. Aliphatic species are detected with quite low de-tection limits (less than 50 ppt) and with substantially better sensitivity than H3O+: the detection limit of
methylcyclo-hexane using NO+is a factor of 27 lower than with H3O+.
Aldehydes and ketones also have detection limits of around 100 ppt or less, with the exception of acetaldehyde (lod=355 ppt). The higher detection limit of acetaldehyde is due to a somewhat higher instrumental background and a lower response factor that is consistent with reaction kinet-ics (Španˇel et al., 1997). Methanol has a very high detection limit (19 ppb); this is expected from the anomalously low rate constant of the methanol–NO+reaction (Španˇel and Smith, 1997). In contrast, ethanol is detected far more sensitively with NO+than with H3O+, with a detection limit of 105 ppt
(compared to 1600 ppt for H3O+).
3.1.5 Humidity dependence
Humidity-dependent behaviors of primary ions and selected VOCs (acetaldehyde, acetone, isoprene, 2-butanone, ben-zene, toluene, o-xylene, and 1,3,5-trimethylbenzene) were
5x10⁶
4
3
2
1
0
Signal (cps)
60 40 20 0
1.5x10³
1.0
0.5
0.0
Signal (cps)
60 40 20 0
3x10³
2
1
0
Signal (cps)
60 40 20 0
Relative humidity (%)
2.0x10³
1.5
1.0
0.5
0.0
Signal (cps)
60 40 20 0
Relative humidity (%)
(a) Primary ions (b) Isoprene
(c) MEK (d) Benzene
m/z 30 NO+
m/z 37 H2O•H3O+
m/z 68 C5H8+
m/z 98 C5H8•NO+
m/z 102 C4H8O•NO+
m/z 73 C4H8OH+
m/z 108 C6H6•NO+
m/z 78 C6H6+
m/z 79 C6H6H+
m/z 69 C5H8H+ m/z 67 C5H7
Figure 7.Humidity dependence of primary ions and selected VOCs.
(a)NO+and water clusters;(b)isoprene;(c)methyl ethyl ketone (MEK);(d)benzene.
determined by diluting a VOC calibration standard into hu-midified air to reach approximately 10 ppb mixing ratio, then sampling directly with the NO+ToF-CIMS. Air temperature was 27◦C. Product ion and signal dependencies on humid-ity for selected primary ions and VOCs are shown in Fig. 7 (additional species are included in Fig. S6). As relative hu-midity increases, NO+(m/z30) remains relatively constant, while protonated water and protonated water clusters (espe-ciallym/z37, H5O+2)increase. As the abundance of H3O+
in the drift tube increases, one might expect to see increased products of VOC reaction with H3O+ with a corresponding
decrease in NO+ products. Although an increase of H3O+
product is seen for some species (e.g., MEK), it is not uni-versally true. For many species, the major effect is that the NO+ adduct product increases relative to other NO+ prod-uct ions. This effect is especially intense for isoprene, where the isoprene–NO+cluster (m/z98, C5H8NO+)increases by
a factor of 10 from 0 to 70 % relative humidity. A simi-lar humidity effect, observed during SIFT measurements of alkenes, has been reported previously by Diskin et al. (2002), who attributed the effect to better stabilization of excited in-termediary (NO+·R)∗ ions by H2O. A full investigation of
this effect is beyond the scope of this paper. In lieu of a com-plete theoretical understanding of humidity effects, we sug-gest that an experimental humidity correction could be ap-plied as in Yuan et al. (2016).
3.2 Measurements of urban air
3.2.1 GC-NO+CIMS measurements
800
600
400
200
0
Signal (normalized cps)
1000 950 900 850 800 750 700
Retention time (s)
Branched & cyclic alkanes m57 C4H9 (x2)
m85 C6H13
m83 C6H11 (x3)
m97 C7H13 (x5)
m71 C5H11
Methylcyclopentane
Methylcyclohexane
Dimethylcyclopentanes
2- and 3-methyl pentanes
i-pentane
2- and 3-methyl Heptanes Hexanal
2-methylhexane
i-butane
Hexane
Trimethylpentanes
400
300
200
100
0
Signal (normalized cps)
1000 950
900 850 800 750 700
Retention time (s)
Aldehydes Ketones
m55 C3H3O m88 C3H6O•NO (x0.1)
m57 C3H5O m100 C4H6O•NO (x5)
m69 C4H5O (x5) m102 C4H8O•NO
m71 C4H7O m116 C5H10O•NO (x2)
m85 C5H9O (x2) m130 C6H12O•NO (x5)
m99 C6H11O
Propanal
AcetoneAcetone
2-butanone (MEK)
Acetone
3-hexanone
Butanal 2-butanol
Hexanal
Pentanal
Methacrolein Methyl vinyl ketone
Crotonaldehyde 4-methyl,2-pentanone 2-pentanone 3-pentanone
3-methyl,2-butanone
Acrolein
Figure 8.Example GC-CIMS chromatogram of ambient air sample.
Masses have been split between two panels for clarity. Top: select masses corresponding to branched and cyclic alkanes. Bottom: se-lect masses corresponding to aldehydes and ketones.
which masses. This is the essential link between laboratory measurements of calibration standards and interpretation of ambient NO+ ToF-CIMS measurements. Ambient air from outside the laboratory was sampled from 27 to 30 October 2015 through an inlet 3 m above ground level and directed through 10 m of 1/2 in. diameter Teflon tubing at a flow rate of 17 standard L min−1 (residence time approximately 4 s). The GC interface subsampled this stream. Eluant from the column was directed into the NO+ ToF-CIMS as described in Sect. 2.1. The laboratory is in an urban area (Boulder, CO) and the inlet was located near a parking lot and load-ing dock. Absolute instrument background (includload-ing the GC interface) was determined by sampling zero air at the begin-ning and end of the 3-day measurement period. Instrument performance and stability, retention times of selected com-pounds, and instrument background were checked at least once per day by sampling a 56-component hydrocarbon cal-ibration standard.
Figure 8 shows several masses from a typical chro-matogram. In this chromatogram, it is clear, for instance, that the majority of signal from m/z83 (C6H+11)can be
at-tributed to one compound (methylcyclopentane). In contrast, m/z57 (C4H+9)is produced from many different compounds
with comparable intensities. Aldehydes and ketones appear
1.0
0.5
0.0
Fraction of total signal
10/28/2015 10/29/2015 10/30/2015
MDT 1.0
0.5
0.0
Fraction of total signal
1.0x10⁻² 0.5 0.0 Total signal
4x10⁻²
2 0 Total signal
Iso-butane 2-methylhexane
3-methylhexane
pentane
Methylpentanes Other
Contributions to m/z 57.070 C4H9+
3-methylhexane
Contributions to m/z 83.086 C6H11+
pentane
Other
(a)
(b)
Figure 9.Contributions to two masses based on GC-CIMS
mea-surements of ambient air. “Total signal” is normalized counts per chromatogram.(a)m/z57 C4H+9;(b)m/z83 C6H+11.
to be well separated, as expected from the laboratory exper-iments. Figure 9 summarizes the contributions of different VOCs to several ions (m/z57, C4H+9 andm/z83 C6H+11)
during the entire 3-day measurement period.M/z57 (C4H+9)
has contributions from many different VOCs, and the rel-ative proportions are highly variable. Conversely, m/z83 (C6H+11) is mostly attributable to methylcyclopentane
dur-ing the majority of the 3-day measurement period.M/z57 (C4H+9)does not provide a useful measurement of alkanes,
whilem/z83 (C6H+11)may possibly provide a useful
mea-surement of methylcyclopentane. Corresponding figures for other masses can be found in the supplemental information (Figs. S7–S9). Table 3 summarizes our assessment of key ions.
3.2.2 NO+CIMS vs. GC-EIMS measurement comparison
Measurements using the GC interface do not provide any in-formation about the fast time response capability of the NO+ ToF-CIMS. Additionally, not all compounds detectable by NO+ CIMS and present in ambient air can be transmitted through the GC interface. Simultaneous GC-EIMS and NO+ ToF-CIMS measurements were conducted to investigate fast NO+ measurements, determine whether there are any sig-nificant interferences to key NO+masses, and explore NO+ CIMS response to VOCs not transmittable through the GC interface.
Ambient air was sampled into the laboratory as described in the previous section. The GC-EIMS and the NO+
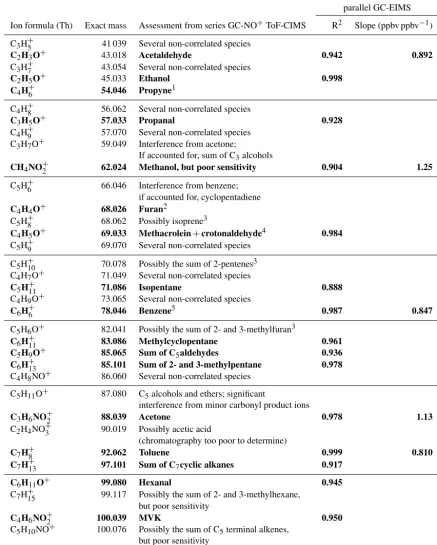
Instru-Table 3.Assessment of significant product ions investigated by GC-NO+CIMS and parallel GC-EIMS and NO+CIMS measurement of ambient air. Masses in bold can be unambiguously assigned to a single VOC or a structurally related, correlated group of VOCs.
Correlation with parallel GC-EIMS
Ion formula (Th) Exact mass Assessment from series GC-NO+ToF-CIMS R2 Slope (ppbv ppbv−1)
C3H+5 41 039 Several non-correlated species
C2H3O+ 43.018 Acetaldehyde 0.942 0.892
C3H+7 43.054 Several non-correlated species
C2H5O+ 45.033 Ethanol 0.998
C4H+6 54.046 Propyne1
C4H+8 56.062 Several non-correlated species
C3H5O+ 57.033 Propanal 0.928
C4H+9 57.070 Several non-correlated species
C3H7O+ 59.049 Interference from acetone;
If accounted for, sum of C3alcohols
CH4NO+2 62.024 Methanol, but poor sensitivity 0.904 1.25
C5H+6 66.046 Interference from benzene;
if accounted for, cyclopentadiene
C4H4O+ 68.026 Furan2
C5H+8 68.062 Possibly isoprene3
C4H5O+ 69.033 Methacrolein+crotonaldehyde4 0.984
C5H+9 69.070 Several non-correlated species
C5H+10 70.078 Possibly the sum of 2-pentenes3
C4H7O+ 71.049 Several non-correlated species
C5H+11 71.086 Isopentane 0.888
C4H9O+ 73.065 Several non-correlated species
C6H+6 78.046 Benzene5 0.987 0.847
C5H6O+ 82.041 Possibly the sum of 2- and 3-methylfuran3
C6H+11 83.086 Methylcyclopentane 0.961
C5H9O+ 85.065 Sum of C5aldehydes 0.936
C6H+13 85.101 Sum of 2- and 3-methylpentane 0.978
C4H8NO+ 86.060 Several non-correlated species
C5H11O+ 87.080 C5alcohols and ethers; significant
interference from minor carbonyl product ions
C3H6NO+2 88.039 Acetone 0.978 1.13
C2H4NO+3 90.019 Possibly acetic acid
(chromatography too poor to determine)
C7H+8 92.062 Toluene 0.999 0.810
C7H+13 97.101 Sum of C7cyclic alkanes 0.917
C6H11O+ 99.080 Hexanal 0.945
C7H+15 99.117 Possibly the sum of 2- and 3-methylhexane,
but poor sensitivity
C4H6NO+2 100.039 MVK 0.950
C5H10NO+ 100.076 Possibly the sum of C5terminal alkenes,
but poor sensitivity
C4H8NO+2 102.055 MEK 0.971 0.843
ment zeros were taken for a 2 min period once every hour (example time series with zeros in Fig. S10). Calibration gas from a 10-component hydrocarbon standard was sampled for
Table 3.Continued.
Correlation with parallel GC-EIMS
Ion formula (Th) Exact mass Assessment from series GC-NO+ToF-CIMS R2 Slope (ppbv ppbv−1)
C8H+8 104.062 Styrene (vinyl benzene) 0.949
C7H5O+ 105.033 Benzaldehyde 0.923
C8H+10 106.078 Sum of C8aromatics 0.952 0.746
C6H6NO+ 108.044 Benzene5
C8H+15 111.117 Possibly the sum of C2alkyl-substituted 0.761
cyclohexanes6
C7H13O+ 113.096 Heptanal2
C8H+17 113.132 Possibly the sum of methylheptanes,
but poor sensitivity
C5H10NO+2 116.071 Sum of C5ketones 0.945
C9H+10 118.078 Possibly the sum of methylstyrene isomers3
C9H+12 120.093 Sum of C9aromatics; scatter possibly 0.600
due to disparity in response factors
C8H15O+ 127.112 Octanal2
C6H12NO+2 130.086 Possibly the sum of C6ketones3
C10H+14 134.109 Possibly the sum of C10aromatics
C10H+16 136.125 Monoterpenes plus unknown interference; 0.584
possibly adamantane from vehicle exhaust
C7H14NO+2 144.102 Heptanone2
1Cross-comparison with independent GC-EIMS not possible due to chromatographic quantitation ion overlap with neighboring peaks.
2Cross-comparison with independent GC-EIMS not possible due to EIMS quadrupole selected-ion scan window restrictions.3Concentrations too
low in ambient air to determine.4Winter urban air sampled was likely influenced by local domestic biomass burning; crotonaldehyde may be a smaller fraction of signal in other environments.5Benzene correlation using sum of m108 C6H6NO+and m78 C6H+6.6With exclusion of single
outlier,R2=0.831.
(three GC samples) to investigate the NO+ ToF-CIMS
re-sponse to air with a VOC composition substantially different from urban air.
For all comparisons between the two instruments, the 1 Hz NO+ToF-CIMS measurements were averaged over the 5 min GC-EIMS collection period. The NO+ToF-CIMS was calibrated using air with ambient humidity (approximately 20 %) for the 10 species listed in Table 2a, and no further humidity correction was applied. Correlations between in-dependent GC and calibrated CIMS measurements gener-ally show a high correlation coefficient (R2>0.9) and slopes close to 1 (examples in Fig. 10a, b). This demonstrates that an adapted NO+CIMS instrument retains sensitive measure-ment of atmospherically important species such as aromat-ics that are often targeted using PTR-MS and in addition can detect compounds such as isopentane, sum of 2- and 3-methylpentane, methylcyclopentane, and sum of C7 cyclic
alkanes (Fig. 10c–f) that are usually not detected with PTR-MS. Slopes for calibrated VOCs, and correlation coefficients (R2)for all VOCs investigated, are included in Table 3. The good agreement also indicates that humidity dependence of sensitivity is likely not a severe effect for most species;
how-ever, addressing and quantifying this effect should be a pri-ority for future work.
To assess the ability of the NO+ToF-CIMS to separate ke-tones and aldehydes, we explore measurements of propanal and acetone. The separate measurement of these two species is a good test case because the two peaks are chromatograph-ically well resolved on the GC-EIMS, there are few isomers of C3H6O (of which acetone and propanal are likely the only
atmospherically relevant species), and independent measure-ments of these two species are interesting for scientific rea-sons: aldehydes are generally much more reactive with OH than their ketone isomers and may have significantly differ-ent behavior in the atmosphere (Atkinson and Arey, 2003).
0.01 2 4 0.1 2 4 1 2 4 10
NO+ CIMS toluene, ppbv
0.012 4 60.12 4 61 2 4 610 GC-EIMS toluene, ppbv
6 0.01 2 4 6 0.1 2 4 6 1 2
NO+ CIMS C8 aromatics, ppbv 6
0.012 4 60.12 4 61 2 GC-EIMS sum of C8 aromatics, ppbv
2 4 6 8 10 2 4 6 8
NO+ CIMS m71 C5H11, ncps 2 4 68 0.1 2 4 68 GC-EIMS i-pentane, ppbv
1 2 4 6 8 10 2 4 6 8 100
NO+ CIMS m85 C6H13, ncps 6 8
0.012 46 80.12 46 81 GC-EIMS sum of methylpentanes, ppbv 4 6 1 2 4 6 10 2 4 6
NO+ CIMS m83 C6H11, ncps0.0012 4 60.012 4 60.12 4 GC-EIMS methylcyclopentane, ppbv
1 2 3 4 5 6 10 2
NO+ CIMS m97 C7H13, ncps 2 3 456 7 8 9
0.1 2
GC-EIMS sum of C7 cyclic alkanes, ppbv
(b) C8 aromatics
(a) Toluene (c) Iso-pentane
(d) 2- and 3-methylpentane
(e) Methylcyclo-pentane
R2 = 0.89
R2 = 0.98
R2 = 0.96
R2 = 0.92 (f) C7 cyclic alkanes
R2 = 0.999 Slope = 0.81
R2
= 0.95 Slope = 0.76
Figure 10.Correlations between VOCs measured with GC-EIMS
and NO+ ToF-CIMS in ambient air. The 1 Hz NO+ ToF-CIMS measurement is averaged to the 5 min GC collection period. Or-thogonal least-squares linear best fits (ODR best fit) are shown with dashed lines. The lines appear curved due to log-scale axes. For several compounds (e.g., methylcyclopentane, 2- and 3-methylpentane), the single high outlier pulls the best fit slightly away from the data points at low mixing ratios.(a)Toluene.(b)C8
aromatics: sum of ethylbenzene, o-xylene, m-xylene, and p-xylene.
(c)Isopentane.(d)Sum of 2-methylpentane and 3-methylpentane.
(e)Methylcyclopentane.(f)C7cyclic alkanes: sum of
methylcyclo-hexane, ethylcyclopentane, and dimethylcyclopentane.
offset. The comparison between the GC and CIMS propanal measurements has anR2of 0.928 (Fig. 11b, c).
Several episodes occurred with elevated high-mass n-alkane masses (m/z169 C12H+25, dodecane; m/z183
C13H+27, tridecane; m/z197 C14H+29, tetradecane; m/z211
C15H+31, pentadecane). Two examples are shown in Fig. 12.
The episodes show high temporal and compositional vari-ability. The inlet was downwind from a parking lot and next to a loading dock and electric power generator for the build-ing, and it is likely that the elevated C12–C15 alkanes are
from any or all of these sources. An ambient air measure-ment of these species is particularly interesting because they have been implicated in efficient secondary organic aerosol production from diesel fuel exhaust (Gentner et al., 2012).
4 Summary and conclusions
In summary, an H3O+ToF-CIMS (PTR-MS) instrument was
easily and inexpensively converted into an NO+CIMS by
re-placing the reagent source gas and modifying the ion source and drift tube voltages. The usefulness of NO+CIMS for at-mospheric VOC measurement was then evaluated by (1) us-ing a GC interface to determine product ion distributions for nearly 100 VOCs and compare the sensitivity and simplic-ity of spectra to H3O+ CIMS; (2) measuring ambient air
with a GC interface, to map product ions to their VOC pre-cursors and determine which ions may be useful for
chem-10 8 6 4 2 0 Acetone, ppbv 12:00 PM 11/4/2015
06:00 PM 12:00 AM 11/5/2015 06:00 AM MST 25 20 15 10 5 0 m57 C 3H 5O + , ncps 0.20 0.15 0.10 0.05 0.00 Propanal, ppbv 7 6 5 4 3 2 1 0
ToF-CIMS acetone, ppbv
7 6 5 4 3 2 1 0
GC-EIMS acetone, ppbv
30 25 20 15 10 5 0
ToF-CIMS m57 C
3 H5 O + (ncps) 0.20 0.15 0.10 0.05 0.00
GC-EIMS propanal, ppbv
Acetone GC-EIMS
ToF-CIMS (average to GC schedule) ToF-CIMS (5 second average)
Propanal GC-EIMS ToF-CIMS (average to
GC schedule)
ToF-CIMS (5 second average)
(1:1) (a)
(b) (c)
Figure 11. (a)Time series of acetone and propanal measurements
from NO+ToF-CIMS and GC-EIMS in ambient air. Measurements shown include the GC-EIMS measurement (5 min sample every 30 min, circle markers), the NO+ ToF-CIMS measurement aver-aged over the 5 min GC sampling period (cross markers), and the NO+ ToF-CIMS measurement averaged to a 5 s running mean.
(b)Correlation between NO+ToF-CIMS and GC-EIMS measure-ment of acetone.(c)Correlation between NO+ToF-CIMS and GC-EIMS measurement of propanal.
15 10 5 0 Acetone, ppbv 12:00 AM 11/4/2015
03:00 AM 06:00 AM MST 15 10 5 0 Acetone, ppbv 02:15 PM 11/3/2015
02:30 PM 02:45 PM MST 0.50 0.25 0.00 benzene, ppbv 0.50 0.25 0.00 Benzene, ppbv 0.20 0.15 0.10 0.05 0.00
Mixing ratio, ppbv
0.4
0.3
0.2
0.1
0.0
Mixing ratio, ppbv
m/z169 C12H25+ m/z183 C13H27+ m/z197 C14H29+ Pentadecane
Figure 12.Episodes with elevated high-mass alkane masses in
am-bient air. Mixing ratios form/z169 C12H+25(dodecane),m/z183
C13H+27 (tridecane), andm/z197 C14H+29(tetradecane) are shown in approximate ppbv, assuming the same instrument calibration fac-tor as pentadecane. Additional VOC species (benzene, acetone) are shown in the bottom panels for context.
vari-able humidity was determined in some detail. Further work is needed to better understand the humidity dependence.
NO+CIMS is a valuable technique for atmospheric
mea-surement because it can separate small carbonyl isomers, it can provide fast and chemically specific measurement of cyclic and a few important branched alkanes (notably, isopentane and methylpentane) that cannot be detected by PTR-MS, it can measure alkyl-substituted aromatics with less fragmentation than H3O+CIMS, and it can detect larger
(C12–C15) alkanes. With NO+CIMS significant
fragmenta-tion of most small alkanes does occur, making them diffi-cult to measure quantitatively. There are also interferences on many alcohols (with the exception of ethanol) and bu-tanal. Additionally, it is worth considering that VOC·NO+ cluster formation moves certain species into a higher mass range. This may be a drawback because the number of pos-sible isobaric compounds increases with mass, and it may be more difficult for high-resolution peak-fitting algorithms to separate species of interest from isobaric interferences (ex-ample in Fig. S11). Finally, because there are three differ-ent ionization mechanisms (hydride transfer, charge trans-fer, and NO+adduct formation), it may be difficult to deter-mine which VOC precursors correspond to particular ions. NO+CIMS may be an extremely useful supplementary ap-proach for specific applications such as studying secondary organic aerosol precursors in vehicle exhaust, investigating emissions from oil and natural gas extraction, identifying ad-ditional species in complex emissions such as biomass burn-ing, measuring emissions of oxygenated consumer products and solvents in urban areas, and investigating photochemistry of biogenic VOCs.
The Supplement related to this article is available online at doi:10.5194/amt-9-2909-2016-supplement.
Author contributions. P. Veres and C. Warneke obtained CIRES
IRP project funding. B. Yuan, A. Koss, C. Warneke, and J. de Gouw developed the ToF-CIMS instrument. A. Koss converted the in-strument from H3O+to NO+, designed the experiments, collected
data, and wrote the manuscript. A. Koss and M. Coggon analyzed data. C. Warneke and J. de Gouw provided guidance on experimen-tal design and interpretation. All authors edited the manuscript.
Acknowledgements. This work was funded by the CIRES
Inno-vative Research Program. A. R. Koss acknowledges additional support from the NSF Graduate Fellowship Program. We would like to thank J. B. Gilman and B. M. Lerner for help with GC operation and data analysis.
Edited by: P. Herckes
Reviewed by: three anonymous referees
References
Agarwal, B., González-Méndez, R., Lanza, M., Sulzer, P., Märk, T. D., Thomas, N., and Mayhew, C. A.: Sensitivity and Selectivity of Switchable Reagent Ion Soft Chemical Ionization Mass Spec-trometry for the Detection of Picric Acid, J. Phys. Chem. A, 118, 8229–8236, doi:10.1021/jp5010192, 2014.
Arnold, S. T., Viggiano, A. A., and Morris, R. A.: Rate Constants and Product Branching Fractions for the Reactions of H3O+and
NO+with C2-C12Alkanes, J. Phys. Chem. A, 102, 8881–8887,
doi:10.1021/jp9815457, 1998.
Atkinson, R. and Arey, J.: Atmospheric degradation of volatile or-ganic compounds, Chem. Rev., 103, 4605–4638, 2003.
Bertram, T. H., Kimmel, J. R., Crisp, T. A., Ryder, O. S., Yatavelli, R. L. N., Thornton, J. A., Cubison, M. J., Gonin, M., and Worsnop, D. R.: A field-deployable, chemical ionization time-of-flight mass spectrometer, Atmos. Meas. Tech., 4, 1471–1479, doi:10.5194/amt-4-1471-2011, 2011.
Blake, R. S., Wyche, K. P., Ellis, A. M., and Monks, P. S.: Chem-ical ionization reaction time-of-flight mass spectrometry: Multi-reagent analysis for determination of trace gas composition, Int. J. Mass Spectrom., 254, 85–93, doi:10.1016/j.ijms.2006.05.021, 2006.
Buhr, K., van Ruth, S., and Delahunty, C.: Analysis of volatile flavour compounds by Proton Transfer Reaction-Mass Spectrom-etry: fragmentation patterns and discrimination between isobaric and isomeric compounds, Int. J. Mass Spectrom., 221, 1–7, doi:10.1016/S1387-3806(02)00896-5, 2002.
Chernushevich, I. V., Loboda, A. V., and Thomson, B. A.: An intro-duction to quadrupole–time-of-flight mass spectrometry, J. Mass Spectrom., 36, 849–865, doi:10.1002/jms.207, 2001.
Cubison, M. J. and Jimenez, J. L.: Statistical precision of the in-tensities retrieved from constrained fitting of overlapping peaks in high-resolution mass spectra, Atmos. Meas. Tech., 8, 2333– 2345, doi:10.5194/amt-8-2333-2015, 2015.
de Gouw, J. and Warneke, C.: Measurements of volatile organic compounds in the earth’s atmosphere using proton-transfer-reaction mass spectrometry, Mass. Spectrom. Rev., 26, 223–257, doi:10.1002/mas.20119, 2007.
DeCarlo, P. F., Kimmel, J. R., Trimborn, A., Northway, M. J., Jayne, J. T., Aiken, A. C., Gonin, M., Fuhrer, K., Horvath, T., Docherty, K. S., Worsnop, D. R., and Jimenez, J. L.: Field-Deployable, High-Resolution, Time-of-Flight Aerosol Mass Spectrometer, Anal. Chem., 78, 8281–8289, doi:10.1021/ac061249n, 2006. Diskin, A. M., Wang, T., Smith, D., and Španˇel, P.: A selected ion
flow tube (SIFT), study of the reactions of H3O+, NO+and O+2
ions with a series of alkenes; in support of SIFT-MS, Int. J. Mass Spectrom., 218, 87–101, doi:10.1016/S1387-3806(02)00662-0, 2002.
Erickson, M. H., Gueneron, M., and Jobson, B. T.: Measuring long chain alkanes in diesel engine exhaust by thermal desorption PTR-MS, Atmos. Meas. Tech., 7, 225–239, doi:10.5194/amt-7-225-2014, 2014.
Fehsenfeld, F. C., Mosesman, M., and Ferguson, E. E.: Ion– Molecule Reactions in NO+–H2O System, J. Chem. Phys., 55,
2120–2125, doi:10.1063/1.1676383, 1971.
Francis, G. J., Milligan, D. B., and McEwan, M. J.: Gas-Phase Re-actions and Rearrangements of Alkyl Esters with H3O+, NO+,
Francis, G. J., Wilson, P. F., Milligan, D. B., Langford, V. S., and McEwan, M. J.: GeoVOC: A SIFT-MS method for the analysis of small linear hydrocarbons of relevance to oil exploration, Int. J. Mass Spectrom., 268, 38–46, doi:10.1016/j.ijms.2007.08.005, 2007b.
Gentner, D. R., Isaacman, G., Worton, D. R., Chan, A. W. H., Dall-mann, T. R., Davis, L., Liu, S., Day, D. A., Russell, L. M., Wil-son, K. R., Weber, R., Guha, A., Harley, R. A., and Goldstein, A. H.: Elucidating secondary organic aerosol from diesel and gasoline vehicles through detailed characterization of organic carbon emissions, P. Natl. Acad. Sci. USA, 109, 18318–18323, doi:10.1073/pnas.1212272109, 2012.
Gilman, J. B., Burkhart, J. F., Lerner, B. M., Williams, E. J., Kuster, W. C., Goldan, P. D., Murphy, P. C., Warneke, C., Fowler, C., Montzka, S. A., Miller, B. R., Miller, L., Oltmans, S. J., Ry-erson, T. B., Cooper, O. R., Stohl, A., and de Gouw, J. A.: Ozone variability and halogen oxidation within the Arctic and sub-Arctic springtime boundary layer, Atmos. Chem. Phys., 10, 10223–10236, doi:10.5194/acp-10-10223-2010, 2010.
Gilman, J. B., Lerner, B. M., Kuster, W. C., and de Gouw, J. A.: Source signature of volatile organic compounds from oil and nat-ural gas operations in northeastern Colorado, Environ. Sci. Tech-nol., 47, 1297–1305, doi:10.1021/es304119a, 2013.
Glasius, M. and Goldstein, A. H.: Recent Discoveries and Future Challenges in Atmospheric Organic Chemistry, Environ. Sci. Technol., 50, 2754–2764, doi:10.1021/acs.est.5b05105, 2016. Goldan, P. D., Kuster, W. C., Williams, E., Murphy, P. C.,
Fehsen-feld, F. C., and Meagher, J.: Nonmethane hydrocarbon and oxy hydrocarbon measurements during the 2002 New England Air Quality Study, J. Geophys. Res.-Atmos., 109, 2156–2202, doi:10.1029/2003JD004455, 2004.
Graus, M., Müller, M., and Hansel, A.: High Resolution PTR-TOF: Quantification and Formula Confirmation of VOC in Real Time, J. Am. Soc. Mass Spectr., 21, 1037–1044, doi:10.1016/j.jasms.2010.02.006, 2010.
Gueneron, M., Erickson, M. H., VanderSchelden, G. S., and Jobson, B. T.: PTR-MS fragmentation patterns of gaso-line hydrocarbons, Int. J. Mass Spectrom., 379, 97–109, doi:10.1016/j.ijms.2015.01.001, 2015.
Inomata, S., Tanimoto, H., and Yamada, H.: Mass Spectrometric Detection of Alkanes Using NO+Chemical Ionization in Proton-transfer-reaction Plus Switchable Reagent Ion Mass Spectrome-try, Chem. Lett., 43, 538–540, doi:10.1246/cl.131105, 2013. Jobson, B. T., Alexander, M. L., Maupin, G. D., and Muntean, G.
G.: On-line analysis of organic compounds in diesel exhaust us-ing a proton transfer reaction mass spectrometer (PTR-MS), Int. J. Mass Spectrom., 245, 78–89, doi:10.1016/j.ijms.2005.05.009, 2005.
Jordan, A., Haidacher, S., Hanel, G., Hartungen, E., Herbig, J., Märk, L., Schottkowsky, R., Seehauser, H., Sulzer, P., and Märk, T. D.: An online ultra-high sensitivity Proton-transfer-reaction mass-spectrometer combined with switchable reagent ion capa-bility (PTR+SRI−MS), Int. J. Mass Spectrom., 286, 32–38, doi:10.1016/j.ijms.2009.06.006, 2009a.
Jordan, A., Haidacher, S., Hanel, G., Hartungen, E., Märk, L., See-hauser, H., Schottkowsky, R., Sulzer, P., and Märk, T. D.: A high resolution and high sensitivity proton-transfer-reaction time-of-flight mass spectrometer (PTR-TOF-MS), Int. J. Mass Spec-trom., 286, 122–128, doi:10.1016/j.ijms.2009.07.005, 2009b.
Karl, T., Hansel, A., Cappellin, L., Kaser, L., Herdlinger-Blatt, I., and Jud, W.: Selective measurements of isoprene and 2-methyl-3-buten-2-ol based on NO+ ionization mass spectrom-etry, Atmos. Chem. Phys., 12, 11877–11884, doi:10.5194/acp-12-11877-2012, 2012.
Katzenstein, A. S., Doezema, L. A., Simpson, I. J., Blake, D. R., and Rowland, F. S.: Extensive regional atmospheric hydrocarbon pollution in the southwestern United States, P. Natl. Acad. Sci. USA, 100, 11975–11979, doi:10.1073/pnas.1635258100, 2003. Keesee, R. G. and Castleman, A. W.: Thermochemical Data on
Gas-Phase Ion-Molecule Association and Clustering Reactions, J. Phys. Chem. Ref. Data, 15, 1011, doi:10.1063/1.555757, 1986. Knighton, W. B., Fortner, E. C., Herndon, S. C., Wood, E. C., and Miake-Lye, R. C.: Adaptation of a proton transfer reaction mass spectrometer instrument to employ NO+as reagent ion for the detection of 1,3-butadiene in the ambient atmosphere, Rapid Commun. Mass Sp., 23, 3301–3308, doi:10.1002/rcm.4249, 2009.
Lias, S. G., Bartmess, J. E., Liebman, J. F., Holmes, J. L., Levin, R. D., and Mallard, W. G.: Gas-Phase Ion and Neutral Thermo-chemistry, J. Phys. Chem. Ref. Data, 17, ISBN: 0-88318-562-8, 1988.
Liu, Y. J., Herdlinger-Blatt, I., McKinney, K. A., and Martin, S. T.: Production of methyl vinyl ketone and methacrolein via the hy-droperoxyl pathway of isoprene oxidation, Atmos. Chem. Phys., 13, 5715–5730, doi:10.5194/acp-13-5715-2013, 2013.
Midey, A. J., Williams, S., Miller, T. M., and Viggiano, A. A.: Reac-tions of O+2, NO+and H3O+with methylcyclohexane (C7H14)
and cyclooctane (C8H16) from 298 to 700 K, Int. J. Mass
Spectrom., 222, 413–430, doi:10.1016/S1387-3806(02)00996-X, 2003.
Prince, B. J., Milligan, D. B., and McEwan, M. J.: Application of selected ion flow tube mass spectrometry to real-time atmo-spheric monitoring, Rapid Commun. Mass Sp., 24, 1763–1769, doi:10.1002/rcm.4574, 2010.
Smith, D. and Španˇel, P.: Selected ion flow tube mass spectrometry (SIFT-MS) for on-line trace gas analysis, Mass Spectrom. Rev., 24, 661–700, doi:10.1002/mas.20033, 2005.
Španˇel, P. and Smith, D.: A selected ion flow tube study of the re-actions of NO+and O+2 ions with some organic molecules: The potential for trace gas analysis of air, J. Chem. Phys., 104, 1893– 1899, doi:10.1063/1.470945, 1996.
Španˇel, P. and Smith, D.: SIFT studies of the reactions of H3O+, NO+and O+2 with a series of alcohols, Int. J. Mass Spectrom., 167–168, 375–388, doi:10.1016/S0168-1176(97)00085-2, 1997. Španˇel, P. and Smith, D.: Selected ion flow tube studies of the reac-tions of H3O+, NO+, and O+2 with several amines and some
other nitrogen-containing molecules, Int. J. Mass Spectrom., 176, 203–211, doi:10.1016/S1387-3806(98)14031-9, 1998a. Španˇel, P. and Smith, D.: Selected ion flow tube studies of the
reactions of H3O+, NO+, and O+2 with several aromatic and aliphatic hydrocarbons, Int. J. Mass Spectrom., 181, 1–10, doi:10.1016/S1387-3806(98)14114-3, 1998b.
Španˇel, P. and Smith, D.: Selected ion flow tube studies of the reactions of H3O+, NO+, and O+2 with several aromatic and
aliphatic monosubstituted halocarbons, Int. J. Mass Spectrom., 189, 213–223, doi:10.1016/S1387-3806(99)00103-7, 1999. Španˇel, P., Ji, Y., and Smith, D.: SIFT studies of the reactions of