www.atmos-meas-tech.net/6/3459/2013/ doi:10.5194/amt-6-3459-2013
© Author(s) 2013. CC Attribution 3.0 License.
Atmospheric
Measurement
Techniques
A method for sizing submicrometer particles in air collected on
Formvar films and imaged by scanning electron microscope
E. Hamacher-Barth1, K. Jansson2, and C. Leck1
1Department of Meteorology, Stockholm University, Stockholm, Sweden
2Department of Materials and Environmental Chemistry, Stockholm University, Stockholm, Sweden Correspondence to: E. Hamacher-Barth ([email protected])
Received: 21 May 2013 – Published in Atmos. Meas. Tech. Discuss.: 19 June 2013 Revised: 4 November 2013 – Accepted: 7 November 2013 – Published: 10 December 2013
Abstract. A method was developed to systematically inves-tigate individual aerosol particles collected onto a polyvinyl formal (Formvar)-coated copper grid with scanning electron microscopy. At very mild conditions with a low accelerat-ing voltage of 2 kV and Gentle Beam mode aerosol particles down to 20 nm in diameter can be observed. Subsequent pro-cessing of the images with digital image analysis provides size resolved and morphological information (elongation, circularity) on the aerosol particle population. Polystyrene nanospheres in the expected size range of the ambient aerosol particles (20–900 nm in diameter) were used to confirm the accuracy of sizing and determination of morphological pa-rameters. The relative standard deviation of the diameters of the spheres was better than±10 % for sizes larger than 40 nm and±18 % for 21 nm particles compared to the man-ufacturer’s certificate.
Atmospheric particles were collected during an icebreaker expedition to the high Arctic (north of 80◦) in the summer of 2008. Two samples collected during two different mete-orological regimes were analyzed. Their size distributions were compared with simultaneously collected size distribu-tions from a Twin Differential Mobility Particle Sizer, which confirmed that a representative fraction of the aerosol parti-cles was imaged under the electron microscope. The size dis-tributions obtained by scanning electron microscopy showed good agreement with the Twin Differential Mobility Sizer in the Aitken mode, whereas in the accumulation mode the size determination was critically dependent on the contrast of the aerosol with the Formvar-coated copper grid. The mor-phological properties (elongation, circularity) changed with the number of days the air masses spent over the pack-ice
area north of 80◦before the aerosol particles were collected at the position of the icebreaker and are thus an appropriate measure to characterize transformation processes of ambient aerosol particles.
1 Introduction
Aerosol particles are ubiquitous in the troposphere and have a major influence on global climate and climate change (IPCC, 2007). Their direct effect on climate is through scattering and absorption of both incoming light from space and ther-mal radiation emitted from the Earth’s surface (Andreae and Crutzen, 1997; Haywood and Boucher, 2000). The indirect effect is related to the role of aerosol particles as potential cloud condensation nuclei (CCN) (Twoomey, 1959; Baker, 1997; Lohmann and Feichter, 2005). The number, size, mor-phology, state of mixture and chemical composition of CCN will determine the number and size of cloud droplets and thus will be important factors that determine the optical properties of clouds (Charlson et al., 1992). Furthermore, aerosol par-ticles serve as a source of ice nuclei and thereby contribute to the formation of mixed phase clouds (McFarquhar et al., 2013), which are frequently observed not only in the Arctic but also at lower latitudes (Shupe et al., 2008). The processes involved in cloud formation, however, are still not fully un-derstood and not very well represented by current climate models, mainly due to a lack of observational data (IPCC, 2007).
3460 E. Hamacher-Barth et al.: A method for sizing submicrometer particles
a few nanometers to a few micrometers. It is therefore convenient to describe particle size as one single number. However, unless the particle is a perfect sphere, which is rare in natural atmospheric samples (Bigg and Leck, 2001a), there are many ways, including shape/morphology, degree of com-pactness, state of mixture and particle texture, to describe an aerosol particle (Coz and Leck, 2011). The only method at present to derive size resolved mapping of single particles including the above parameters, down to sizes in the lower nanometer range, is electron microscopy (Bigg et al., 2004; Laskin et al., 2006; Kandler et al., 2007; Coz et al., 2008; Leck and Bigg, 2008; Capanelli et al., 2011; Coz and Leck, 2011).
When particles collected onto a thin film of carbon or polyvinyl formal (Formvar), supported by a 3 mm transmis-sion electron microscopy (TEM) copper (Cu) grid, are im-aged under the electron microscope, the electron beam is scattered to a higher degree in thicker and denser particulate material than in the uniform grid film. The images usually have good contrast and excellent resolution in two dimen-sions. Three-dimensional (3-D) resolution of particles can be obtained by shading the grid surface with fine metal coatings under a low angle (Bigg and Leck, 2001a). But shading the particles will slightly increase their size which in turn will result in a false size number distribution and move the size limit of detection to larger sizes. Without shading, parts of the sample and the Formvar film might on the other hand be destroyed by the high energy electron beam (80–200 kV) usually in operation.
Scanning electron microscopy (SEM) has been used for more than 50 yr to image surfaces and particles (Junge, 1952; Parungo and Nagamoto, 1986; Stevens et al., 2009) and can be operated at an accelerating voltage as low as 1 kV. This enables highly detailed imaging of beam sensitive particles without radiation damage. Information on size, morphology, state of mixture and elemental chemical composition is avail-able without distortion from metal shading. Particle size and morphological parameters can be a resolved down to 2–5 nm diameters while chemical elements can be mapped down to 50–100 nm diameters, but at a higher accelerating voltage. Microscopic methods, however, are tedious and time con-suming and great progress has been made to develop auto-mated scanning methods in the submicron size range (Poelt et al., 2002; Ocker et al., 1995). But these automated methods require a highly plain substrate and sufficiently good contrast between the aerosol particles and their background (Poelt et al., 2002). To ensure that the collected ambient aerosol particles are imaged over all size ranges, without any dis-turbances by stigmatism or defocusing, the aerosol samples must be scanned manually. Nevertheless, microscopic meth-ods are not completely quantitative, and the availability of an objective and quantitative method for the evaluation of aerosol samples and microscope images is therefore a pre-requisite for a systematic investigation. Moreover, to assess any direct or indirect aerosol effects on cloud formation and
regional climate the aerosol population under investigation has to form a representative fraction of the collected ambient aerosol particles.
Here we present a quantitative method to systematically investigate single aerosol particles collected on Formvar film supported by a copper grid, with a SEM operating at low ac-celerating voltage. To maximize the surface information on the aerosol particles under investigation, a relatively low ac-celerating voltage of 2 kV was applied and secondary elec-trons were detected. Electron microscopy generally has to handle the conflict between sufficiently high spatial reso-lution which depends on the probe size determined by the accelerating voltage and on the other hand electron radia-tion damage due to the high electron energy of the probe (Terasaki et al., 2013). Therefore, a stage bias was applied which reduced the impact electron energy onto the specimen (Michael et al., 2010) and to reduce the interaction volume that generates secondary electrons and to minimize radiation damage and charging problems (Terasaki et al., 2013). These conditions allow for the observation of the substrate surface at high resolution. Subsequent processing of the images with digital image analysis provides statistically size resolved in-formation on the particle population collected on the film. Polystyrene latex (PSL) standard spheres were used to deter-mine the errors in sizing the aerosol particles with SEM and subsequent digital image analysis.
Furthermore, the size distributions derived from the eval-uation of microscope images of the PSL spheres and col-lected ambient samples were compared with simultaneously collected number particle size distributions seen by a Twin Differential Mobility Particle Sizer (TDMPS; Heintzenberg and Leck, 2012) and problems associated with the size de-termination of natural samples are identified and discussed. The ambient samples used in this study were collected in the high Arctic summer during the Arctic Summer Cloud Ocean Study (ASCOS) 2008 (www.ascos.se; Tjernström et al., 2013). The samples were obtained during a three-week period while the Swedish icebreaker Oden was anchored to a drifting ice floe close to the North Pole, around 87◦N.
2 Methods for image recording and digital analysis
2.1 Scanning electron microscopy (SEM)
The samples were investigated with a high-resolution SEM (JEOL JSM-7401F) under high vacuum conditions, at less than 9.63×10⁻⁵Pa (Stevens et al., 2009). The electron beam
was generated by a cold field emission gun operating with an extracting voltage of 6.8 kV which yielded an emission of 20 µA. The focused electron probe current was 16 pA and secondary electrons emitted from the sample surface were detected with an in-lens column detector. A negative bias (−2 kV) was applied on the sample stage to deceler-ate incident electrons before entering the sample surface. To
generate a landing energy corresponding to 1 kV, a column accelerating voltage of 3 kV was used. This Gentle Beam mode was used to minimize radiation damage, surface charge up and to demagnify the electron beam diameter (Michael et al., 2010). Images were recorded after correction of stig-matism and focusing and automatic adjustment of greyscale (contrast and brightness). Particle samples were collected di-rectly onto a 3 mm TEM copper 300 mesh grids, coated with a 30–60 nm thick Formvar film (TED PELLA INC.). 2.2 Grid screening protocol
To image a representative fraction of the particle population collected on the Formvar film, each grid was screened sys-tematically. Each grid was divided into four quadrants using the grid marker in the center of the grids (Fig. 1i). The screen-ing of a grid started from the grid marker and went outwards towards the edge of the grid following each of the quadrant’s (a, b, c or d) diagonal (i.e., 1,1; 2,2; 3,3, etc). Following the diagonals accounted for inhomogeneous particle distribution across the grid and aimed to image a representative particle distribution. In total between 7 and 9 squares were scanned, and between 300 and 500 images were obtained per grid. To reduce the screening time and to obtain a sufficient number of images for digital image analysis the scanning of the grid started from a low magnification (80×). The whole grid was scanned in order to determine the orientation and to identify damaged areas, and proceeded via magnification of 1100× to take an image of the respective square in the copper grid, and finally images at 10 000×and 40 000×were recorded (Fig. 1). The images at 40 000×were used for digital imag-ing processimag-ing. Focus and stigmatism were controlled and corrected frequently before the images were taken.
2.3 Digital image analyses
Digital image analysis involves all processes that are neces-sary to extract information from a digital image: image pro-cessing, separation of the object (the aerosol particle) from the background, and measurement of the desired parameters. Microscope images at 40 000×were evaluated using an op-timized commercial image processing software (Aphelion™ Dev 4.10). In addition to size we use two morphological pa-rameters to extend the description of the mapped particles. These parameters (elongation and circularity) provide a mea-sure of the deviation from spherical geometry and can be di-rectly addressed by the image processing software.
2.3.1 Separation of particles from the background
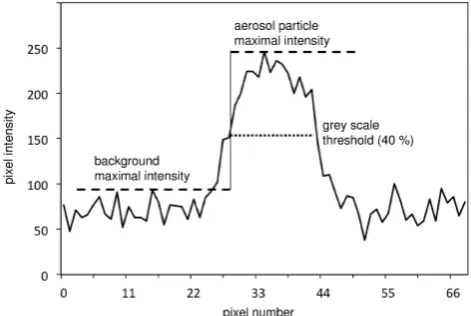
To reduce the background noise of the digital image obtained with SEM an automedian filter and subsequently a Gauss fil-ter (3×3) were applied to each image. To separate the im-aged aerosol particle from its background the maximal in-tensity of the neighboring background has to be determined. Therefore an image section of the particle background was
produced with a size of about 250×250 pixels by cutting out the aerosol particle (Fig. 2i, area inside the dashed rectangle) and to determine the maximal background intensity (Fig. 2i). Using exactly the same image but including the aerosol par-ticle allowed the separation of the parpar-ticle and measurement of the particle area (Fig. 2ii; in pixels). The threshold was set to 40 % of the intensity difference between background and aerosol maximal intensity (Fig. 3). This value was chosen subjectively with respect to the often weakly contrasting par-ticles and determined manually by comparing results from threshold values between 5 % and 50 %.
2.3.2 Particle size
The size of an aerosol particle can be expressed as the particle equivalent diameter (Dpa)according to Eq. (1).
Dpa=2 p
Area/π (1)
The particle equivalent diameterDpais the diameter of a
cir-cle that comprises the same area as the projected particir-cle. The value for the area is calculated from the number of pixels (Area) counted for each particle (Allen, 1997; Hinds, 1999). From the particle area (in pixels) the diameter of an equiv-alent sphere for each aerosol particle was derived with help of Eq. (1). A number size distribution of the aerosol sam-ple was obtained by calculating a histogram using MATLAB 2011a and the freely available software package EasyFit. 2.3.3 Morphological properties
The morphological properties of the particles have been quantified by the following parameters:
– Circularity is sensitive to both overall form and surface roughness, showing values in the range from 0 to 1. A perfect circle has a circularity of 1 while a very irreg-ular object has a circirreg-ularity value close to 0 (Fig. 4).
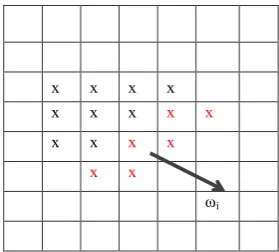
Circularity =4πArea/CP2 (2)
Circularity uses the Crofton perimeter (CP), which is calculated according to Eq. (3).
CP=π n
X
i=1
Ni(X, ki), (3)
whereNiis the intercept ofXin the orientationωiand ki is a coefficient to correct for the bias depending on
the orientation of the particle on the image. Aphelion™ 4.10 uses 4 orientations (ω0=0◦,ω1=45◦,ω2=90◦
andω3=135◦);k0andk2equal 1, whereask1andk3
3462 E. Hamacher-Barth et al.: A method for sizing submicrometer particles
35
1
Fig. 1: (i) A copper grid imaged using SEM at 80x magnification showing the grid 2
marker at centre and definition of the square labelling in quadrant a and c, (ii) the single 3
grid square (a1,1) imaged at 1 100x magnification, (iii) particles imaged at 40 000x 4
magnification.
5
6
Fig. 1. (i) a copper grid imaged using SEM at 80×magnification showing the grid marker at center and definition of the square labeling in quadrant a and c, (ii) the single grid square (a1,1) imaged at 1100×magnification, (iii) particles imaged at 40 000×magnification.
36
1
Fig. 2: (i) Image for determination of the background intensity and (ii) corresponding 2
digital image used in measurement of particle size and morphological parameters. 3
4
Fig. 2. (i) image for determination of the background intensity and (ii) corresponding digital image used in measurement of particle size and morphological parameters.
– Elongation is sensitive to the overall form of a particle and is calculated according to Eq. (2).
Elongation=(Dmax−Dmin)/(Dmax+Dmin) (4)
Dmaxis the longest projection of the particle,Dminis
the shortest projection. Elongation is close to zero for compact particles and close to 1 for open branched ones. The larger the ratio between Dmax/Dmin the
closer to 1 the value for elongation becomes (Fig. 4); for a particle withDmax/Dmin=1000:1 the
elonga-tion is calculated to 0.998.
3 Methods for sampling of airborne aerosol particles during ASCOS
Scanning electron microscopy with subsequent image map-ping (Sects. 2 and 4) was applied to two ambient aerosol sam-ples (see Sect. 5.1 for details) collected onboard the Swedish icebreaker Oden in the course of ASCOS. The expedition focused on the formation and life cycle of low-level Arctic clouds with linkages to the microbiological life in ocean and ice. ASCOS departed from Longyearbyen on Svalbard on 2 August and returned on 9 September. After traversing the pack ice northward an ice camp was set up on 12 August at
37 1
Fig. 3: Determination of aerosol particle size. Background and particle intensity were 2
determined independently; the threshold for the determination of the particle size was set 3
at 40% of the intensity difference between background and aerosol particle maximal 4
intensity. 5
6
Fig. 3. Determination of aerosol particle size. Background and par-ticle intensity were determined independently; the threshold for the determination of the particle size was set at 40 % of the intensity difference between background and aerosol particle maximal inten-sity.
87◦N and remained in operation through 1 September, drift-ing with the ice. Tjernström et al. (2013) documented the ASCOS instrument suite in detail. Key methods for sampling used in this study are described below.
3.1 The sampling manifold
A PM10-inlet (diameter < 10 µm at ambient relative
humid-ity, RH) was placed upstream of all aerosol measurements located in a laboratory container on the fourth deck of the icebreaker. The aerosol inlet was designed to optimize the distance from the sea and from the ship’s superstructure and was located∼25 m above the sea surface and 3 m above the roof of the laboratory container. Direct contamination from the ship was excluded by using a pollution controller. Pro-vided that the wind was within±70◦of the direction of the bow and stronger than 2 m s−1, no pollution reached the sam-ple inlets (Leck et al., 1996). To maximize the sampling time it was necessary to face the ship into the wind. More details of the set-up for the sampling of aerosol particles are given in Leck et al. (2001).
38
1
Fig. 4: Illustration of the morphological descriptors and elongation circularity (Huck, 2
2013, modified) 3
4
Fig. 4. Illustration of the morphological descriptors and elongation circularity (Huck, 2013, modified).
The aerosol samples were drawn into the aerosol inlet at an ambient relative humidity of 85–100 % and temperatures of about 0◦C (Tjernström et al., 2012). Directly after the inlet tube passed the container roof the air was distributed to the TDMPS and the electrostatic precipitator for sampling onto the TEM grids with a short stainless steel tube of 1 m length. The temperature in the container was kept at 20◦C which resulted in a RH of 20 % when the sampling onto the TEM grid occurred. These relative dry conditions are commonly chosen for sampling of aerosol particles and were the same for the TDMPS instrument and the electrostatic precipitator. Both instruments were placed close together along the inlet to ensure that sampling conditions and losses were the same for both instruments.
Volatile organic compounds on the particle surface as well as weakly bound water molecules (see discussion below) are probably lost during the sampling procedure and require other measurement techniques to capture them. In the Arctic the concentration of volatile organic compounds in the at-mosphere is generally lower than at lower latitudes (Bates et al., 1987) and thus the losses due to evaporation during our measurements can be considered to be very small.
3.2 Collection of particles for subsequent single particle mapping by SEM
Airborne aerosol particles were collected directly onto the Formvar-coated Cu TEM grids with an electrostatic precipi-tator (Dixkens and Fissan, 1999; Leck and Bigg, 2008). The particles were charged at the aerosol inlet by a63Ni beta-emitting radioactive source and afterwards precipitated by a 12 kV cm−1electric field between the inlet and the
collect-ing surface. The flow rate was kept very low (0.17 mL s−1)
in order to collect particles up to∼1 µm. The collection ef-ficiency of the electrostatic precipitator was inter-compared with the TSI 1236 Nanometer Aerosol Sampler (63Ni beta-emitting radioactive source and sample flow of 1 L m−1) mounted side-by-side with the electrostatic precipitator. Both collected a small, but statistically significant number of par-ticles < 25 nm. The precipitator took samples for 6 to 12 h. Before and after sampling the grids were placed within a grid
39
x x x x
x x x x x
x x x x
x x
ωi
1
Fig. 5: Schematic representation of the calculation of the Crofton perimeter. The pixels 2
with transitions from intensity to non-intensity are shown in red, ωi is the orientation
3
along which the number of intercepts Niare calculated.
4
5
Fig. 5. Schematic representation of the calculation of the Crofton perimeter. The pixels with transitions from intensity to non-intensity
are shown in red,ωi is the orientation along which the number of
interceptsNiare calculated.
holder box in a sealed dry plastic bag, together with silica gel packets, and stored in a desiccator at a constant temperature of 20◦C before they were investigated.
3.3 Number size distributions using a TDMPS
The sampling system to measure the number size distribu-tions of dry submicrometer particles used pairs of differen-tial mobility analyzers (DMAs). The TSI 3010 counters in the DMAs were size and concentration calibrated against an electrometer and the TSI 3025 counters for particle sizes be-low 20 nm diameter according to Stolzenburg (1988). This set-up yielded a complete number size distribution from 3 nm to 800 nm diameter in 45 intervals of diameter every 10 min. Further details of the TDMPS system can be found in Heintzenberg and Leck (2012). NIST (National Institute of Standards Technology) traceable calibration standards of polystyrene latex (PSL) spherical particles were used to de-termine error in determination of the mobility diameter to ±5 % (Wiedensohler et al., 2012).
Number size distributions obtained from TDMPS mea-surements were adapted to SEM meamea-surements by taking the median value for each of the 45 TDMPS size intervals by as-suming the same particle diameter in the respective interval. The particle diameters were then merged to form a complete set of diameters across the TDMPS measuring interval. The data were then treated in the same way as the SEM derived data to obtain a number size distribution.
4 Polystyrene latex spheres used for SEM calibration
3464 E. Hamacher-Barth et al.: A method for sizing submicrometer particles
40
1
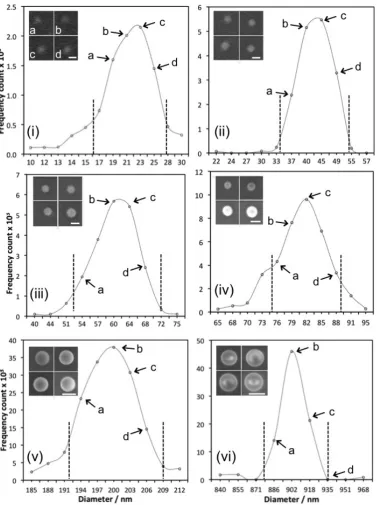
Fig. 6: Size distributions obtained for PSL spheres: (i) 21 nm, (ii) 40 nm, (iii) 60 nm,
2
(iv) 80 nm, (v) 200 nm, and (vi) 900 nm. The dashed lines indicate the diameter boundary
3
values for statistical analysis and the determination of morphological parameters. The
4
insets show examples for the respective PSL spheres, and the calibration bars represent
5
20 nm (i), 40 nm (ii), 60 nm (iii), 80 nm (iv), 200 nm (v), and 900 nm (vi).
6
Fig. 6. Size distributions obtained for PSL spheres: (i) 21 nm, (ii) 40 nm, (iii) 60 nm, (iv) 80 nm, (v) 200 nm, and (vi) 900 nm. The dashed lines indicate the diameter boundary values for statistical analysis and the determination of morphological parameters. The insets show examples for the respective PSL spheres, and the calibration bars represent 20 nm (i), 40 nm (ii), 60 nm (iii), 80 nm (iv), 200 nm (v), and 900 nm (vi).
distribution of a remote marine atmospheric aerosol popu-lation in the submicrometer size range (Covert et al., 1996; Heintzenberg and Leck, 2012) as a superposition of more or less distinguishable modes, and PSL spheres of the follow-ing diameters were used: 21±1 nm, 40±1 nm, 57±4 nm, 81±3 nm, 200±6 nm, and 903±12 nm.
4.1 Sample preparation
To prepare the grid standards for subsequent screening and evaluation, the bottle containing the microspheres (all poly-mer microsphere suspensions were purchased from Thermo Scientific) was gently inverted several times to disperse the microspheres and then immersed in an ultrasonic bath at
45 Hz. Two droplets of the 1 % microsphere suspension were further suspended in 250 mL deionized water (Milli-pore Alpha-Q, resistivity 18 Mcm) and stirred gently. A TEM Formvar grid was placed on a 0.8 µm pore size Mil-lipore filter (type AA), which was lying upon a nutrient pad (the porous filter material used to hold nutrients in bacterial cultures) in contact with deionized water. A volume of 2 µL of the microsphere suspension was applied onto the surface of the grid with a hypodermic syringe. The grid, filters and water were kept in a fume hood for 24 h to allow the water and soluble material to diffuse through the plastic film into the water phase. The grid was subsequently stored in a des-iccator until further SEM imaging.
4.2 Sizing results
The diameters of the PSL particles were in the range of the manufacturer’s size specifications; for the 21±1 nm spheres a diameter of 22.5 nm with a standard deviation of±4.1 nm was determined. The larger spheres showed successively smaller relative standard deviations: 42.7±4.1 nm, 60.8± 4.5 nm, 81.9±4.6 nm, 199.7±5.2 nm and 903.9±13.1 nm (Table 1). Generally the diameter for each of the PSL sphere sizes shows a good agreement with the size the manufac-turer states in the NIST certificate following each of the PSL sphere sizes (Figs. 6 and 7). The size distributions obtained with SEM imaging are monomodal with median values and standard deviations as listed in Table 1. The magnitude of the relative standard deviation decreased with the increase of the sphere diameter, from 18 % for 20 nm spheres to 1.3 % for 900 nm spheres. The same trend was observed for elongation and circularity of the spheres, as these values decrease con-tinuously from 16 % deviation from the elongation for a per-fect sphere for 20 nm spheres to 0.13 % deviation for 900 nm spheres. The values for circularity are closer to ideal circu-larity for a perfect sphere for the 900 nm spheres (0.2 % de-viation) than for the 20 nm spheres (7 % deviation, Table 1). 4.3 Determination of size limit of detection
At a magnification of 40 000×each pixel in the digital im-ages has a size of 2 nm×2 nm. By assuming that the electron beam diameter is optimized with respect to focus and stigma-tism, a diameter of 1 nm will be obtained. Under this condi-tion the observed size limit of deteccondi-tion in the images will be 5–10 nm in diameter. By use of 3×3 pixels to separate a particle from the background in the digital image analy-sis the theoretical minimum diameter of particles that can be detected is 6 nm. At lower magnification the pixel size and thus the particle diameter that can be determined increases. At 10 000×the pixel size is 8 nm and the theoretical mini-mum diameter is 24 nm.
The real size limitation of particle detection also depends on the element composition of both particle and substrate, and the magnitude of accelerating voltage that generates the
41 1
Fig. 7: Pixel intensities vs. pixel number for (i) 20 nm PSL spheres, (ii) 40 nm PSL 2
spheres, (iii) 80 nm PSL spheres and (iv) 900 nm PSL spheres. The dashed lines indicate 3
the boundaries for the determination of the background grey level threshold values. 4
5
Fig. 7. Pixel intensities vs. pixel number for (i) 20 nm PSL spheres, (ii) 40 nm PSL spheres, (iii) 80 nm PSL spheres and (iv) 900 nm PSL spheres. The dashed lines indicate the boundaries for the deter-mination of the background grey level threshold values.
electron beam interaction volume. Summarizing these fac-tors the size limit of detection for PSL particles is 15 nm at a magnification of 40 000×.
5 Airborne aerosol samples imaged by scanning electron microscope
3466 E. Hamacher-Barth et al.: A method for sizing submicrometer particles
Table 1. Diameter and the morphological parameters, elongation and circularity, of PSL spheres derived by digital image analysis of SEM images at 40 000×. In brackets the relative magnitude of the standard deviation, the relative deviation from elongation and circularity of an ideal sphere.
21 nm 40 nm 60 nm 80 nm 200 nm 900 nm
Certificate 21±1 nm 40±1 nm 57±4 nm 81±3 nm 200±6 nm 903±12 nm
Measured 22.5±4.1 nm 42.7±4.1 nm 60.8±4.5 nm 81.9±4.6 nm 199.7±5.2 nm 903.9±13.1 nm
(18 %) (9.5 %) (7.3 %) (5.6 %) (2.6 %) (1.4 %)
Elongation (sphere = 0) 0.16 (16 %) 0.09 (9 %) 0.05 (5 %) 0.04 (4 %) 0.03 (3 %) 0.001 (0.13 %)
Circularity (sphere = 1) 0.93 (7 %) 0.93 (7 %) 0.94 (6 %) 0.94 (6 %) 0.97 (3 %) 0.998 (0.2 %)
42 1
Fig. 8: Air mass trajectory clusters with an arrival height of 100 m at the position of the 2
icebreaker during: (i) August 15 originated easterly from the Greenland – and Barents 3
Sea area, (ii) August 19 from the Kara Sea. 4
5
Fig. 8. Air mass trajectory clusters with an arrival height of 100 m at the position of the icebreaker during (i) 15 August originated east-erly from the Greenland Sea and Barents Sea area, (ii) 19 August from the Kara Sea.
on the location (Kerminen and Leck, 2001; Leck and Bigg, 2005a, b; Heintzenberg and Leck, 2012). This Aitken mode results from condensational growth of nucleation mode par-ticles as well as from primary marine biogenic emissions (Leck and Bigg, 2010; Orellana et al., 2011; Karl et al., 2013). A concentration minimum, referred to as the Hop-pel minimum, follows at about 80 nm in diameter. An accu-mulation mode, appears between 100 and 200 nm, and typi-cally results from condensation of gases, such as the oxida-tion products of dimethyl sulfide (sulfuric and methane sul-fonic acids), on preexisting Aitken mode particles (Kerminen and Leck, 2001; Karl et al., 2013) and from the formation of particle mass by in-cloud chemistry via sulfur dioxide. Fur-thermore primary particles, both biogenic and sea salt, can be directly injected into the accumulation mode and into the larger coarse mode (above 1000 nm in diameter) by bubble bursting at the sea–air interface (Leck et al., 2002; Leck and Bigg, 2005a; Bigg and Leck, 2008). The coarse mode is often inconspicuous in a number size distribution but contributes substantially to aerosol volume/mass.
5.1 The approach applied to two aerosol samples collected during ASCOS
The first sample (Sample A) was collected between 15:55 and 22:46 UTC (total sampling time 6:51 h) on 15 August.
This time period was dominated by air masses originating from the Greenland and Barents Sea area (Fig. 8i1). The sec-ond sampling period (Sample B, 19 August from 08:20 until 16:46 UTC, total sampling time 8:26 h) was dominated by air that had been advected from the Kara Sea (Fig. 8ii). Both samples were collected at around 87◦N but had spent
differ-ent times over the pack-ice since their last contact with open sea. Days over ice (DOI)2were determined to be 0.9 days for Sample A and to be 4.5 days for Sample B.
Both samples show a bimodal size distribution (Figs. 9 and 10) which is characteristic for an aerosol population that was modified by in cloud processing (Hoppel et al., 1986) and suggests an aerosol source from the marginal ice zone (MIZ) and/or open water further south. Air mass back trajectory clusters that show the origin of the air masses reaching the position of the icebreaker on the sampling date (Fig. 8) ver-ify the origin of the air masses. Previous studies (Leck and Persson, 1996a, b; Leck et al., 2002; Leck and Bigg, 2005a, b; Bigg and Leck, 2008) confirm this bimodal distribution, which is the result of both primary (biogenic and sea salt) and secondary (dimethyl sulfide oxidation products, condensa-tional growth and in-cloud oxidation) aerosol sources within the open leads between the pack ice and/or along the MIZ.
The previous high Arctic campaigns clearly show that am-bient aerosol particles are not necessarily spherical but can show a very irregular shape and surface (e.g., Bigg and Leck,
1Computation of 10 days backward trajectories for the air mass
arriving at 100 m altitude at the position of the icebreaker. The Hy-brid Single Particle Lagrangian Integrated Trajectory Model (HYS-PLIT) (Draxler and Rolph, 2011; Rolph, 2011) was used for the trajectory calculations based on data from the Global Data Assimi-lation System (GDAS) of the National Weather Service’s National Centers for Environmental Prediction (NCEP).
2The time spent over the pack ice by the air mass since last con-tact with open sea (DOI) was calculated for the purposes of ASCOS as in Nilsson and Barr (1996) and uses the HYSPLIT back trajecto-ries in combination with maps of sea ice distribution. The latter were created based on data from NSIDC, Boulder, CO, United States, ob-tained by the sensor onboard the Aqua satellite, with the final anal-ysis being conducted at the University of Bremen, Germany. The measure of DOI represents thus a simple parameter to summarize the evolution of the aerosol particles as a function of the synoptic scale systems since their last contact with open sea.
43 1
Fig. 9: Number size distributions obtained for sample A. Red line: SEM derived particle 2
number distribution, blue line: number size distribution from TDMPS measurements. The 3
red bars represent the size ranges in which particle types appear in SEM; SP: dashed line, 4
HP: dotted line, GP: dash-dot line; the arrows represent the ranges of uncertainty for the 5
respective mode in each size distribution based on results from sizing of PSL spheres for 6
SEM data, and 5 % uncertainty for TDMPS measurements (Wiedensohler et al., 2012). 7
8 9
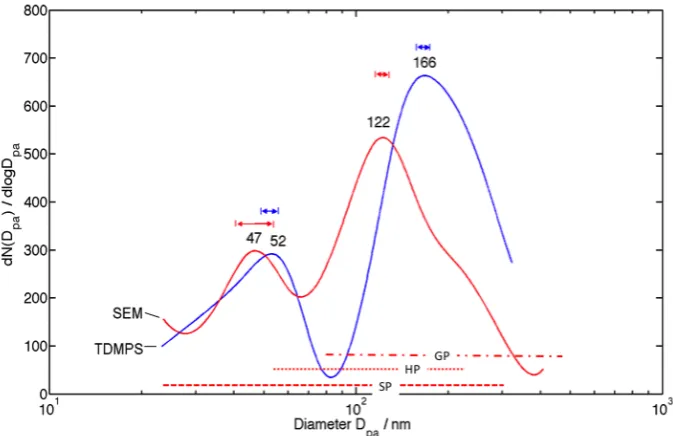
Fig. 9. Number size distributions obtained for Sample A. Red line – SEM derived particle number distribution, blue line – number size distribution from TDMPS measurements. The red bars represent the size ranges in which particle types appear in SEM: SP – dashed line, HP – dotted line, GP – dash-dot line; the arrows represent the ranges of uncertainty for the respective mode in each size distribution based on results from sizing of PSL spheres for SEM data, and 5 % uncertainty for TDMPS measurements (Wiedensohler et al., 2012).
2001a). Freedman et al. (2010) discuss changes in aerosol particle shape and size after impaction onto a substrate. The two critical factors are the solubility of the aerosol particle outer layer and the polarity of the sampling substrate. Leck and Bigg (1999, 2005a, b) and Orellana et al. (2011) char-acterized the primary biogenic aerosol to be made up by polymer gels. Marine phytoplankton and sea-ice algae ex-crete these polymer gels. They are water insoluble, thermally stable, highly surface active and highly hydrated. The poly-mer molecules consist of polysaccharides which form three-dimensional networks interlinked with divalent ions, prefer-ably Ca2+, to which other organic compounds (proteins and
lipids) can be readily bound. The non-water soluble proper-ties have been attributed to hydrophilic and hydrophobic seg-ments of the gels (Orellana et al., 2011) and are in agreement with their chemical behavior modeled by Xin et al. (2013). Facchini et al. (2008) described a similar type of gel par-ticles collected over the North Atlantic which mainly con-tained water insoluble organic carbon (94±4 %) in the sub-micron range.
Assumed that the organic fraction of the samples collected for our study contain an equally high amount of water insol-uble organic carbon as in Facchini et al. (2008) the aerosol particles can be characterized as mainly water insoluble. The sampling substrate on the other hand, the Formvar-coated Cu TEM grid, is hydrophilic and thus polar due to the chemi-cal nature of the Formvar film (Rocha et al., 2005). The im-paction of a water insoluble organic particle onto the polar Formvar film left the particle compact and retained its shape (Freedman et al., 2010). An impacting particle with a higher
solubility splattered upon impaction onto the hydrophilic substrate and formed a high number of satellite particles. The more soluble the organic substance was the smaller and more numerous the satellite particles were. Based on these former studies it can be assumed that most of the gel parti-cles imaged in our samples retained their initial morphology and size due to the specific physico–chemical interaction be-tween sampling substrate and aerosol particle.
A change of morphology of the gel particles due to the dry ambient conditions during sampling and the high vacuum under the electron microscope can also be excluded. The gel particles are highly hydrated (up to 99 % water), but the wa-ter molecules are mainly bound within the polymer gel struc-ture and do not evaporate at dry ambient conditions. Only a relatively small number of molecules that are located on the surface of the marine gel particles can evaporate. But the evaporation of these surface bound water molecules does not affect the structure of the particles (Leck and Bigg, 2005b).
Three types of particles were observed in both Sample A and B:
3468 E. Hamacher-Barth et al.: A method for sizing submicrometer particles
44 1
Fig. 10: Number size distribution obtained for sample B. Red line: SEM derived particle 2
number distribution, blue line: number size distribution from TDMPS measurements. The 3
red bars represent the size ranges in which particle types appear in SEM; SP: dashed line, 4
HP: dotted line, GP: dash-dot line;. The arrows represent the ranges of uncertainty for the 5
respective mode in each size distribution based on results from sizing of PSL spheres for 6
SEM data, and 5 % uncertainty for TDMPS measurements (Wiedensohler, 2012). 7
8 9
Fig. 10. Number size distribution obtained for Sample B. Red line – SEM derived particle number distribution, blue line – number size distribution from TDMPS measurements. The red bars represent the size ranges in which particle types appear in SEM: SP – dashed line, HP – dotted line, GP – dash-dot line. The arrows represent the ranges of uncertainty for the respective mode in each size distribution based on results from sizing of PSL spheres for SEM data, and 5 % uncertainty for TDMPS measurements (Wiedensohler et al., 2012).
(Heard and Wiffen, 1969; Fig. 12). To avoid biases due to size changes, we imaged these particles as quickly as possible in order to minimize evaporative losses and beam damage and at the same time to optimize the con-trast and surface information about the aerosol parti-cles.
– Gel particles (GP): in contrast to SP these particles show a patchy, inhomogeneous distribution of pixel intensity (Fig. 13). This patchy appearance and the in some cases very weak contrast with the Formvar film suggest that GP are built up by material that con-sists predominantly of light elements (C, H, N, O) and forms a film-like structure on the Formvar film. This at times weakly contrasting film-like material on the For-mvar film could possibly lead to an underestimation of the area of the GP deposited on the film surface. The majority of GP appears in the accumulation mode (Ta-ble 1).
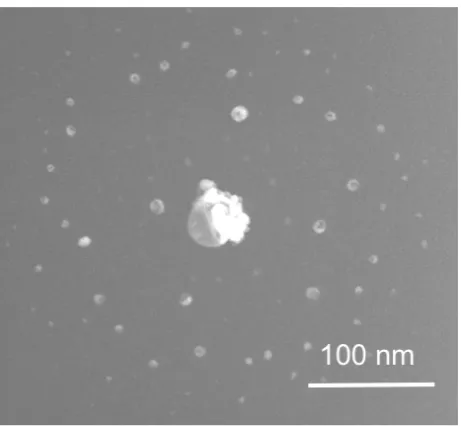
– Halo particles (HP): a relatively large central particle is surrounded by a number of smaller satellite parti-cles withDpa/10 toDpa/3(Dpa: equivalent diameters
derived from the projected area of the central parti-cle using Eq. 1; Fig. 14). To establish the proportion of satellite particles in the HP, the area of in total 19 HP was calculated by manually determining the area (in pixels) of the central particle and the surrounding satellite particles on an image. By summing up these areas, the diameter of the hypothetically intact particle
before impacting on the Formvar film and the pro-portion of the satellite particles were calculated. The satellite particles contributed to up to 45 % to theDpa.
However, the satellite particles are small and contrast very weakly; thus, they are difficult to capture with im-age processing and the determination of morphologi-cal parameters was restricted to the core particles. The weak contrast with the substrate can biases the overall particle diameters of HP with a satellite type appear-ance towards smaller values and might contribute to a difference of the accumulation mode number max-imum in peak positions in the SEM and TDMPS de-rived size distributions.
The very different character of the aerosol particles and their partly irregular appearance require the use morphological pa-rameters for further characterization. All three types of par-ticles described above were investigated separately and the morphological descriptors elongation and circularity were determined for each type of particle in each sample.
To determine the uncertainty of our measurements, we refer to the results from both the number distribution as a function of equivalent diameters derived from the area of the projected particle (Dpa)based on SEM and subsequent
im-age mapping, and the number distribution as a function of mobility diameters (Dm)from the TDMPS data. The
under-lying assumption for both independent methods is that the particles are spherical. The air is in both applied methods sampled off the same sampling manifold, at the same RH (20 %) and charged with the same63Ni – emitting radioactive
E. Hamacher-Barth et al.: A method for sizing submicrometer particles 3469
45
1
2
Fig. 11: An example for a single particle (SP) with homogeneously distributed pixel
3
intensity across the aerosol particle.
4
5
Fig. 11. An example for a single particle (SP) with homogeneously distributed pixel intensity across the aerosol particle.
source. Both methods were calibrated against NIST traceable calibration standards of polystyrene latex spherical particles. The error of sizing (relative standard deviation) for the inde-pendent TMPS is less than 5 % (Wiedensohler et al., 2012), whereas for the SEM an error of sizing between 18 % for 20 nm spheres and 1.3 % for 900 nm spheres was established (Table 1). The error of sizing determined for the TDMPS in use during ASCOS is slightly larger than that reported by Mulholland et al. (2006) who states a 2 % deviation between SEM and TDMPS measurements for 100 nm PSL spheres.
Additionally for non-spherical particlesDmis a function
of particle shape and orientation (DeCarlo et al., 2004). Nev-ertheless, previous studies (Rogak et al., 1993; Park et al., 2004) on diesel exhaust, TiO2and Si particles have shown
thatDm∼Dpafor non-spherical particles below 400 nm. We
can thus assume that the diameters obtained from TDMPS and SEM imaging are directly comparable and the error in the TDMPS measurements due to non-sphericity of any aerosol particles can be ignored.
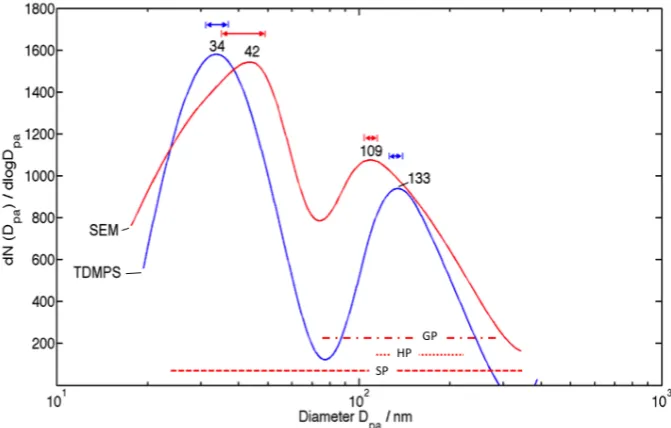
5.1.1 Discussion of Sample A
The SEM derived aerosol size distribution for Sample A (Fig. 9, red line) shows number maxima in the Aitken mode at 42 nm and in the accumulation mode at 109 nm diame-ters. The simultaneous TDMPS measurement (Fig. 9, blue line) shows corresponding peaks at 34 nm and 133 nm diam-eters. The size determination of PSL spheres in the Aitken mode region revealed a standard deviation of 4.1 nm (18 %) for 20 nm spheres and 4.1 nm (9.5 %) for 40 nm spheres
46
1
Fig. 12: An example for an ammonium sulfate particle which has partly collapsed under
2
the electron beam but kept its outer shape.
3
4
Fig. 12. An example for an ammonium sulfate particle which has partly collapsed under the electron beam but kept its outer shape.
1
Fig. 13: An example for an aerosol particle with a patchy appearance and an
2
inhomogeneous distribution of pixel intensity across the particle area (gel particle, GP).
3
4
Fig. 13. An example for an aerosol particle with a patchy appear-ance and an inhomogeneous distribution of pixel intensity across the particle area (gel particle, GP).
(Table 1). If a standard deviation of ca. 14 % for an ambi-ent aerosol particles in the Aitken mode is assumed, and an at least 5 % uncertainty (relative standard deviation) for the TDMPS measurements (Wiedensohler et al., 2012), the po-sition of the Aitken mode peaks for the SEM and TDMPS derived diameters, 42 nm and 34 nm, respectively, lies within
3470 E. Hamacher-Barth et al.: A method for sizing submicrometer particles
48
1
Fig. 14: An example for a satellite type structure of an aerosol particle (halo particle, HP).
2
When the aerosol particle impacts on the TEM formvar film it probably splashes out
3
forming a number of small satellite particles surrounding a larger central core particle.
4
5
Fig. 14. An example for a satellite type structure of an aerosol par-ticle (halo parpar-ticle, HP). When the aerosol parpar-ticle impacts on the TEM Formvar film it probably splashes out forming a number of small satellite particles surrounding a larger central core particle.
the statistical range of uncertainty determined for particles in this size range.
The accumulation mode maximum at 109 nm for the SEM derived size distribution corresponds to the TDMPS peak at 133 nm diameter. Using the standard deviation of the PSL sphere diameters in this size range, we can assume ca. 5 % uncertainty for the aerosol particles in the accumulation mode for SEM derived diameters. We conclude that the po-sition of the accumulation mode peaks for both SEM and TDMPS measurements at 109 nm and 133 nm do not lie within the statistical range of uncertainty determined for par-ticles within this size range (see Fig. 9).
The differences in peak positions, however, suggest that the particles occurring at 133 nm diameter in the TDMPS size distribution is partly underestimated in the SEM mea-surements and their diameters are shifted towards the maxi-mum at 109 nm.
To improve the understanding of the causes for the ob-served shift in the position of accumulation mode maximum, we determined the morphological parameters elongation and circularity of the observed particle types (Table 2).
– Single particles (SP) appear in the 30–300 nm diameter size range and show a mean elongation of 0.334 and a mean circularity of 0.845; they comprise 85 % of the total particle number.
– Gel particles (GP) appear mainly in the 70–322 nm di-ameter size range with a mean elongation of 0.639 and a circularity of 0.728. They comprise 10 % of the total particle number.
Table 2. Morphological parameters elongation and circularity with size ranges and number of particles for the observed particle types in Samples A and B.
Single particles (SP) Number of
particles Size range Elongation Circularity
Sample A 310 30–300 nm 0.334±0.08 0.845±0.07
Sample B 307 30–300 nm 0.176±0.090 0.670±0.209 Halo particles (HP)
Number of
particles Size range Elongation Circularity
Sample A 19 116–227 nm 0.14±0.067 0.830±0.08
Sample B 23 51–233 nm 0.090±0.05 0.845±0.067
Gel particles (GP) Number of
particles Size range Elongation Circularity
Sample A 36 70–322 nm 0.639±0.077 0.728±0.142
Sample B 32 70–532 nm 0.212±0.089 0.165±0.072
– Halo particles (HP) comprise 5 % of the total particle number and their appearance is restricted to the accu-mulation mode region between 116–227 nm diameters. The central particles of the HP show a mean elongation of 0.140 and a circularity of 0.830.
Due to the particle properties and the observed shift in the ac-cumulation mode, it can be anticipated that the aerosol par-ticle sizes are underestimated due to their partly very weak contrast with the background, especially for GP, and the diffi-culty to quantitatively capture all satellite particles of the HP. The overall size distributions, however, show similar peak intensities and positions for both methods.
Volatile organic compounds can evaporate under the elec-tron beam (Gelencsér, 2004). Pósfai et al. (1998) discuss the evaporation of volatile compounds from ammonium sulfate aerosol particles at an accelerating voltage of 200 kV. They observed a decrease of the particle diameter by 20±5 % and recognized a dark halo on the Formvar-coated Cu TEM grids marking the area around the particles where evaporation oc-curred. In our study an accelerating voltage of 2 kV and Gen-tle Beam mode were applied. These very mild conditions were chosen to minimize the risk of evaporative losses and damaging of the aerosol particles through the electron beam. No signs of evaporation in form of halo-like shadows around the aerosol particles were observed in our study and thus evaporative loss of volatile organic compounds can be ex-cluded as a cause for the observed differences in the position of the accumulation mode maximum in SEM and TDMPS size distributions.
5.1.2 Discussion of Sample B
Imaged by SEM, Sample B shows aerosol number maxima at 47 nm in the Aitken mode and at 122 nm, with a shoulder
at 200 nm, in the accumulation mode (Fig. 10, red line). The corresponding TDMPS measurements show peak maxima in the Aitken mode at 52 nm and in the accumulation mode at 166 nm diameters (Fig. 10, blue line) and no visible shoul-der to larger sizes. Assuming the same ranges of uncertain-ties as for Sample A, the Aitken mode maxima show good agreement of the peak positions in the SEM and TDMPS measurements. The accumulation mode on the other hand is shifted by 44 nm to smaller diameters in SEM compared to the TDMPS measurements and thus does not show any over-lap. The aerosol particles and their morphological parameters showed the following characteristics:
– Single particles (SP) are observed between 30–300 nm diameters and account for 85 % of the particle number. These particles type shows a mean elongation of 0.176 and a mean circularity of 0.670.
– Gel particles (GP) are observed between 70 and 530 nm diameters and show an elongation of 0.212 and a circularity of 0.165. They account for 10 % of all aerosol particles in Sample B.
– Halo particles (HP) appear in the 50–230 nm diameter size range show an elongation of 0.090 and a mean circularity of 0.845; they account for 5 % of the total particle number.
As for Sample A we assumed that the aerosol particle diame-ters can be underestimated due to their sometimes very weak contrast with the background, as in the case for GP and satel-lite particles of HP. But as for Sample A no signs of evapora-tive losses were observed. The overall size distribution shows a bimodal peak pattern and similar peak intensities for both methods.
5.2 Comparison of Sample A and Sample B
One of the most probable sources for aerosol particles in the Arctic is the surface water and specifically the surface micro-layer of the open water leads within the pack-ice re-gion (Leck et al., 2002; Leck and Bigg, 2005a; Bigg and Leck, 2008; Orellana et al., 2011). The subsequent transfor-mation processes the aerosol particles can undergo once they are airborne (e.g., through condensation of vapors) are im-portant since they affect the aerosol’s cloud droplet activa-tion ability (Bigg and Leck, 2001b; Lohman and Leck, 2005; Martin et al., 2011).
Aerosol particles observed in both samples have been col-lected in air masses that spent different length of times over the pack-ice since last contact with the open sea. Provided that the MIZ is a strong source of aerosol particles, air masses with a short DOI (0.9 days, Sample A) carrying freshly emit-ted airborne aerosol particles favors a strong Aitken mode, whereas a long DOI (4.5 days, Sample B) leads to a more pronounced accumulation mode after days of processing in the air (Hoppel et al., 1986). Furthermore it has to be noticed
that the difference between SEM and TDMPS derived peak diameters of the accumulation mode of Sample B (44 nm in difference, Fig. 10) is much higher than that of Sample A (24 nm in difference, Fig. 9). This difference might be caused by a higher degree of underestimation of the particle area for GP and satellite particles of HP in Sample B due to the more weakly contrasting material present on the grid. Orellana and Verdugo (2003) showed that UV light destabilizes marine gels, and it might be possible that for longer DOI and thus a potentially longer exposure to UV light and other destabiliz-ing factors has led to a weakendestabiliz-ing of the polymeric network and thus a decrease in density of the material that comprises the microgel in Sample B. We assume that this UV induced weakening of the polymeric might also lead to the generally larger peak diameters of the accumulation mode particles in Sample B (122 nm compared to 109 nm in Sample A).
In addition the morphological properties of the aerosol particles seem to change due to transport and transformation processes over the pack-ice. Circularity and elongation are both measures of the roundness of a particle, but elongation is predominantly an indicator of the overall form of a parti-cle, whereas circularity is sensitive to both the overall form (like elongation) and surface roughness (via CP2; see above). Adding these parameters provides a more effective differen-tiator than a simple comparison of the size distributions of both samples.
– Single particles (SP): the values for elongation and cir-cularity for SP in Sample A indicate (see Table 2) that the overall shape deviates from ideal sphericity to a larger extent than in Sample B. The SP in Sample B on the other hand exhibit a rougher contour than SP in Sample A:
– Elongation: with an elongation of 0.364 Sam-ple A particles have a stronger elliptical com-ponent (Dmax:Dmin≈2.00:1) than Sample B
particles with an elongation of 0.176 (Dmax:
Dmin≈1.42:1).
– Circularity: SP in Sample A shows a value for circularity of 0.845, whereas for Sample B par-ticles the value for circularity is 0.670. Calcu-lating the values for the Crofton perimeter (CP) for both samples reveals a 12 % larger value for CPBwith CPB: CPA= 1.12 : 1. The higher value
for CPBand thus a lower value for circularity for
SP in Sample B indicate particles with a rougher contour compared to particles in Sample A. – Gel particles (GP): in SEM this type of aerosol particle
shows a higher value for elongation in Sample A but particles with a higher deviation from ideal circularity and thus a rougher contour in Sample B.
3472 E. Hamacher-Barth et al.: A method for sizing submicrometer particles
Dmin=4.54 compared to GP in Sample B where
the elongation is 0.212 and the ratio of diameters isDmax:Dmin=1.54.
– Circularity: GP in Sample B show a higher de-viation from ideal circularity (0.165) compared to this type of particle in Sample A (circularity 0.728). The ratio of the Crofton parameters is CPA: CPB=2.10:1 which indicates a rougher
surface for GP in Sample B compared to Sam-ple A particles.
– Halo particles (HP): the central particles exhibit nearly no differences in morphology for both samples. Both samples show moderate degrees of elongation and de-viations from ideal circularity that do not indicate any differences due to a change in DOI.
– Elongation: the central particles in Sample A show a value for elongation of 0.14 and thus are slightly more elongated than the central particles in Sample B (elongation 0.09). The ratio of di-ametersDmax:Dminis 1.33 : 1 for particles from
Sample A, andDmax:Dmin=1.19:1 for
parti-cles from Sample B.
– Circularity: the circularity shows values of 0.83 for central particles of Sample A and 0.845 for Sample B. The ratio of the Crofton perimeter is calculated to CPA: CPB=1.008:1 which
indi-cates no significant differences in roughness for HP in both samples.
The size distributions for Sample A and B reveal some im-portant differences which might be causally related to dif-ferences in time of advection over the ice before reaching the position of the icebreaker, providing that the type of ma-rine sources was identical for both samples despite the ge-ographically separated emission areas (Barents and Green-land seas respectively Kara sea, see Fig. 8). For the SP and GP type particles investigated in this study, we observed a transition from an elongated and branched particle to more a closed structure with increased DOI. The lower value in elongation for SP in Sample B points towards a process that changes the particle to be more round shaped which is fa-vored by its longer DOI. The observed differences in circu-larity, however, indicated changes of the particles (GP and SP) towards a larger surface area (expressed by an increased value for CP and a lower circularity) due to the longer DOI in Sample B. The surface of the particles did change towards a rougher contour (e.g., by condensation of vapors on the particle surface). Whether these morphological changes lead to changes in hygroscopicity and the incorporation of mat-ter with surface-active properties, as it has been described for soot by Lehmann et al. (2006) and Coz and Leck (2011), deserves attention in future studies.
6 Conclusions
SEM operating at low accelerating voltage (2 kV) and in Gentle Beam modus provides an optimal condition to size aerosol particles collected on a Formvar-coated Cu TEM grid with a resolution down to 15 nm diameter. The accuracy of our method was verified by measurement of certified PSL standard spheres and subsequent digital image analysis. The diameter values stated by the manufacturer were reproduced with high accuracy and morphological parameters (elonga-tion, circularity) were determined. The standard deviation of the diameters was better than 10 % for spheres larger than 40 nm and±18 % for spheres of 21 nm diameter.
We applied our method to two samples of aerosol par-ticles collected in the high Arctic during the ASCOS ex-pedition in the summer of 2008. Size distributions as well as morphological parameters (elongation, circularity) were obtained for each sample. By comparing the size distribu-tions with those from simultaneously and independently per-formed TDMPS measurements we demonstrated that a rep-resentative fraction of the ambient aerosol was captured with the same bimodal characteristics as in TDMPS. The method of SEM/image mapping of individual particles provides in-formation not only on particle size but also on particle mor-phology, not seen by the TDMPS-method. Understanding particle morphology is important for an understanding of possible aerosol transformation processes in the atmosphere and the role of aerosol particles as embryos in cloud droplet activation.
However, using the digital image processing on weakly contrasting constituents bears the risk of underestimating the area of the projected particle. This limitation was observed in the accumulation mode as a shift of particle sizes to smaller diameters. This was seen for particles that were characterized by either an inhomogeneous distribution of intensity across the particle area (GP) or appear as a large central particle surrounded by smaller satellite particles (HP). However, its was fortunate that SP-type particles with their homogeneous distribution of intensity on the digital image contrasted well against their background and thus showed a good agreement in modal peak diameters with those measured by TDMPS.
Acknowledgements. This work is part of ASCOS (Arctic Summer Cloud Ocean Study) and was made possible by funding from the Swedish Research Council, the Knut and Alice Wallenberg Foundation and the DAMOCLES European Union 6th Framework Program Integrated Research Project. The Swedish Polar Research Secretariat (SPRS) provided access to the icebreaker Oden and logistical support. We are greatly indebted to Oden’s Captain Mattias Peterson and his crew for invaluable assistance with all the logistical challenges. Michael Tjernström are specifically thanked for his co-coordination of ASCOS. ASCOS is an IPY project under the AICIA-IPY umbrella and an endorsed SOLAS project. The
authors thank Andreas Held for collecting the particles during ASCOS 2008, and A. Öhrström and C. Rauschenberg for their help with sample imaging.
Edited by: I. Brooks
References
Allen, T.: Particle Size Measurement, Vol. 1, Chapman & Hall, Lon-don, 1997.
Andreae, M. O. and Crutzen, P. J.: Atmospheric aerosols: biogeo-chemical sources and role in atmospheric chemistry, Science, 276, 1052–1058, 1997.
Baker, M. B.: Cloud microphysics and climate, Science, 276, 1072– 1078, 1997.
Bates, T. S., Cline, J. D., Gammon, R. H., and Kelly-Hansen, S. R.: Regional and seasonal variations in the flux of oceanic dimethyl-sulfide to the atmosphere, J. Geophys. Res., 92, 2930–2938, 1987.
Bigg, E. K. and Leck, C.: Properties of the aerosol over the central Arctic Ocean, J. Geophys. Res., 106, 32101–32109, 2001a. Bigg, E. K. and Leck, C.: Cloud active particles over the central
Arctic ocean, J. Geophys. Res., 106, 32155–32166, 2001b. Bigg, E. K. and Leck, C.: The composition of fragments of
bub-bles bursting at the ocean surface, J. Geophys. Res. 113, D11209, doi:10.1029/2007JD009078, 2008.
Bigg, E. K., Leck, C., and Tranvik, L.: Particulates of the surface microlayer of open water in the central Arctic Ocean in summer, Mar. Chem., 91, 131–141, 2004.
Capannelli, G., Castello, E., Comite, A., Costa, C., and Mamolini, G.: Electron microscopy characterization of airborne micro- and nanoparticulate matter, J. Electron Microsc., 60, 117–131, 2011. Charlson, R. J., Schwartz, S. E., Hales, J. M., Cess, R. D., Coakley Jr., J. A., Hansen, J. E., and Hofman, D. J.: Climate forcing by anthropogenic aerosol, Science, 255, 423–430, 1992.
Covert, D. S., Wiedensohler, A., Aalto, P., Heintzenberg, J., Mc-Murry, P. H., and Leck, C.: Aerosol number size distributions from 3 to 500 nm diameter in the arctic marine boundary layer during summer and autumn, Tellus, 48B, 197–212, 1996. Coz, E. and Leck, C.: Morphology and state of mixture of
atmo-spheric soot aggregates during the winter season over Southern Asia – a quantitative approach, Tellus, 63B, 107–116, 2011. Coz, E., Artínano, B., Robinson, A. L., Casuccio, G. S., Lersch, T.
L., and Pandis, S. N.: Individual Particle Morphology and Acid-ity, Aerosol. Sci. Tech., 42, 224–232, 2008.
DeCarlo, P. F., Slowik, J. G., Worsnop, D. R., and Davidovits, P.: Particle morphology and density characterization by combined mobility and aerodynamic diameter measurements. Part 1: The-ory, Aerosol Sci. Tech., 38, 1185–1205, 2004.
Dixkens, J. and Fissan, H.: Development of an Electrostatic Pre-cipitator for Off-Line Particle Analysis, Aerosol. Sci. Tech., 30, 438–453, 1999.
Draxler, R. R. and Rolph, G. D.: HYSPLIT (HYbrid Single-Particle Lagrangian Integrated Trajectory) Model, NOAA ARL READY Website, available at: http://ready.arl.noaa.gov/HYSPLIT.php (last access: 15 May 2013), NOAA Air Resources Laboratory, Silver Spring, MD, 2011.
Facchini, M. C., Rinaldi, M., Decesari, S., Carbone, C., Finessi, E., Mircea, M., Fuzzi, S., Ceburnis, D., Flanagan, R., Nilsson, E.
D., de Leeuw, G., Martino, M., Woeltjen, J., and O’Dowd, C. D.: Primary submicron marine aerosol dominated by insoluble organic colloids and aggregates, Geophys. Res. Lett., 35, 17814– 17819, 2008.
Freedman, M. A., Baustian, K. J., Wise, M. E., and Tolbert, M. A.: Characterising the morphology of organic aerosols at ambient temperature and pressure, Anal. Chem., 82, 7965–7972, 2010. Gelenscér, A.: Carbonaceous Aerosol, Springer, Dordrecht, The
Netherlands, p. 167, 2004.
Haywood, J. M. and Boucher, O.: Estimates of the direct and in-direct radiative forcing due to tropospheric aerosols: A review, Rev. Geophys., 38, 513–543, 2000.
Heard, M. and Wiffen, R.: Electron microscopy of natural aerosols and the identification of particulate ammonium sulphate, Atmos. Environ., 3, 337–340, 1969.
Heintzenberg, J. and Leck, C.: The summer aerosol in the central Arctic 1991–2008: did it change or not?, Atmos. Chem. Phys., 12, 3969–3983, doi:10.5194/acp-12-3969-2012, 2012.
Heintzenberg, J., Leck, C., Birmili, W., Wehner, B., Tjernström, M., and Wiedensohler, A.: Aerosol number-size distributions during clear and fog periods in the summer high Arctic: 1991, 1996 and 2001, Tellus B, 58, 41–50, 2006.
Hinds, W.: Aerosol Technology, 2nd Edn., John Wiley & Sons, New York, 1999.
Hoppel, W. A., Frick, G. M., and Larson, R. E.: Effect of non-precipitating clouds on the aerosol size distribution in the marine boundary layer, Geophys. Res. Lett., 13, 125–128, 1986. Huck, D.: Particle shape – an important parameter in
pharmaceu-tical manufacturing, Chem. Europe, available at: http://www. chemeurope.com, last access: 24 April 2013.
IPCC: Climate Change 2007: The Physical Science Basis, Con-tribution of Working Group I to the Fourth Assessment Report of the Intergovernmental Panel on Climate Change, edited by: Solomon, S., Qin, D., Manning, M., Chen, Z., Marquis, M., Av-eryt, K. B., Tignor M., and Miller, H. L., Cambridge University Press, Cambridge, New York, 2007.
Junge, C.: Die Konstitution des atmosphärischen Aerosols, Annalen der Meteorologie, 1–15, 1952.
Kandler, K., Benker, N., Bundke, U., Cuevas, E., Ebert, M., Knip-pertz, P., Rodriguez, S., Schuetz, L., and Weinbruch, S.: Chemi-cal composition and complex refractive index of Saharan Mineral Dust at Izana, Tenerife (Spain) derived by electron microscopy, Atmos. Environ., 41, 8058–8074, 2007.
Karl, M., Leck, C., Coz, E., and Heintzenberg, J.; Marine nanogels as a source of atmospheric nanoparticles in the high Arctic, Geo-phys. Res. Lett., 40, 3738–3743, doi:10.1002/grl.50661, 2013. Kerminen, V. M. and Leck, C.: Sulfur chemistry over the central
Arctic Ocean during the summer: Gas-to-particle transformation, J. Geophys. Res., 106, 32087–32099, 2001.
Lannefors, H., Heintzenberg, J., and Hansson, H.-C.: A compre-hensive study of physical and chemical parameters of the Arctic summer aerosol; results from the Swedish expedition Ymer-80, Tellus, 35B, 40–54, 1983.
Laskin, A., Cowin, J., and Iedema, M.: Analysis of individual environmental particles using modern methods of electron mi-croscopy and X-ray microanalysis, J. Electron Spectrosc., 150, 260–274, 2006.
3474 E. Hamacher-Barth et al.: A method for sizing submicrometer particles
Leck, C. and Bigg, E. K.: Biogenic particles in the surface micro-layer and overlaying atmosphere in the central Arctic Ocean dur-ing summer, Tellus, 57B, 305–316, 2005a.
Leck, C. and Bigg, E. K.: Evolution of the marine aerosol – A new perspective, Geophys. Res. Lett., 32, L19803, doi:10.1029/2005GL023651, 2005b.
Leck, C. and Bigg, E. K.: Comparison of sources and nature of the tropical aerosol with the summer high Arctic aerosol, Tellus, 60B, 118–126, 2008.
Leck, C. and Bigg, E. K.: New particle formation of marine biolog-ical origin, Aerosol Sci. Tech., 44, 570–577, 2010.
Leck, C. and Persson, C.: Seasonal and short-term variability in dimethyl sulfide, sulfur dioxide and biogenic sulfur and sea salt aerosol particles in the arctic marine boundary layer during sum-mer and autumn, Tellus, 48B, 272–299, 1996a.
Leck, C. and Persson, C.: The central Arctic ocean as a source of dimethyl sulfide: seasonal variability in relation to biological ac-tivity, Tellus, 48B, 156–177, 1996b.
Leck, C., Bigg, E. K., Covert, D. S., Heintzenberg, J., Maenhaut, W., Nilsson, E. D., and Wiedensohler, A.: Overview of the atmo-spheric research program during the International Arctic Ocean Expedition 1991 (IAOE-91) and its scientific results, Tellus, 48B, 136–155, 1996.
Leck, C., Nilsson, E. D., and Bäcklin, L.: The atmospheric program of the Arctic Ocean Expedition in the summer of 1996 (AOE-96) – A technical overview – Outline of experimental approach, instruments, scientific objectives, J. Geophys. Res., 106, 32051– 32067, 2001.
Leck, C., Norman, M., Bigg, E. K., and Hillamo, R.: Chemical com-position and sources of the high Arctic aerosol relevant for cloud formation, J. Geophys. Res., 107, 1–17, 2002.
Leck, C., Tjernström, M., Matrai, P., Swietlicki, E., and Bigg, E. K.: Can marine micro-organisms influence melting of the Arctic pack-ice?, Eos, 85, 25–36, 2004.
Lehmann, J., Gaunt, J., and Rodon, M.: Bio-char sequestration in terrestrial ecosystems – a review, Mitigation and Adaptation Strategies for Global Change, 11, 403–427, 2006.
Lohmann, U. and Feichter, J.: Global indirect aerosol effects: a re-view, Atmos. Chem. Phys., 5, 715–737, doi:10.5194/acp-5-715-2005, 2005.
Lohmann, U. and Leck, C.: Importance of submicron surface active organic aerosols for pristine Arctic clouds, Tellus, 57B, 261–268, 2005.
Martin, M., Chang, R. Y.-W., Sierau, B., Sjogren, S., Swietlicki, E., Abbatt, J. P. D., Leck, C., and Lohmann, U.: Cloud condensation nuclei closure study on summer arctic aerosol, Atmos. Chem. Phys., 11, 11335–11350, doi:10.5194/acp-11-11335-2011, 2011. McFarquhar, G. M., Um, J., and Jackson, R.: Small cloud parti-cle shapes in mixed-phase clouds, J. Appl. Meteorol. Clim., 52, 1277–1293, doi:10.1175/JAMC-D-12-0114.1, 2013.
Meyer, F.: Mathematical Morphology: from two dimensions to three dimensions, J. Microsc., 165, 5–28, 1992.
Michael, J. R., Joy, D. C., and Griffin, B. J.: Use of
sam-ple bias voltage for low-energy high-resolution
imag-ing in the SEM, Microsc. Microanal., 16, 614–615,
doi:10.1017/S1431927610055315, 2010.
Mulholland, G. W., Donnelly, M. K., Hagwood, C. R., Kukuck, S. R., and Hackley, V. A.: Measurement of 100 nm and 60 nm
parti-cle standards by differential mobility analysis, J. Res. Natl. Inst. Stan., 111, 257–312, 2006.
Nilsson, D. E. and Barr, S.: Effects of synoptic patterns on atmo-spheric chemistry and aerosols during the Arctic Ocean Expedi-tion 1996, J. Geophys. Res., 106, 32069–32086, 2001.
Ocker, B., Wurster, R., and Seiler, H.: Investigation of nanoparticles in high resolution Scanning Electron Microscopy (SEM) and low voltage SEM by digital image analysis, Scanning Microscopy, 9, 63–73, 1995.
Orellana, M. V. and Verdugo, P.: Ultraviolet radiation blocks the organic carbon exchange between the dissolved phase and the gel phase in the ocean, Limnol. Oceanogr., 48, 1618–1623, 2003. Orellana, M. V., Matrai, P. A., Leck, C., Rauschenberg, C. D., Lee,
A. M., and Coz, E.: Marine microgels as a source of cloud con-densation nuclei in the high Arctic, P. Natl. Acad. Sci., 108, 13612–13617, 2011.
Park, K., Kittelson, D. B., and McMurry, P. H.: Structural proper-ties of diesel exhaust particles measured by transmission electron microscopy (TEM): relationships to particle mass and mobility, Aerosol Sci. Tech., 38, 881–889, 2004.
Parungo, F. and Nagamoto, C.: Temporal and spatial variations of marine aerosols over the Atlantic Ocean, Atmos. Res., 20, 23–37, 1986.
Poelt, P., Schmied, M., Obernberger, I., Brunner, T., and Dahl, J.: Automated analysis of submicron particles computer-controlled Scanning Electron Microscopy, Scanning, 24, 92–100, 2002. Pósfai, M., Xu, H., Anderson, J. R., and Buseck, P. R.: Wet and dry
sizes of atmospheric particles: An AFM-TEM study, Geophys. Res. Lett., 25, 1907–1910, 1998.
Rocha, S., Krastev, R., Thünemann, A. F., Pereira, M. C., Möhwald, H., and Bezesinski, G.: Adsorption of amyloid ß-peptide at poly-mer surfaces: a neutron reflectivity study, Chem. Phys. Chem., 6, 2527–2534, doi:10.1002/cphc.200500158, 2005.
Rogak, S. N., Flagan, R. C., and Nguyen, H. V.: The mobility and structure of aerosol aggregates, Aerosol Sci. Tech., 18, 25–47, 1993.
Rolph, G. D.: Real-time Environmental Applications and Display sYstem (READY) Website, available at: http://ready.arl.noaa.gov (last access: 15 May 2013), NOAA Air Resources Laboratory, Silver Spring, MD, 2011.
Serra, J.: Image Analysis and Mathematical Morphology, Vol. 2: Theoretical Advances Academic Press, London, p. 309, 1988. Shupe, M. D., Daniel, J. S., De Boer, G., Eloranta, E. W., Kollias, P.,
Long, C. N., Luke, E. P., Turner, D. D., and Verlinde, J.: A focus on mixed-phase clouds, B. Am. Meteorol. Soc., 89, 1549–1562, 2008.
Stevens, S. M., Jansson, K., Xiao, C., Asahina, S., Klingstedt, M., Grüner, D., Sakamoto, Y., Keiichi, M., Cubillas, P., Brent, R., Han, L., Che, S., Ryoo, R., Zhao, D., Anderson, M., Schüth, F., and Terasaki, O.: An Appraisal of High Resolution Scanning Electron Microscopy to Porous Material, JEOL news, 44, 17–22, 2009.
Stolzenburg, M. R.: An ultrafine aerosol size distribution measur-ing system, Ph. D. Thesis, Department, University of Minnesota, Minneapolis, USA, 1988.
Terasaki, O., Cho, H. S., Cho, M., Jeong, H. Y., Asahina, S., Sakuda, Y., Suga, M., Kazumori, H., Kudo, M., Nokuo, T., Liu, Z., Stevens, S. M., Anderson, M. W., GaleanoNunez D. C., Schüth, F., Kjellman, T., Alfredsson, V., Ha, L., Che, S., Deng, H., Yaghi,
O., Cho, K., and Ryoo, R.: Novel structural characterisations of insulating and electron beam sensitive materials employing low voltage high resolution scanning electron microscopy, JEOL News, 48, 21–31, 2013.
Tjernström, M., Leck, C., Persson, P. O., Jensen, M., Oncley, S., and Targino, A.: The summertime arctic atmosphere: Meteorological measurements during the Arctic Ocean Experiment 2001 (AOE-2001), B. Am. Meteorol. Soc., 85, 1305–1321, 2004.
Tjernström, M., Birch, C. E., Brooks, I. M., Shupe, M. D., Pers-son, P. O. G., Sedlar, J., Mauritsen, T.