Lincoln
University
Digital
Thesis
Copyright
Statement
The
digital
copy
of
this
thesis
is
protected
by
the
Copyright
Act
1994
(New
Zealand).
This
thesis
may
be
consulted
by
you,
provided
you
comply
with
the
provisions
of
the
Act
and
the
following
conditions
of
use:
you
will
use
the
copy
only
for
the
purposes
of
research
or
private
study
you
will
recognise
the
author's
right
to
be
identified
as
the
author
of
the
thesis
and
due
acknowledgement
will
be
made
to
the
author
where
appropriate
you
will
obtain
the
author's
permission
before
publishing
any
material
from
the
thesis.
A thesis
submitted in partial fulfilment of the requirements for the Degree
of
Doctor of Philosophy in
Department of Horticulture Lincoln University
by Jianlu Zhang
CERTIFICATE OF SUPERVISION
This is to certify that the experimental work reported in this thesis was planned, executed, implemented, analyzed and described by J. Zhang under our direct joint supervision.
G.F. Thiele Reader in
Department of Horticulture
R.N. Rowe
Abstract of a thesis submitted inpartial fulfilment of the requirements for the Degree of Doctor of Philosophy
APPLE TREE SYSTEM RESEARCH by
J.
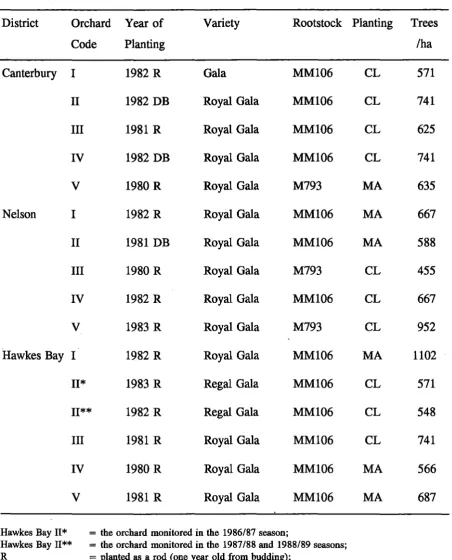
ZhangThis has been a co-operative research project between the Ministry of Agriculture and Fisheries, Division of Horticulture and Processing, DSIR, New Zealand Apple and Pear Marketing Board, The New Zealand Fruitgrowers Federation and the Department of Horticulture, Lincoln University commenced in the winter of 1986. The objective was to monitor 15 Royal Gala or Gala apple orchards in the three main apple producing regions of New Zealand to produce a data base for modelling biological and financial interactions. Selected trees were continuously monitored for three growing seasons. One orchard was continuously monitored for another 3 years (in the third additional year for the purpose of model validation). The orchards were 5 - 8 years old during the first monitoring season. Twelve of the orchards were on MM106 rootstock and the remainder on M793. Tree density ranged from 455 - 1102/ha. Five trees were monitored for fruit number and fruit quality in each orchard at harvest. Three branches from each monitored tree were chosen to record the number of flowers and fruits before thinning and after thinning.
To establish a fruit tree branch sampling system which can be reliably extrapolated to a whole tree basis, measurements from 204 trees, 151 parent branches and 9283 sub-branches were involved. Wood density was measured and the estimation of the volume of a branch, and the ratio of the branch to the whole tree, compared. Evidence is presented to show that the ratio of the sum of branch cross sectional area (CSA) to the trunk CSA is equal to the ratio of fruitfulness of the whole tree to fruitfulness of the sum of the branches. A
Climatic data from 7 meterological stations was used, incorporating temperature, sunshine hours and rainfall. For each season the orchards were monitored, climatic data was recorded for the period October in the previous growing season until harvest time (March) of the current season, a total of 18 months in each case. Correlation calculations were attempted for all monthly combinations. Contour maps of correlation coefficients between tree parameters and monthly combinations of climatic data are presented to show the major effects of climate on fruit production. The production of multiple regressions has been focused on a range of tree parameters, with relevant climatic data from the contour maps added, to refine the mathematical relationships. Higher maximum temperatures in the period of March and April produced higher initial fruit set (r
=
0.54**) the following springsuggesting an effect on quality of the flower. Lower maximum temperatures in the late dormant period (August to September) produced a higher initial fruit set (r = -0.40**) as well. The natural simple regression between initial fruit set and flower number per cross sectional area (CSA) gives an r value of -0.47** indicating that the more flowers on a tree the lower the percentage initial fruit set. Introduction of the climatic effects produces a refined multiple regression with an r value at 0.76**. A negative correlation for estimating fruit number/ha after thinning was determined (r
=
-0.78**).The estimation of fruit volume from fruit diameter was explored. Fruit growth curves based on fruit diameter or volume were plotted for 2 growing seasons. The influence of
temperature on fruit growth is documented. Fruit size variation was explored and the sampling size for estimating average fruit weight is recommended. Itis demonstrated how fruit number after thinning can be extrapolated to estimate total yield, fruit size and size distribution at harvest. Average fruit size was positively correlated with November to February temperatures in the previous season and also maximum temperatures in the December to January period prior to harvest. A negative correlation with fruit size was found for minimum temperatures in May. All these improved knowledge on the relationship between average fruit size and fruit number after thinning, but the maximum temperatures in December and January were critical in providing more accurate information (r = 0.81**) for harvest predictions.
For management planning it is necessary to relate yield, fruit quality and size distribution, revenue and cost data, in order to calculate annual gross margins. A set of dynamic
produced for practical orchard application. At the blossom and pre-thinning stages of fruit production, model users may specify parameters recorded from their own trees (eg flower numbers) and climatic data to predict tree behaviour for the next stage. At the post-thinning stage, model users may again specify parameters recorded from their own trees (eg fruit number) and climatic data to predict yield and fruit size distribution at harvest. These predictions can be correlated with financial data such as price realisations for the fruit and production and harvesting costs, to minimise estimated net return. The models allow annual climatic data to be balanced against biological parameters (eg fruit number) in order to minimise costs and maximise gross income and annual gross margins. For example, the required fruit number per tree after thinning can be correlated with the size grade distribution which will maximise returns, incorporating weather, cost and other key management
parameters.
Carbohydrate reserves in the dormant period are of primary importance for fruit production in the following year. The storage of starch in different parts or organs of apple trees was compared. The concentration of starch in the root system is much higher than that in the above ground parts. Observations of root growth and photos provided the evidence that roots continued to grow in the dormant period in Canterbury. Non-structural young rootlets contained almost no starch. For secondary roots, on average, thin roots contained higher concentrations of starch than thicker roots. However, results indicated there is greater variation of starch concentration in thinner roots. Results also showed that the starch content in root bark is much higher than that in root wood. The sampling variation may be reduced when bark and wood are separately tested. This is because the ratio of bark to wood is different for different roots. To minimize the variation, the bark of roots above 1 cm in diameter is recommended for analysis. Under 3 different crop loads, starch content was measured using replicates of 6 roots per tree and 3 trees per treatment. Starch content under light crop load conditions was significantly higher than that of middle and high crop loads, indicating a negative correlation with crop load in the growing season. A negative
relationship between the content of starch and soluble sugar was found, reflecting the vigour of root growth. For the following year's production, higher yield or fruit number was positively correlated with the stored starch level or negatively correlated with the yield or fruit number in the previous growing season.
KEYWORDS: apple (Malus domestica. L.), bark, climate, crop load, cross sectional area (CSA), fruitfulness, fruit number, fruit size, fruit size distribution, model, monitor,
CONTENTS
Title i
Certificate of supervision 11
Abstract... iii
Contents V11 List of tables xiii List of figures XVI List of plates xix Chapter 1 Chapter 2 Introduction 1 Literature review 3 2.1 Modelling research in Pomo10gy 3 2.1.1 Chilling requirement 3 2.1.2 Modelling of tree growth... 5
2.1.2.1 Tree growth and trunk... 5
2.1.2.2 Leaf area 6 2.1.3 Modelling of the carbon budget... 8
2.1.3.1 Respiration... 8
2.1.3.2 Light 10 2.1.3.3 Photosynthesis 11 2.1.3.4 Dry matter production... 12
2.1.4 Modelling of nitrogen... 15
2.1.5 Modelling of evapotranspiration... 17
2.1.6 Modelling of physical injuries... 18
2.2 Effect of climate on fruit production... 18
2.2.1 Spring frost... 19
2.2.2 Non-extreme weather conditions and their effect on apple production. 19 2.2.3 Effect of the previous autumn's weather... 20
2.2.4 Pre-blossom 21
2.2. 5 Post-blossom 23
2.2.7 Modelling of phenology ..
2.3 Production forecast .
2.3.1 Yield and trunk size .
2.3.2 Factors affecting fruit size .
2 3 3 F. . rul' t 'SIze pred'lCt'Ion .
2.3.4 Forecasting yield .
2.3.5 The distribution of fruit size ; ..
2.3.6 Economic simulation .
2.3.7 Software development strategy .
2.3.8 Research on yield potential .
2.3.9 Research on alternate bearing .
2.4 Carbohydrate reserves in Pomology .
2.4.1 Carbohydrates in various organs ..
2.4.1.1 Above ground .
2.4.1.2 Roots .
2.4.1.3 Flowers .
2.4.2 Seasonal changes .
2.4.2.1 Dormant period and early spring .
2.4.2.2 Diurnal changes .
2.4.2.3 Quantitative description .
2.4.3 Influence of alternate bearing on carbohydrate reserves ..
2.4.4 Other factors affecting carbohydrate reserves .
2.4.4.1 Age .
_ 2.4.4.2 Ringing .
2.4.4.3 Pruning .
2.4.4.4 Defoliation : .
2.4.4.5 Environmental factors .
2.4.5 Crop load adjustment .
2.5 Sampling techniques in Pomology ..
2.5.1 Sampling size .
2.5.1.1 The level of probability .
2.5.1.2 Fixed differences .
2.5.1.3 Accuracy limits .
2.5.2 Control of error .
2.5.3 Branch sampling ..
Chapter 3 Branch sampling 53
3.1 Introduction... . .. 53
3.2 Materials and methods :. 53 3.2.1 Measurement of wood volume and density of branches 53 3.2.2 Measurement of length, diameter and weight of branches and trees 54 3.2.3 CSA of branches and trunks 54 3.2.4 Fruit recording using branch sampling.... 54
3.3 Validation of wood density... 56
3.3.1 Relationships between branch volume and other factors... 56
3.3.2 Wood density... 58
3.4 Estimation of branch volume from density... 59
3.5 Estimation of the ratio of the sampled branch to all branches 60 3.5.1 Extrapolation from branch weight 61 3.5.2 Estimation of the "sum" of all branches 62 3.5.3 Examination of CSA relationships according to different branch order 64 3.5.4 CSA ratio 66 3.5.5 Fruitfulness (FFN) ratio... 68
3.6 Variation of the CSA ratios 69 3.6.1 Mature trees... 69
3.6.2 Branches of different orders... 70
3.6.3 Variation of ratios between orchards... 71
3.6.4 Branch number... 71
3.6.5 Age :... 72
3.6.6 Variation of branch fruitfulness (FFN) 73 3.6.7 Recommendations of branch selection... 78
3.7 Practical work 79 Chapter 4 Apple tree system modelling 82 4.1 Introduction... 82
4.3.1 Measurements on the monitored branches... 86
4.3.2 Measurements on the whole trees 87
4.3.3 Statistical validation for tree parameters.... 88
4.3.3.1 Tree parameter averages 88
4.3.3.2 Monitored branch parameter averages 89 4.3.3.3 Tree information extrapolated from monitored
branches 91
4.3.4 Data for the previous growing season.. 91
4.3.5 Fruit growth. '" 91
4.3.6 Meterological data collection 92
4.3.7 Multiple regression 93
4.4 Evaluation of predicting yield based on trunk CSA . 94 4.5 Initial fruit set... 96
4.5.1 Fruit set investigation... 96
4.5.2 The influence of tree parameters on initial fruit set 98 4.5.3 The Influence of climatic parameters on initial fruit set... 100
4.5.4 The model of initial fruit set 103
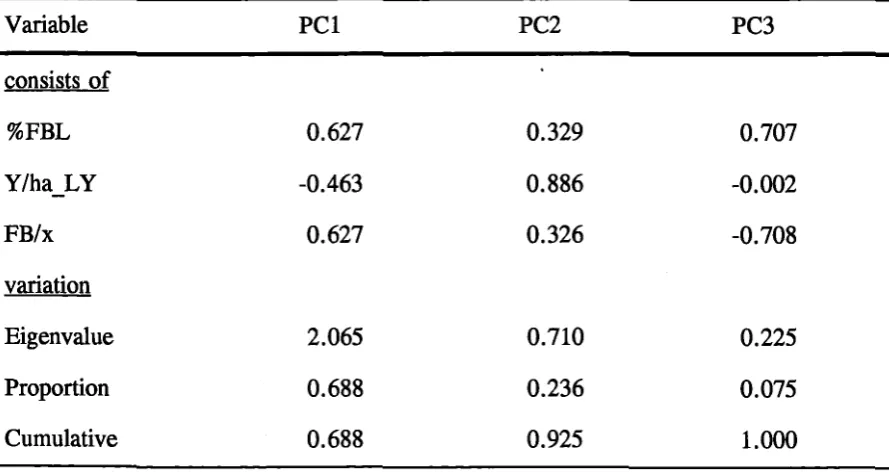
4.5.5 Application of principal component analysis... 104 4.5.5.1 Principal component analysis of the climatic
parameters in March of the previous season 105 4.5.5.2 Principal component analysis of the climatic
parameters in August of the current season 106 4.5.5.3 Principal component analysis of the tree parameters
relevant to initial fruit set... 107 4.5.5.4 Multiple regression using the principal components.. 108 4.6 Thinning :... 108 4.6.1 The influence of tree parameters on thinning 109 4.6.2 The influence of climatic parameters on thinning 110
4.6.3 The model of thinning 112
4.7 Pre harvest drop : 113
4.8 Fruit growth 114
4.8.1 Ratio of height to diameter of fruit 114
4.8.2 Fruit volume 114
4.8.3 Fruit growth curves 117
4.9 Fruit size variation 121
4.9.1 Fruit sampling 121
4.9.2 The effectiveness of fruit sampling to estimate average
fruit size... 124
4.9.3 Fruit weight distribution 126
4.9.4 Standard deviation of fruit weight... 127
4.9.5 Relative standard deviations... 127
4.9.6 Factors influencing the relative standard deviations 129 4.10 Average individual fruit weight and fruit distribution in the various
grades 131
4.10.1 The influence of tree parameters on average individual
fruit weight and fruit distribution in the various grades .... 132 4.10.2 The influence of climatic parameters on average individual
fruit weight 134
4.10.3 The influence of climatic parameters on fruit distribution
in the various grades 138
4.10.4 The model of average individual fruit weight. 138 4.10.4.1 Average individual fruit weight.. 138 4.10.4.2 Fruit distribution in the various grades... 144
4.11 An example of the model application 145
4.11.1 Assembling the model 145
4.11.2 Computer program design objectives... 147 4.11.3 Description of the computer program 148
c/
Chapter 5 Starch measurement 1525.1 Introduction... 152
5.2 Materials and methods 152
5.2.1 Starch analysis sampling for different parts of the trees
(analysis 1) 152
5.2.2 Starch analysis sampling for the roots under different crop
loads (analysis 2) 153
5.2.3 Measurement of starch 154
5.2.3.1 Solutions used 154
5.2.4Measurement of soluble sugars (Anthrone method) 157 5.2.5 Observation of root growth of apple trees during the
dormant period... 158
5.3 Stored starch in different parts of an apple tree 158 5.3.1 Variation of similar roots in the same trees 160 5.3.2 Starch content in wood and bark.. ... 161 5.4 Stored starch and soluble sugar in trees under different crop loads 162 5.4.1 Relationship between stored starch and different crop loads. 163 5.4.2Relationship between starch and soluble sugar .. ... ... 165 - 5.4.3 Observation of root growth of apple t.rees during the
dormant period 166
5.4.4 Relationship between the crop in two continuous years.. 168
Chapter 6 Discussion 171
6.1 6.2 6.3 6.4 6.5 6.6 6.7
Modelling from physiology to husbandry .
FrUlt SIze pr. , ed"Ictlon .
Fruit size distribution .
The complete production cycle .
Climatic data exploration .
Branch sampling and tree structure .
Database utility .
171 172 173 175 177 178 178
Acknowledgements 180
References 183
LIST OF TABLES 4 80 85 87
88
90 7 7 9 2238
62
63 67 68 74 43 55 5760
Chill units calculated by different models .
The constants (a) and the slopes (b) for the relationship between leaf area and
shoot length .
Parameters for sour cherry leaf and shoot growth ..
Estimated coefficients for respiration .
Controlled temperatures for experiments with apples .
Quantitative distribution of carbohydrates in l8-year-old Jonathan apple trees
in Mid-October .
Starch and soluble sugar concentration (mg/g dry matter) in organs in off and
on year trees of Wilking mandarin .
Trees and branches measured for CSA ..
Relationships of branch volume to length, CSA and weight .
Relationships between branch weight and other measurements (r values) .
Correlations between the ratio of weight of the individual sub-branches to the
sum of the weight of all branches on the parent branch with the equivalent
ratios of other measurements .
Relationship between the sum of branches and their main axis .
Comparison of a series of coefficients .
Comparison of CSA and FFN ratios ..
\
Variation of FFN of branches .
Comparison of different estimation methods with real FFN of the sum of
branches 76
3.10 Percentage of the sum of branch CSA remaining if small branches are
omitted ~ .
Basic orchard structure .
NZ Apple and Pear Marketing Board grade classifications .
Statistical validation of sampling: distribution of CVs (%) .
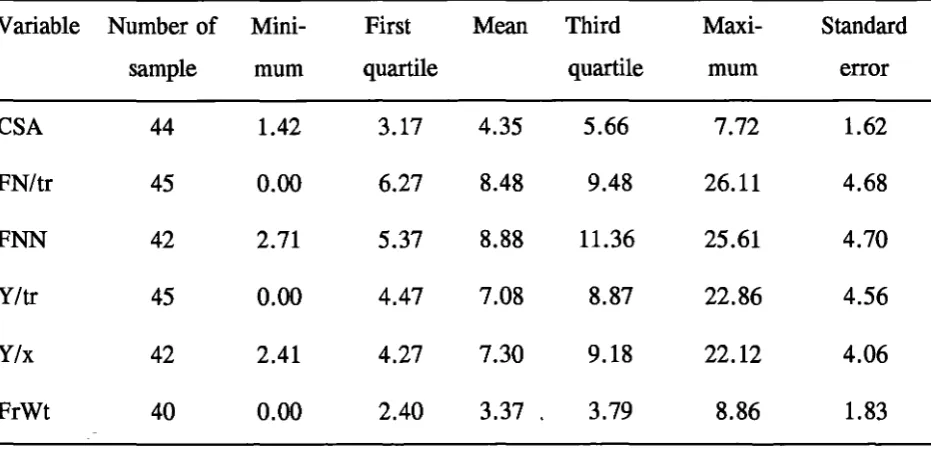
Sample details for tree parameters .
Statistical validation of sampling on monitored branches: distribution of
CVs (%) 90
Fruit set of king fruit and other fruit 98
4.8 Regressions of percentage initial fruit set to percentage lateral flower buds
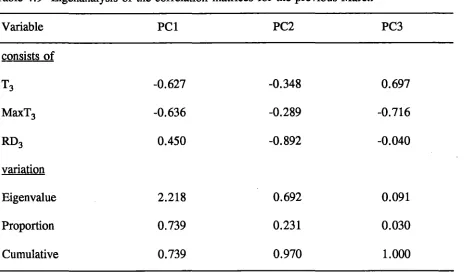
using asymptotic curve regression or log transformation... 99 4.9 Eigenanalysis of the correlation matrices for the previous March... 106 4.10 Eigenanalysis of the correlation matrices for climatic parameters in the
current August 107
4.11 Eigenanalysis of the correlation matrices for tree parameters relevant to
initial fruit set 107
4.12 Relationship of the percentage of fruits retained after thinning with
relevant tree parameters... 109
4.13 Adjustment factor for fruit volume calculation 115
4.14 Comparison of real average fruit weight with estimated average fruit weight. 125 4.15 Relationship of selected variables to relative standard deviation of fruit
weight 129
4.16 Correlaton of the percentage in each grade with average individual fruit
weight (r values) 131
4.17 Relationship of average individual fruit weight and fruit distribution with
other relevant tree parameters in the previous growing season 132 4.18 Relationship of average individual fruit weight and fruit distribution with
other relevant tree parameters in the flowering period 133 4.19 Relationship of average individual fruit weight and fruit distribution with
other relevant tree parameters during the growing season 133 4.20 Relationship of average individual fruit weight and fruit distribution on
different levels with other relevant tree parameters 134 5.1 Starch and soluble sugar content for different parts of trees 159 5.2 Starch and soluble sugar content in similar roots in the same trees... 160 5.3 Starch and soluble sugar content in wood and bark '" 161 5.4 The variation of starch and soluble sugar content in bark and wood
of similar roots from the same trees 162
5.5 Crop in the first year under low, medium and high crop loads 163 5.6 Starch and soluble sugar content in the roots of trees in July
following various crop loading 164
5.7 Relationships between root starch content in the dormant period and yield or
fruit number in the growing season (r values) 164
5.9 Relationships between root starch content in the dormant period and
cropping in the following growing season (r values) .... ... ... ... 169 5.10 Relationships of cropping index between the first and second growing
seasons (r values) 170
LIST OF FIGURES
3.1 Bourse shoots (in box) 57
3.2 Relationship between the ratio and the shoot diameter... 58 3.3 Distribution of wood density of an apple tree (N =89) .. 58 3.4 Relationship between shoot length and density... 59
3.5 Branches of an apple tree 61
3.6 Relationship between trunk CSA and the sum of branch CSA 65
3.7 Tree branches in different orders 65
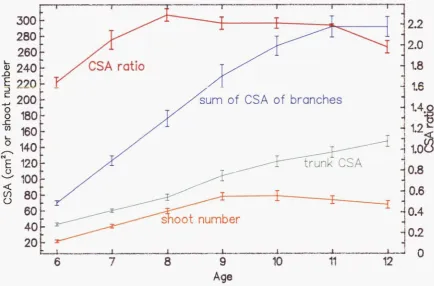
3.8 Relationship between the CSA ratio and the number of branches 72
3.9 CSA ratios in consecutive years 73
3.10 Histogram of fruit number per CSA of primary branches... 75 3.11 Histogram of fruit number per CSA of secondary branches... 75 3.12 Histogram of fruit number per CSA of primary branches after deleting
outliers at the 5%level 77
3.13 Relationship between fruit number per CSA of the monitored branch and its
CSA 78
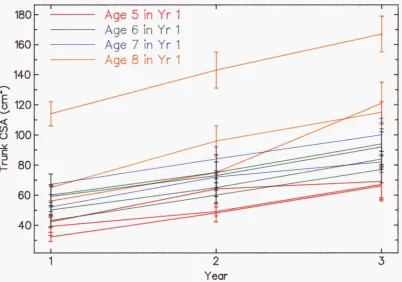
3.14 Relationship between fruit number on the monitored branch and its CSA 79 3.15 Relationship between fruit number per branch and per CSA of branch 79 4.1 Trunk CSA by years on each of 12 orchards... 95
4.2 Yield by years on each of 12 orchards... 95
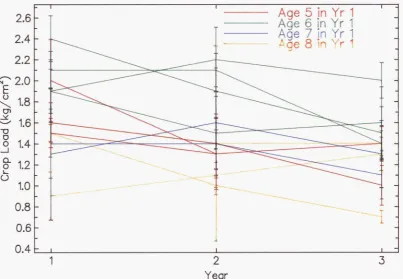
4.3 Crop load by years on each of 12 orchards... 96
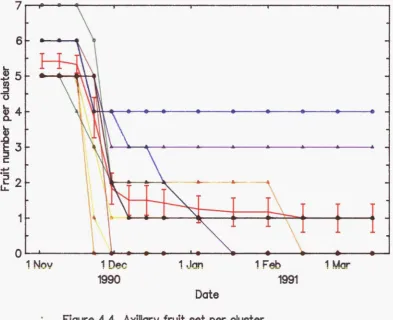
4.4 Axillary fruit set per cluster 97
4.5 Terminal fruit set per cluster... 97
4.6 %Initial fruit set: flower buds per CSA, avo Mar max temp (C) & avo
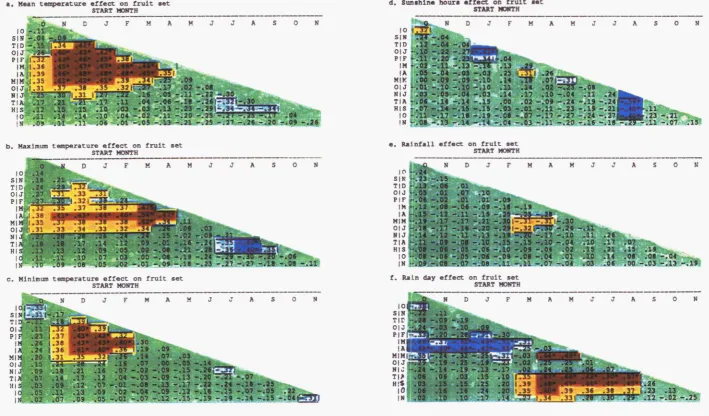
Aug - Sep max temp (C) :... 99 4.7 Contour map of r values for the relationships between fruit set and
chmatlc parameters 102
4.8 Relationship between %fruit remaining after thinning and fruit number/ha
before thinning 110
4.9 Contour map of r values for the relationships between thinning and
chmatlc parameters 111
4.10 Histogram of percentage of fruit remaining after pre harvest drop 113
4.11 Ratio of fruit length to diameter over time 116
4.13 Royal Gala fruit diameter in 1989/90 118
4.14 Royal Gala fruit volume in 1989/90 118
4.15 Golden Delicious fruit diameter in 1989/90 119
4.16 Golden Delicious fruit volume in 1989/90 119
4.17 Gala fruit diameter in 1990/91 120
4.18 Gala fruit volume in 1990/91 120
4.19 Flesh density changes over time... 122
4.20 Relationship between flesh density and fruit diameter 122
4.21 Relationship of the sample number to the coefficient of variation (CV) of the
standard error of the means for the monitored branches 123
4.22 Relationship of the sample number to the coefficient of variation (CV) of the
standard error of the means for random individual tree sampling 123
4.23 Relationship of the sample number to the coefficient of variation (CV) of
the standard error of the means for pooled sampling on an orchard basis 124
4.24 Comparison between normal distribution and actual distribution of fruit
weight 126
4.25 Histogram of standard deviation of fruit weight from tree samples on all
branches '" 127
4.26 Relationship between standard deviation and average fruit weight 128
4.27 Histogram of relative standard deviation 128
4.28 Contour map of r values for the relationships between relative fruit
weight standard deviation and climatic parameters 130
4.29 Contour map of r values for the relationships between average individual
fruit weight and climatic parameters 136
4.30 Contour map of r values for the relationships between average individual fruit
weight and summer maximum temperatures .... :... 137
4.31 Contour map of r values for the relationships between average individual fruit
weight and summer mean temperatures 137
4.32 Contour map of r values for the relationships between percentage of
fruit in grade AA & A and climatic parameters 139
4.33 Contour map of r values for the relationships between percentage of
fruit in grade C & D and climatic parameters 140
4.34 Contour map of r values for the relationships between percentage of
169
170 142
142
149
165
166
4.35
4.36
4.37
5.1
5.2
5.3
5.4
6.1
Fruit weight : fruit number after thinning per ha, av Feb temp (C) &
av May min temp (C) .
Fruit weight: fruit number after thinning per ha, av Dec & Jan max temp(C)
Flow chart .
Relationship between root starch and fruitfulness ..
Relationship between starch and soluble sugar content in roots .
Relationship between fruit number in the second year and the root starch
content in the dormant period .
Relationship between fruit number in the first and second seasons .
Fruit size distribution based on a standard deviation equal to 20%of the
mean 174
6.2 Fruit size distribution based on mean weight 135 g with standard deviation
varied 174
A5.1 Relationship between root system weight and trunk CSA 228
A5.2 Relationship between the ratios of the weight of above ground parts to root of trees
LIST OF PLATES
5.1 Root observation under a glass surface on 17 May 1990 167 5.2 Root observation under a glass surface on 19 September 1990 167 5.3 Root observation under a glass surface on 27 July 1991 167
A5.1 The whole tree removed... 226
CHAPTER 1
INTRODUCTION
Crop monitoring work was introduced by Thiele (1983) into New Zealand in the early 1980s' on a range of crops such as blackcurrants, peaches and nectarines and kiwifruit. He
recognised that the fruit tree is a t1system" with roots, tree structure, leaves and fruit all
interacting one with the other and he questioned what biological and economic knowledge existed about the interacting relationships (Thiele, 1981). The monitoring work he initiated, incorporated the tree (or plant) as well as the interacting environment of the orchard, soil and climate (the orchard system). The system, he suggested, was operated by growers by
chance. Growers made individual decisions based sometimes on a prescription supplied by advisers or on information directly or indirectly related to their orchard. The systems
approach, he suggested, together with the development of a data base of information, offered the opportunity to mathematically formulate biological relationships which would allow the efficiency of the fruit tree to be studied as an economic unit (Thiele, 1987).
As the work progressed he initiated a co-operative research project to explore the system approach with the Gala group of apples. The Ministry of Agriculture and Fisheries, Division of Horticulture and Processing, DSIR, New Zealand Apple and Pear Marketing Board and the Department of Horticulture, Lincoln University cooperated in the operation which
commenced during the winter of 1986. The work involved a total of 15 orchards initially in 3 districts. The comparative analysis of year 1 data and the initial relationships were
summarised in a Lincoln College discussion paper by Zaprzalek and Thiele (1987). A Lincoln College dissertation by Zhang (1988) analysed the results of the second growing season. Concurrently Thiele (1990; 1992) worked for a year stationed at the University of Hannover to test the whole system approach to grower education and research with Jonagold apple growers in Germany and the Netherlands. At the same time, systems modelling experts shared their expertise with him on developments in computer modelling. The key aim of this thesis was to develop a computerised apple tree model using the initial 3 years of the Royal Gala data together with additional measurements added to the data base
Before modelling the tree behaviour, it was essential to develop a sampling technique to
allow flower and fruit numbers to be extrapolated to a whole tree basis. Sampling techniques
have been developed in Chapter 3. Based on the original Gala measurements over 3 years,
and additional measurements on Gala and other varieties in the subsequent 3 years, apple
production models have been developed in Chapter 4. In an attempt to explain crop loading
potential and alternate bearing, starch storage analysis of apple trees was conducted and
summarised in Chapter 5. Chapter 6 discusses the key results, relates the work in this thesis
to that of other researchers and recommends the direction of future modelling work in
CHAPTER 2
LITERATURE REVIEW
This chapter reviews recent work on modelling research in Pomology, the climatic effects on apple production and apple production forecasting. Physiological work applicable to this thesis is also reviewed with a specific section on carbohydrate storage in apple trees.
2.1 MODELLING RESEARCH IN POMOWGY
This section reviews some of the key modelling research in Pomology. Although it deals with some of the more detailed physiological modelling work it concentrates on biological modelling and predictive models associated with yield. Development of computer simulation models for fruit crops has been much slower than in agronomic crops because of tree size, structure and longevity (DeJong et al., 1990), but·recent work in fruit research modelling has been in more depth and shows potential for realistic commercial application.
2.1.1 Chilling Requirement
In natural habitats of deciduous trees, dormancy during a cold winter is necessary for the tree to resist cold injury (Lang, 1989). However, the protection of cultivated plants against winter injury may present problems not found in natural habitats. Many cultivated species were either bred for specific fruit-quality factors or have been selected and moved to climates other than that in which they evolved. Thus, many domestic forms are not completely
adapted to the environment in which they are cultivated (Westwood, 1988).
Itis widely recognized that winter chilling temperatures are required for the spring growth of dormant buds. Erez and Lavee (1971), using controlled conditions, observed that a
temperature of 6°C contributed more to rest completion in peaches than any other of their test temperatures (lOOC was about half as efficient in breaking ~est as 6°C). When 21°C was alternated with a low temperature, it nullified the effect of the low temperature.
A specific amount of chilling is required to terminate or break rest and restore the bud's ability to expand and grow again. Weinberger (1950) proposed the term "chilling hours" for winter air temperatures less than 7°C. However, the end of rest is not predictable by a simple summation of the number of hours below 7°C because temperatures slightly above 7°C also have a rest-breaking influence (Ryugo, 1988).
Table 2.1 Chill units calculated by different models
·Corresponding t~mperature (oC) Chill unit values
0.0 0.5 1.0 0.5 0.0 -0.5 -1.0 -1.5 -2.0
Utah model (Richardson et al., 1974)
<
1.4 1.5 - 2.4 2.5 - 9.1 9.2 - 12.4 12.5 - 15.916 - 18 >18
North Carolina Model (Shaltout and Unrath, 1983)
-1.1 1.6 7.2 13.0 16.5 19.0 20.7 22.1 23.3
Two models were developed by Richardson et al. (1974) and Shaltout and Unrath (1983) for
of -2 at a temperature of 23.3°C.
Several papers (Erez et aI., 1979; Anderson, et aI., 1986; 1990; Anderson and Richardson, 1987; Real-Laborde et aI., 1990) reported on testing the models. The Utah model has been criticized for inaccurate predictions of plant response, especially in areas with mild winter conditions (Erez et aI., 1979; Shaltout and Unrath, 1983; Ebertet aI., 1986; Laborde, 1987).
2.1.2 Modelling of Tree Growth
Modelling of tree growth is divided into wood and leaves, and forms the basis of most fruit tree modelling research.
2.1.2.1 Tree Growth and Trunk
The cross sectional area (CSA) and the circumference of the trunk of a tree are the most obvious tree size parameters as well as the easiest measured. Pearce (1952) cited an instance of its use in forestry in 1804. Hoblyn (1931) recommended trunk circumference as a
standard recording in fruit tree research. He said "No single measure is ever sufficient to describe the vigour of a particular tree." Pearce and Davies (1954) suggested that the circumference should ordinarily be measured 12 inches (30 cm) above the graft union.
Martinez-Zaporta (1952) working with pears found that there was a close correlation between increase in trunk circumference and tree height at the end of the first season of growth. The coefficient varied slightly between years and was probably related to the system of pruning. They calculated that trunk circumference can be a useful measurement of annual wood
production. Severe cutting back throughout the first season of growth had no effect on trunk diameter.
Some authors used CSA to estimate apple tree weight (Heinicke, 1921; Sudds and Anthony, 1928; Collison and Harlan, 1930; Knight and Hoblyn, 1934; Pearce, 1952; Westwood and Roberts, 1970). Heinicke (1921) found that the weight of a tree increased about 7.3 times when the trunk circumference was doubled. Pearce (1952) proposed a formula W = AGb,
between trunkCSA and total above-ground weight.
The increment in trunk circumference has been used to estimate shoot growth. It was found by Martinez-Zaporta (1952) that there was a close correlation between increase in
circumference and the height at the end of the first season of growth. Wilcox (1937) found moderate positive correlations of about r = 0.50 between terminal shoot growth and increase in trunk circumference in the same and alternate years. In anyone year though it is not satisfactory by itself, since on biennial bearing trees there is a decrease in the ratio in the same year that the terminal length shows an increase. Overholser et al. (1937) found the
highest r value of 0.705 could be obtained using data over a 4-year period. Moore (1965b) found the increment in powered circumference (ba - a~ was correlated with total length of shoot(> Scm) growth produced during the period. Correlations were higher when
circumferences were raised to powers of between 2 and 5 before calculating the
circumference increment, with the highest correlations usually obtained when circumferences are cubed.
The frequency distribution of shoot length of Ralls and Starking Delicious apple trees with a wide range of age, vigour and pruning treatments was investigated by Kikuchi (1974). A model was proposed to represent changes in the growth status and· structure of the shoot system in relation to tree age and pruning practice. Baumgartner et al. (1986) described a
demographic model for simulating the annual growth patterns of an apple tree. A tree is assumed to consist of a perennial frame with populations of leaves, shoots, fruits and roots developing on it. The dynamics of these populations are simulated as time invariant distributed processes.
Moore (1968a), was concerned with variation of fruit tree size as measured by trunk circumference at the time of planting but he found that the variation had been virtually eliminated by the time the trees had increased their trunk circumference about fourfold.
2.1.2.2 Leaf Area
This .section deals with the leaf as a site for photosynthesis and associated research.
and Harris, 1950). Leaf area was related linearly to stem length based on 5 apple cultivars
studied by Johnson and Lakso (1985). The expression was described as Y = a
+
bX, whereY is leaf area, X is shoot length, a is the interception and b is the slope. Different shoot
types and different cultivars have different intercepts and slopes as shown in Table 2.2.
Table 2.2 The constants (a) and the slopes (b) for the relationship between leaf area and
shoot length (Johnson and Lakso, 1985)
Shoots with terminal Growing shootsZ
Growing shoots
bud set (all shoots) (1 - 20 cm)
Cultivar
a b a b a b
Golden 63.5±15.6 10.0±0.54 25.5± 8.3 9.7±0.38 15.4±3.5 14.5±0.89
Delicious
McIntosh 114.0±36.9 14.0±0.90 39.3±12.2 12.3±0.41 12.3±5.3 16.2±0.82
Milton 21.9± 9.7 11.2±0.29 5.3± 7.1 9.7±0.27 10.2±2.8 8.4±0.36
Jonamac 20.5± 7.8 15.3±0.37 53.8±4.2 12.4±0.60
Delicious 5.5±36.7 1O.4±0.77
Zincludes all growing shoots during the season.
Table 2.3 Parameters for sour cherry leaf and shoot growth (Flore et al., 1986)
Objective
spur leaf area
long-shoot leaf area
leafl~ngth
petiole length
shoot base diameter
Formula
= 18.57(1_e-o.008(degree-days»
= 30. 89(1_e-o.0062(degree-days»
= (leaf area:)lO.605
= 0.256(leaf length)
= 0.05· Sqrt«tota1leaf area above shoot)/30)
Both shoot length and leaf area showed strong linear relationships with accumulated growing
degree-days, but the shoot length relationship showed less varia,bility among cultivars than
did leaf area. The daily leaf area increment per shoot for a 4DC base was defined as
LeafAreamcrement = 0.00008 DegDaY4c (Johnson and Lakso, 1985). Flore et al. (1986)
days accumulated since leaf emergence (Table 2.3).
Detailed measurement of fruit tree growth was taken by Forshey et al. (1983). Twenty-five
8~year-old Mclntosh/MM106 apple trees were harvested 5 times during the 1980 growing
season. For each harvest, .the numbers of spurs, shoots, leaves on the spurs, leaves on the shoots, and fruits were counted. The surface areas of trunk, scaffold, 3, 2 and 1 year-old wood and spurs, and shoots, shoot leaves, spur leaves and fruit were also measured. This provided the basis for' carbon budget research. Dry matter assessment of this work is reviewed in section 2.1.3.4.
2.1.3 Modelling of the Carbon Budget
The purpose of modelling a carbon budget is to attempt a quantitative analysis of the seasonal dry matter and carbohydrate requirements of fruit tree growth and development. A
quantitative carbon budget model of fruit trees could be useful in estimating daily potential tree demands for photosynthates (DeJong and Goudriaan, 1989). The primary sink activities of the fruit would be growth and respiration and the source activity would be photosynthesis.
2.1.3.1 Respiration
The dark respiratory rate was separated into two components (McCree, 1974). The "maintenance" component was associated with providing energy for maintaining what is already present while "growth" respiration provides energy and reductant necessary for the synthesis of new plant material. The maintenance respiration is proportional to the dry weight of the plant and is strongly related to temperature.
Several papers deal with fruit tree respiration studies. Compared to the earlier models (eg Proctoret al., 1976), DeJong and Walton (1989) and Lakso and Johnson (1990) proposed that the basic time step should be one day rather than one minute or one hour. Using the daily integral eliminates the complexity of the diurnal changes in radiation geometry. Lakso (1992) further developed his model to include the leaffall to budbreak period and dealt with discontinuous canopies. Lakso and Johnson (1990) proposed a respiration submodel based on the exponential response of the respiration rate (R) to temperature in different tissues
Table 2.4 Estimated coefficients for respiration
a k T References
leaf 0.066 0.090 Ttime Watson et al., 1978
leaf 0.025-0.090 (Tmax
+
2Tmin)/3 Lakso & Johnson 1990 wood 0.004-0.010 0.085 Tmean Lakso & Johnson 1990 fruit 0.003-0.020 0.055-0.100 Tmean Lakso & Johnson 1990The respiration rates for leaves are based on one-sided surface areas. The rates for wood are based on wood surface area since different aged wood of different volumes gives similar respiration rates when expressed on a surface area basis. Fruit respiration is based on fruit fresh weight. Individual tissue submode1s for leaves, fruit and perennial structure (wood) were developed based on different a and k coefficients (Table 2.4).
Research with tart cherry (Pollack etal., 1961), grape (Pandey and Farmahan, 1977; Koch and Alleweldt, 1978) and apple (Krotkov, 1941; Jones, 1981) all indicate similar patterns of fruit respiration during fruit development. Fruit usually have high initial rates of respiration per unit dry weight during early fruit growth, gradually declining during later stages of growth. For example, the work of Jones in England (1981) showed that the response of the respiration rate of apple fruit at 20°C in the dark declined from 120 ng CO2/s· g fresh weight at 4 weeks after full bloom to less than 3 ng/s •g fresh weight by late September. Maximum rates of peach fruit respiration per unit weight at 20°C were similar for the two cultivars used during the first two stages of fruit growth but higher for the early cultivar during the final stage of fruit growth (DeJong etal., 1987). At the same temperature, respiration rates were low when apple trees were dormant, rose rapidly to a peak in spring (before full bloom) and then declined steadily through the season (Butler and Landsberg, 1981).
Many papers have calculated the respiration cost. The cost of growing a kiwifruit berry with 18.5 g dry matter near Fresno, California was 25.6 g glucose per fruit per season (Walton and DeJong, 1990). This could be partitioned into 19.68, 2.73 and 3.19 g glucose per fruit per season for carbon skeletons, growth respiration and maintenance respiration,
(Loescher et aI., 1986) and 16.3 - 20.5% for peach fruit growth (DeJong and Walton, 1989). Lakso and Johnson (1990) working with apple trees, calculated that, of the total of 23 kg of CO2 respired over the whole season, leaf respiration accounted for about 71%, fruit
respiration about 18 %, and wood respiration about 11%. Kappes and Flore (1986) estimated that respiration used 30.9% of the total carbohydrates required of sour cherry trees. During fruit.development stages I, II and III the share of respiration was 32.7,70.7 and 19.91%, respectively. The increased need for respiration during stage II is because of lignification and lipid synthesis during pit hardening and embryo development. DeJong et aI. (1987) also reported daily peach fruit respiration rates per unit dry weight and per fruit throughout the growing season.
Sruamsiri and Lenz (1985) working with strawberries reported that, during changes from light to dark, photosynthesis and mesophyll conductance decreased sharply, but dark respiration rates reached their maximum values only 16 minutes after darkening.
2.1.3.2 Light
A model for the distribution of solar radiation incident on leaves in an isolated apple tree was presented by Thorpe et aI. (1978). The simulated area of shadow cast by a tree compared well with measured values. Models by Charles-Edwards and Thorpe (1976), Jackson and Palmer (1980), Palmer (1988) and Wagenmakers (1990) also emphasized sunlight
interception by different orchard designs and were helpful in clarifying some important interrelationships of orchard design, light interception and productivity.
Palmer (1980) claimed that light interception by an orchard can be increased by reducing the spacing, increasing the height and spread of trees and increasing the leaf area index (LAI). Computer modelling of light interception by hedgerow trees has produced the following conclusions. Ifthe LAI is low (less than 1) then, within quite wide limits, tree size and spacing have little effect on light interception. At higher LAIs, tree size and arrangement become significant factors if there are wide alleyways, but the closer an orchard
approximates to a continuous cover of leaves the less important these factors become. Light interception gives an indication of potential yield; the actual yield can be reduced by serious within-tree shading. Palmer's model was also used to map the light distribution patterns within full-field, spindlebush and palmette orchards. Over a wide range of hedgerow
dimensions and between-row spacings, a linear relationship was found between the maximum light interception achievable before serious shading occurs and the maximum light
interception which would be achieved if the trees were solid. From this it is now possible to predict the LAI needed to maximize production of top quality apples. Any further increase in leaf area, Palmer claimed, will only lead to the production of small fruit, although total yield and dry matter production will increase with the increase in light interception.
Predicting light interception and potential yield, by a range of hedgerow tree forms and spacings, was also used as a guide to the design of orchard systems for mechanical
harvesting (Jackson and Palmer, 1980). Cervenka (1978) investigated the orientation of the leaves in the crown of apple trees and the absorption of solar radiation in USSR. A
mathematical model was produced from measurements during August/September of leaves (including inclination of the halves of the leaf blades) on shoots and spurs, in the crown of a lO-year-old Goldenspur apple tree on M9 rootstock, to quantify the absorption of
photosynthetically active solar radiation on windless and cloudless days.
2.1.3.3 Photosynthesis
Proctor et al. (1976) presented light response curves of photosynthesis, light compensation, photosynthetic efficiency, photorespiration, dark respiration and soil respiration of young apple trees in Canada. They also calculated the carbon accumulation between 7 July to 12 August. Papers by Watson et al. (1978) and Thorpe et al. (1978) also reported
photosynthetic measurements and relevant coefficients. At a saturating photon flux density, photosynthesis Pn was linearly related to internal CO2 concentration Ci , up to
q
= 250mg/m3• Optimum temperatures for Pn were slightly different in the two years and were in
on maximum photosynthetic rates and concluded that the maximum CO2 uptake rate for apple leaves at normal CO2concentrations, under saturating light, is about 1 mg C02/m2•s.
DeJong and Doyle (1984) reported that peach leaf photosynthetic capacities changed very little during different periods of fruit growth. During the early stages of fruit growth there were no significant differences in leaf gas exchange characteristics between fruiting and defruited trees. During the early part of the last stage of fruit growth, CO2 assimilation rates were 11 - 15%higher in fruiting trees than defruited trees. DeJong (1986) believed that the fruit effect on photosynthesis is primarily related to stomatal behaviour.
An integral model for daily gross photosynthetic rate per unit ground area was developed by Lakso and Johnson (1990) allotted on a per tree basis (in g'C02/m2•day):
Pdaily = aShPmax(l-e-kL)1(akS
+
hPmax)where a = leaf photochemical efficiency in p.g C02/Jouie total radiation;
S = daily integral of total radiation on a horizontal surface inMJ/m2•day; h = daylength in seconds;
Pmax = rate of light saturated leaf photosynthesis in g/m2•s; k
=
canopy light extinction coefficient;L = leaf area index per total area allotted per tree.
The temperature effect on photosynthesis is included as a fractional reduction of Pdaily
estimated by the normalized equation Pfract = -0.026
+
0.0436T+
0.OOO94T2 -0.000043T3• This relationship gives a maximum at about 28°C and zero at 0 and 44°C.2.1.3.4 Dry Matter Production
following season was 48.8%. Palmer (1988) measured the yield, leaf area and dry weight over the first 5 years of Cripsin/M27 apple trees grown in a bed system. By the third year, the population of spurs was much larger; 56% of the leaf area wa~ from spurs. From the third to the fifth year these trees produced 78 t/ha fresh weight of fruit, and 17 t/ha of dry matter of which 65 % was fruit, 23 % leaves and 12%woody tissue including roots. Trani et
al. (1981) reported the accumulation of dry matter in 20 to 120-day-old apple fruit, fruit production per tree and per ha and major and minor element accumulation.
Dry matter production can also be calculated by modelling photosynthesis and respiration. Hansen (1971) calculated that only the development of the first 5 to 6 leaves was dependent on reserves; after that, the shoots became self-sufficient by photosynthesis, that is the leaf becomes a carbohydrate exporter before attaining a quarter of its final area, about 12 - 15 days after emerging from the bud. Johnson and Lakso (l986a; 1986b) provided a similar result from a carbon balance model. The model was based on measurements of net photosynthesis and dark respiration rates and estimates of the dry weight in the different components of the shoot. Under the prevailing weather of 1981 in New York, the model indicated that a shoot growing to a final length of 50 cm became a net exporter of
carbohydrates 19 days after budbreak, a time corresponding to a shoot 4 cm long with 10 unfolded leaves. Assuming the same early growth rates, a shoot with a final length of only 2 cm starts exporting at 15 days after budbreak. The total export of carbohydrates remains higher from short shoots than long shoots until 36 days after budbreak, indicating that short shoots supply greater amounts of carbohydrates to the rest of the plant during this early period. The model estimated the total import of carbohydrates from reserves of about 165 mg for a long shoot and 80 mg for a short shoot. In each instance, these reserves only accounted for about 20% of the total carbohydrates used by the shoot up to that point. The remainder was supplied by current photosynthates. Increased light reduced carbohydrate import and caused earlier and greater export. Increased temperature augmented carbohydrate import and the subsequent rate of carbohydrate export. Short shoots had a greater initial rate of carbohydrate export and continued to export more total carbohydrates than long shoots for about 30 to 50 days after budbreak. Slow leaf area development at a given temperature had little effect on carbohydrate import but delayed the beginning of export. Kappes and Flore
for the terminal leaf. The onset of export seems to depend on the leaf position. Itwas also estimated that fruit produced 11.2 % of their required carbohydrate. During stages I, II and III of fruit development, fruits produced 19.4, 29.7 and 1.5% of the carbohydrate used during the respective stages. This shows the importance of fruit photosynthesis during its early development when leaf area is still small.
Walton and Fowke (1992) reported specific costs of kiwifruit for a growing season
(g glucose/g dry weight) ranged between 1.16 and 1.26 for leaves, 1.15 and 1.35 for shoots, and 1.17 and 1.27 for fruit. Mean specific cost for fibrous roots was 1.17 g glucoselg dry weight. The biosynthetic cost (kg glucose per vine) was approximately 25% more than the biomass. The cost of growth respiration was approximately 17% of the total cost of synthesis. In a grape growth model, Gutierrez et al. (1985) proposed that photosynthate is allocated first to respiration, then fruit and reserves, and lastly to vegetative growth. Buwalda and Lenz (1992), working with apples, reported that cropping significantly increased total biomass in spite of the reduction of leaf and root biomass.
Rud' et al. (1982) reported that Starkrimson apple trees produced 8.5 - 12.6% greater phytomass annually and made better use of photosynthetically active radiation than the cultivar Prize Wagener. Starkrimson yielded 438.6 and 433.0 centners (Russian unit)/ha in the 5th and 6th years after planting and the proportion of the yield in the annual phytomass increment, in terms of economic productivity, reached 37 - 45 %. In Prize Wagener the corresponding values for a yield of 172.5 centners/ha were 19 - 19.6%, and 31 - 36% for yields of 226.6 - 317.6 centners/ha.
Heim et al. (1979) compared the dry matter production of young Golden Delicious apple trees in Montpellier, France and Bristol, England in 1975 - 1976. Montpellier received 18% and 24%more radiant energy than Bristol in 1975 and 1976, respectively. For the
respective years, dry matter production in Montpellier was 12 % and 25%greater than in Bristol.
The tree model consists primarily of organ and physiology submodels. Organ submodels represent 6 physiologically distinct organ groups: leaf biomass, current-season extension shoot biomass, stem biomass, root biomass,· fruit biomass and stored reserve carbohydrate biomass. The three physiology submodels include resource production, resource allocation, and tree-environment interactions. The model can also be easily interfaced with disease or insect pest models. The model program, written in FORTRAN V, allows the user to
progress through a growing season by use of a set of 16 commands. The command structure permits the user to display and/or alter 83 of the simulation variables at any time during the simulation process. Although the model program was developed on a large computer system it was modified to run on a microcomputer.
Some other programs developed include the "Stella" dynamic simulation model for an apple tree (Lakso and Johnson, 1990), models on peach fruit (DeJong
et ai.,
1990), on kiwifruit (Buwaldaet ai.,
1990), and on citrus (Harpazet ai.,
1990).2.1.4 Modelling of Nitrogen
Nitrogen (N) is one of the most important factors affecting plant growth. In spring, the i~itialcarbohydrate reserves do not determine the amount of new growth, whereas reserve N is of decisive importance for shoot growth vigour (Tromp, 1983). Spring leaf growth of a deciduous tree depends largely upon the N supply of the previous year through the
remobilisaton of N stored during the winter (Habib and Millard, 1992).
Photosynthesis depends not only on climatic factors such as solar radiation and temperature, but also on the demand for dry matter. The demand for dry matter is affected by N status of the plant. An experiment by Wermelinger and Baumgfutner (1990) on grapes showed a proportional allocation of the photoassimilate to its three sinks, maintenance respiration, reproductive growth and vegetative growth, depending on the level of soil N. With increasing N deficiency, higher proportions of assimilate were incorporated into the fruit. The allocation to vegetative mass reacted conversely, whereas maintenance respiration remained at 35% of the total carbohydrate production at all levels of soil N. At a hypothetical soil N content of zero, 40% of the standard yield was produced but plant N reserves were completely depleted at the end of the growing season.
soil, were given 3 levels of N fertilization for 26 years of monitoring nutrition in an apple orchard (Gautier, 1976). The maximum yields (375 - 409 kg/tree) were obtained with 170 kg N/year for the first 18 years, followed by 250 kg/year. During the growing season, potted 2-year-old Golden Delicious apple trees were given low N (1 - 2.3 meq/litre of nutrient solution) or high N (10 meq/litre), supplemented in some cases with 0.5% or 2.0% urea sprays (Hansen, 1980). Terminal shoot growth increased with the duration of high N supply, especially with early summer application and a correlation with leaf N was
established. Flower density decreased only at continuously low N supply. Fruit set is dependent to a certain extent on the N status of the tree. Itis indicated by leaf values immediately after flowering when the N concentration of the spur leaves should be 2.8 -3.0% or more to ensure a proper fruit set. Fruit growth at a defined fruit/leaf ratio increases with N supply. The N supply during the early part of the fruit growth period was the more important.
A dynamic simulation model of total N partitioning in a whole peach tree was developed by Habib et al. (1990). Four compartments, roots, trunk, shoots and leaves, were considered.
The main assumptions of this partitioning model were:
i only certain of the flow pathways between compartments need to be considered;
ii for each compartment, the rate of N outflow depends on N content of that compartment (source capacity);
111 the rate of N outflow from a compartment is proportional to the sum of rates of dry
matter increase in the compartments that can act as sinks for that compartment; iv total outflow from a compartment is divided among the compartments that can act as
sinks according to their rates of dry matter increase (sink equality).
The results of the N allocation model were compared to the N data from l-year-old peach trees in sand culture from the beginning of the growing season until after leaf fall. It showed that the fitted data were very close to the measured values. Loisel et al. (1992) stated that
the transport coefficients were also estimated by fitting the model to the amounts of N in each plant compartment at each measured date. These may be used for calculating N fertilization strategy to optimize various objective functions.
N withdrawal from senescing leaves, a negative growth rate was suggested to allocate N back from leaves to other tissue.
2.1.5 Modelling of Evapotranspiration
Blanke and Lenz (1985) reported that transpiration rates of apple fruit were low compared with leaf values and decreased during fruit development from June to October in Germany. In the early stages of fruit development, fruit stomata seemed to function similarly to those of leaves. Inearly June they were 20 - 30 p. in length and 10 - 25 p. in width with a
frequency around 25 per mm2, decreasing to
<
1 per mm2 when fruit reached its final size.Blanke and Lenz (1988) working with pot-grown Golden Delicious apples, measured the transpiration of attached fruit. from anthesis to harvest. Fruits were enclosed in a perspex cuvette and the transpiration rate determined by dew point hygrometry. Under laboratory conditions, each fruit transpired 100 ml water during its development. Increasing
temperature or light intensity increased transpiration, particularly in the early stages of growth. Under field conditions, each fruit transpired about 50 ml water, equivalent to about 8.5 litres per tree and 18700 litres per ha. Fruit accounted for about 6% of the total water transpired.
grass cover (Anderson et al., 1992).
"Epidermis-free parenchyma" tissue of fruit may be found in split cherries and plums or injured apples and pears (Leuschner etal., 1982). This influences the behaviour of such fruit. Model studies on Golden Delicious apple were conducted in relation to pressure, temperature and humidity. Theoretical derivations concerning temperature decline and water losses in injured apple surfaces were compared with experimental findings and the results showed qualitative agreement.
2.1.6 Modelling of Physical Injuries
Some models have been developed for apple impact bruising in harvesting and packing (Sarig and Little, 1978; Holt and Schoorl, 1983; 1985; McLaughlin and Pitt, 1984; Gan-Mor and Galili, 1987a; 1987b; Siyami etal., 1987; 1988) and in transport (Schoorl and Holt, 1985; Church and Peterson, 1988) and storage (Kok and Raghavan, 1984; Baumann, 1986; Sass and Lakner, 1989).
2.2 EFFECT OF CLIMATE ON FRUIT PRODUCTION
To simplify analysis of the climatic factors affecting yield, they can be classified into exogenous and endogenous variables. The effect of weather, climate, soil type and management are exogenous on the system, while the inherent genetic, hormonal and physiological behaviour of the apple tree system, acting either independently or in combination, are endogenous (Beattie and Folley, 1977).
The effect of climate on fruit production has been reviewed by Pereira (1975), Landsberg (1977), Lakso (1987), Lakso et al. (1989) and Lakso (1990). From the plant physiological point of view, climate influences photosynthesis, respiration and stomatal behaviour
(Landsberg, 1977; 1980). Long-term shading during most of the season is detrimental to fruit size (Lakso etal., 1989). Although some climatic parameters differ by 60%, Folley (1973) postulated that the potential yield of commercial apple orchards in southern Europe is less than 50 % greater than on good sites in northern Europe.
and non-extreme weather. Extreme weather factors include the chill requirement (in section 2.1.1) and spring frosts which have a clear influence on fruit production.
2.2.1 Spring Frost
The clearest relationship between yield and an exogenous climatic factor is that of severe frost causing tissue damage to spring growth and flowers resulting in loss of crop (Beattie and Folley, 1977; Fischer, 1980). Late-flowering cultivars of apples showed significantly less frost injury but a long flowering period showed no advantage (Vogi and Patzold, 1987). Because there was a close correlation between frost hardiness evolution and phenology a frost resistance submodel was tried by Winter (1986b). This submodel computed the LT50 frost hardiness level for buds and flowers. This level was checked back every day with the minimum temperature. Using a normal distribution, the percentage of damaged organs was estimated for temperatures near the LT50 level. The results were very closely related to real observations over the past 24 years. The percentage of frost-damaged flowers of sweet cherry was negatively correlated with fruit yield per tree (Grossmann and Stortzer, 1985). They presented a multiple regression equation for the calculation of expected sweet cherry yields from the percentage of frost-damaged flowers and the number of reproductive buds.
There is extensive literature on frost control methodology which is considered outside the field of this review. For example, Davies et aZ. (1987) worked on temperature predictions in an orchard with water sprinklers and Heinemannet aZ. (1992) developed a theoretical model based on easily measured parameters such as sprinkle application rate, temperature of water applied, air temperature and wind speed. Hamer (1981) delayed flowering by 14 days in apples subjected to water sprinkling and hence evaporative cooling.
Other extreme weather conditions affecting apple yields include extremely low temperatures in winter, hail storms, excess rainfall, drought and high winds. Of more importance to the work in this thesis are the non-extreme weather conditions as reflected in daily, weekly and monthly variations in temperature, sunshine hours and rainfall.
2.2.2 Non-extreme Weather Conditions and Their Effect on Apple Production
regression analysis the interpretation of the conclusions may be complicated by other factors
such as ·changes in technology. Beattie and Folley (1978) analysed a long-term (1949 - 1975)
variation in yield of English apple orchards and of 2 main cultivars, Cox's Orange Pippin
and Worcester Pearmain. The equations of yield per hectare were fitted using annual
weather and alternate-bearing as variables. The regression model explained 64 - 74% of the
variance in yield, of which weather contributed 9.6 - 21%. Multiple·regression analysis of Cox's Orange Pippin yields, from 1949 to 1975, showed a linear upward trend of
O.254±O.039 t/ha per year. Jackson and Hamer (1980) thought this was probably
attributable to advances in technology rather than to weather influences. Clearly time series
weather data of this nature is suspect when other variables develop such as improved
technology.
Yield is not the only parameter to consider. Quality, particularly fruit size, as it affects
returns, must also be taken into account when interpreting climate-plant interactions.
2.2.3 Effect of the Previous Autumn's Weather
Temperature in the period from fruit harvest to the loss of leaves was found to be positively
correlated with the following year's yields (Lakso, 1987). Delaying autumn senescence in
young Delicious apple trees markedly increased flowering in the following season even
though no additional growth could be seen. However, the potential importance of
post-harvest conditions could be seen in the growth of young trees in a cooperative study at Long
Ashton, England and Montpellier, France i(Heim, 1979).. These researchers found that from
bud-break to harvest, the total dry weight gained by trees in each location was not
significantly different. Yet, after harvest, the trees in Montpellier gained about 25%of their
total weight before leaf fall compared to about 5%in Long Ashton. Also, the trees grown in
warmer Montpellier produced more blossom than the Long Ashton trees the following
spring. Observations of biennial bearing of apples in Hungary also led to the conclusion that
the crop in the "off" year depended very strongly on the warmth and length of the period
after the previous "on" year harvest (Lakso, 1985). The reasons for this were not
elucidated, but this period is known to be important for the development of flower buds and
roots and storage of nutrient reserves for the next year. Itis not surprising that weather can
be important to these processes (Lakso, 1987). However, Beattie and Folley (1977) did not
2.2.4 Pre-blossom
There is a particularly interesting negative effect of warmer than normal temperatures in late winter on subsequent apple fruiting. This was initially observed for apples in 1927 by a statistician for the US National Weather Service who was looking for correlations between weather patterns and agricultural yields (Mattice, 1927).
Beattie and Folley (1977) reported a clear association between mild weather in the pre-bloom period arid poor yields in the apple-growing areas of north west Europe. A strong negative correlation
(?
= -0.86**) was established between the mean yield in each year and the accumulated degree-days (over 5°C) for the early spring period February to April inclusive in the same year in England. The yield of Cox's Orange Pippin apples varied greatly from year to year during the 1949 - 1975 period of analysis. A high mean maximum temperature during the February to April period was associated with low yields for all varieties studied by Jackson et al. (1983) in England. Lakso's (1987) data in New York also supported thesefindings. Four factors, time, mean daily maximum temperatures in February to April, days required to complete pollen-tube growth and mean daily maximum temperatures in June together accounted for about 80% of the total variation of apple yield according to Jackson and Hamer (1980), working with apples in England. Although high temperatures in early spring led to early blossoming, this was not associated with greater frost damage or lower temperatures at the time of pollination. Their interpretation was that the adverse effect on yield of high pre-blossom temperature is a negative effect on flower quality and fruit setting potential.
Goldwin (1982) used daily meteorological data to establish two very high correlation coefficients between apple yield per ha and climatic data in England. Mean maximum temperature over 45 days, starting 99 days after full bloom (August and September) gave an r value of 0.96. Mean minimum temperature for a 46-day period commencing 79 days before full bloom (February and March) gave an r value of -0.86. The relationships established with data for the years 1969 - 1973, proved reasonably accurate for predictions made for the 1974 - 1979 period.
Table 2.5 Controlled temperatures for experiments with apples
Treatment Dormant- Bud break- Green cluster Pink bud- Petal fall-Bud break Green cluster -Pink bud Petal fall Harvest
°c °c °c °c Glasshouse
1- 8 11 14 18 at 17°C
2 8 11 14 14
3 8 11 11 14
4 8 11 11 11
5 8 8 11 14
6 8 8 11 11
7 8 8 8 11
8 8 8 8 8
9 4 8 11 14
10 4 8 11 11
11 4 8 8 11
12 4 8 8 8
13 4 4 8 11
14 4 4 8 8
From the 14 treatments, the primary leaves of trees in treatments 9 to 12 were of a very healthy, dark green colour and the flower.s, which reached full-bloom during May, were particularly large. They set well and cropped heavily.
Trees in treatments 5 to 8 flowered throughout April, and a high initial fruit set was followed by a period of steady fruitlet abscission until about 8 weeks after full-bloom. The trees made very little vegetative growth, but cropped heavily.
Trees in treatments 1 to 4 flowered at the end of March, but the flowers were small and the primary leaves a pale green. Initial fruit set was poor and the majority of the flowers abscissed rapidly without swelling.